
What a -5% NASDAQ Means Going Forward
The August 2022 CPI report came out worse than expected today.
Investors clearly don’t like inflation. After a massive stock selloff, many are wondering what a -5% NASDAQ means going forward.
Let’s dive in!
What a -5% NASDAQ Means Going Forward
In a turn of events, the usual culprits of energy and food were far less of a factor than prior months. Energy prices fell with the exception of energy services, while food costs didn’t rise as much as in May, June, and July. The problem however was seemingly everywhere else. Core inflation rose in 12 of 21 categories being:
- All items
- Food away from home
- Energy services
- Utility (piped) gas service
- All items less food and energy
- Commodities less food and energy commodities
- New vehicles
- Apparel
- Services less energy services
- Shelter
- Transportation services
- Medical care services
Prices fell in 5 of 21 categories being:
- Energy
- Energy commodities
- Gasoline (all types)
- Fuel oil(1)
- Used cars and trucks
Here is the report summary:
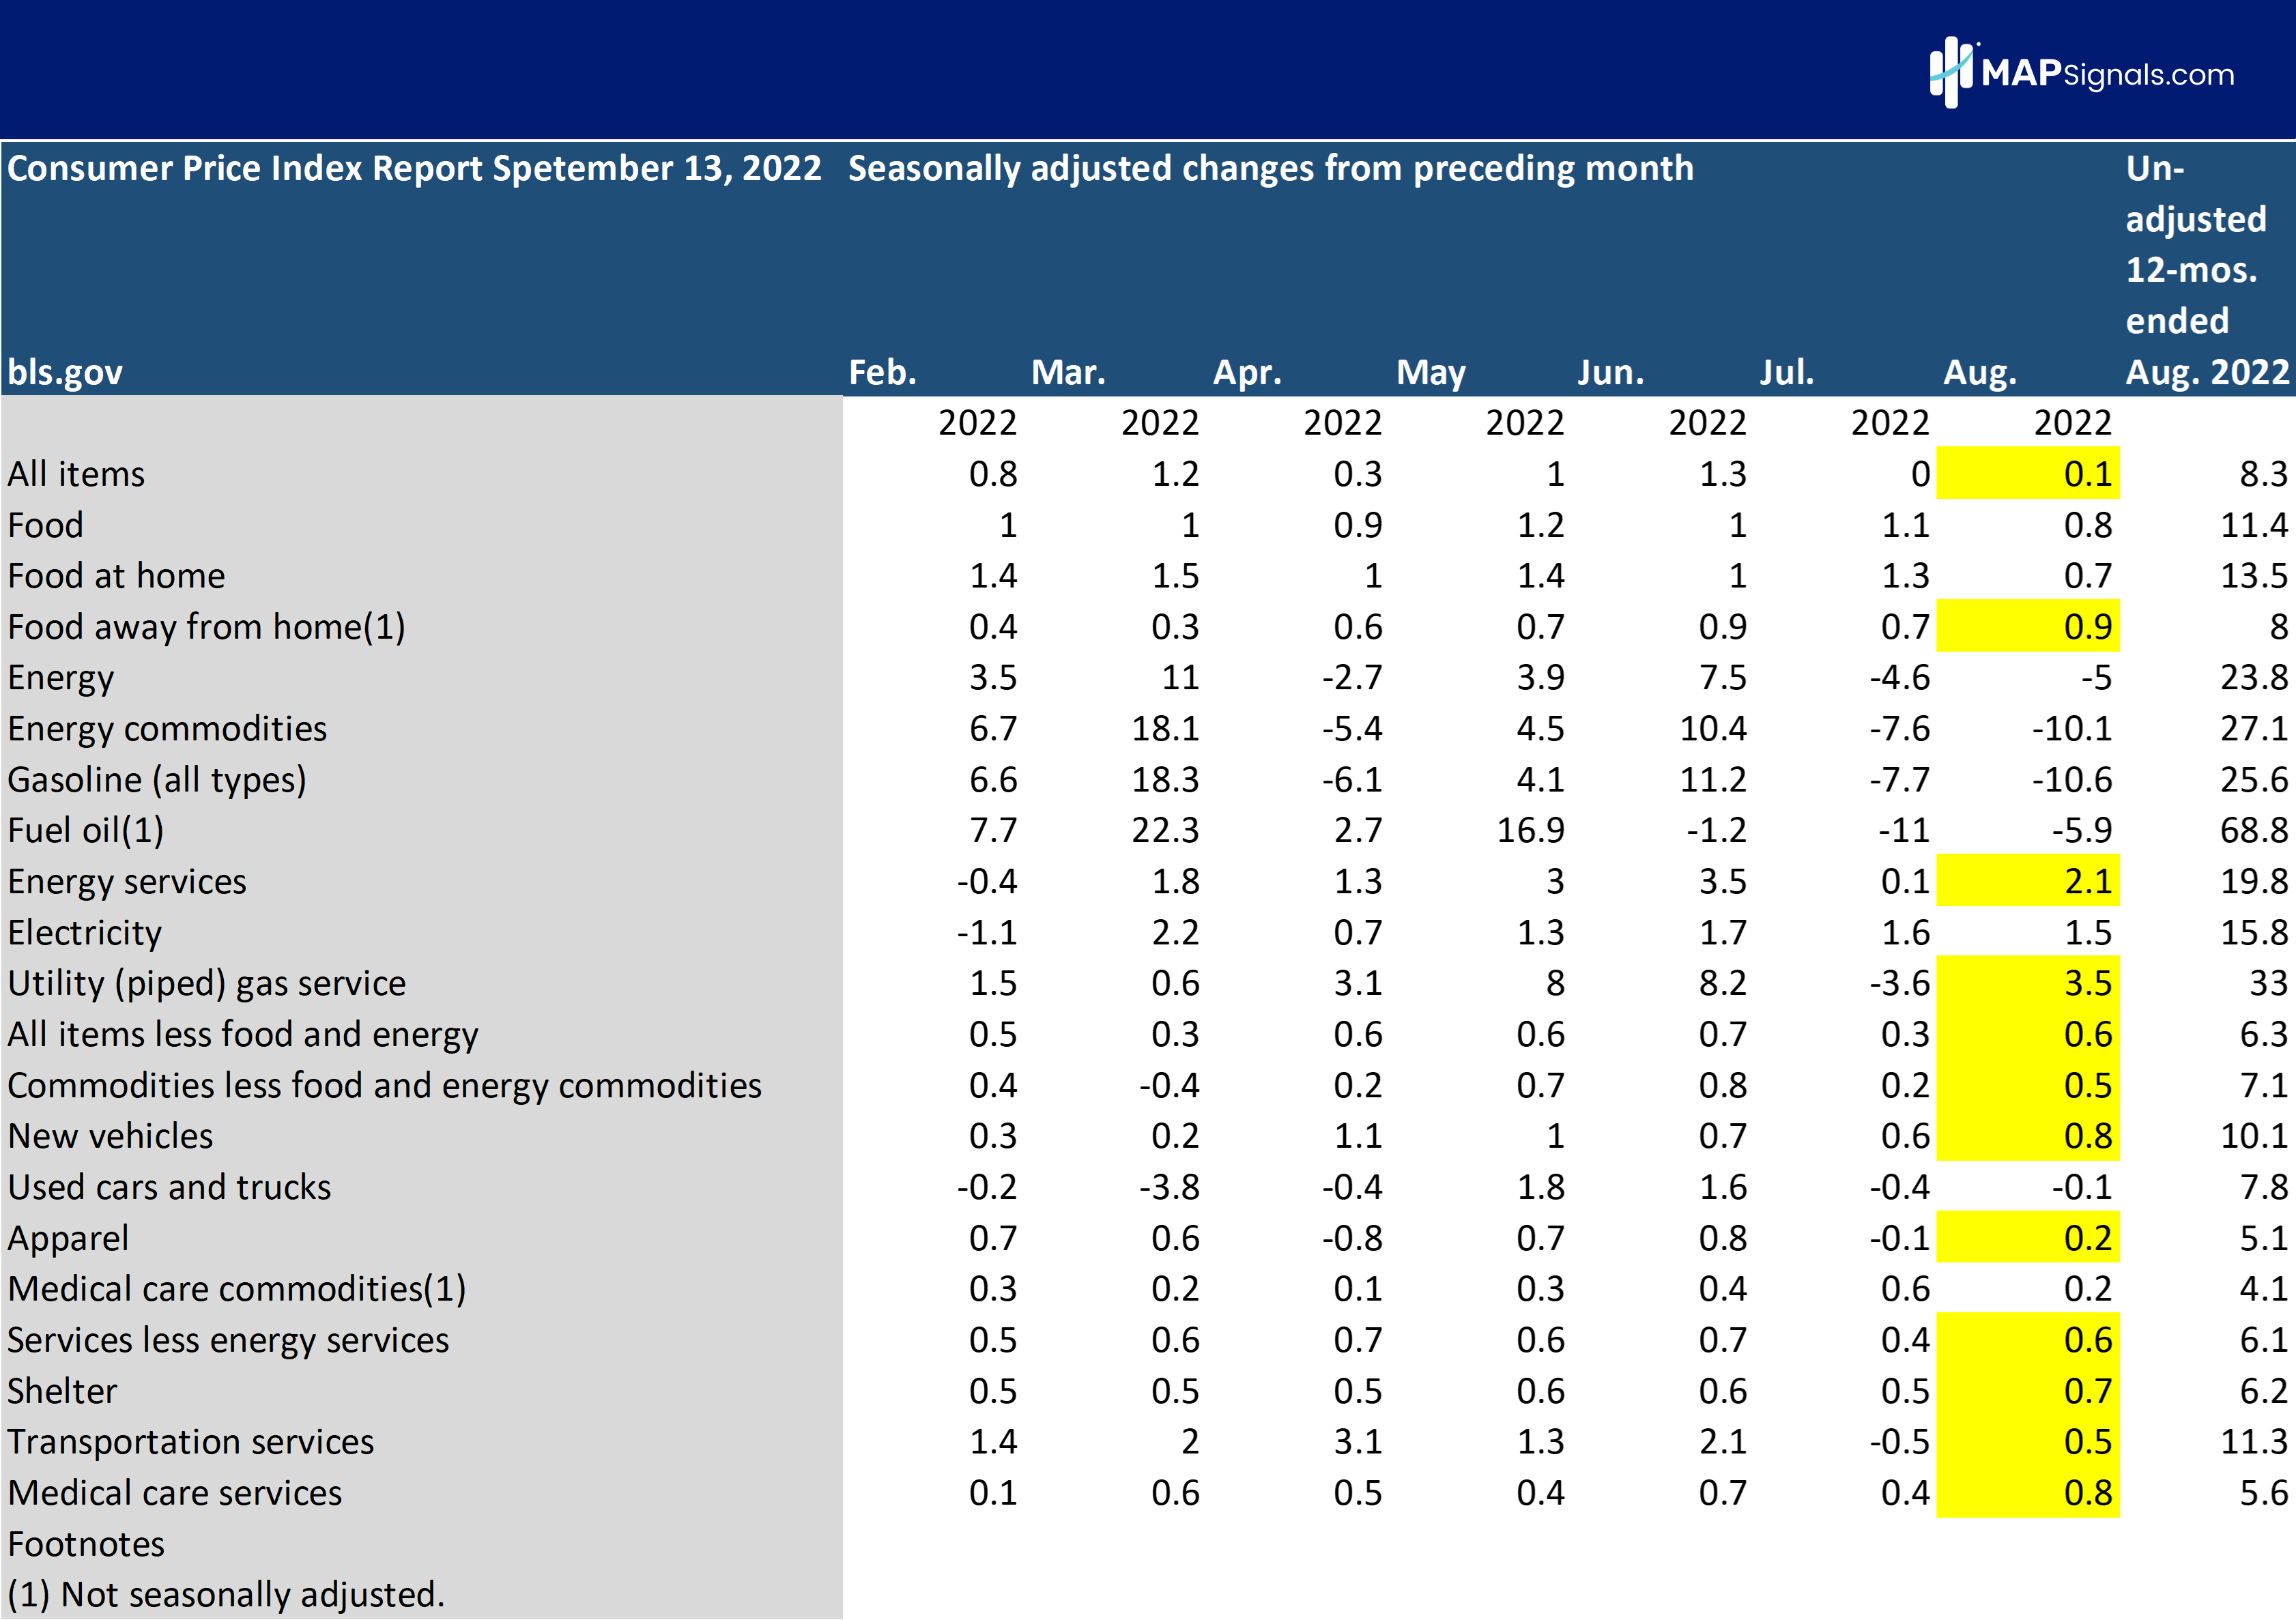
The truth is, this caught the investor world flat-footed as expectations were for a lower inflation report- not a higher one! This roiled equities, pounding the market with the worst single day finish in the NASDAQ Composite index since June 11, 2020. The NASDAQ Composite index closed on Tuesday September 13th, 2022 with a -5.16% finish.
The immediate question that comes to mind is: what can we expect in the coming days and weeks after such an event? We must wait for MAPsignals unusual selling data to populate tomorrow, but we can look at similar days of disastrous performance for context.
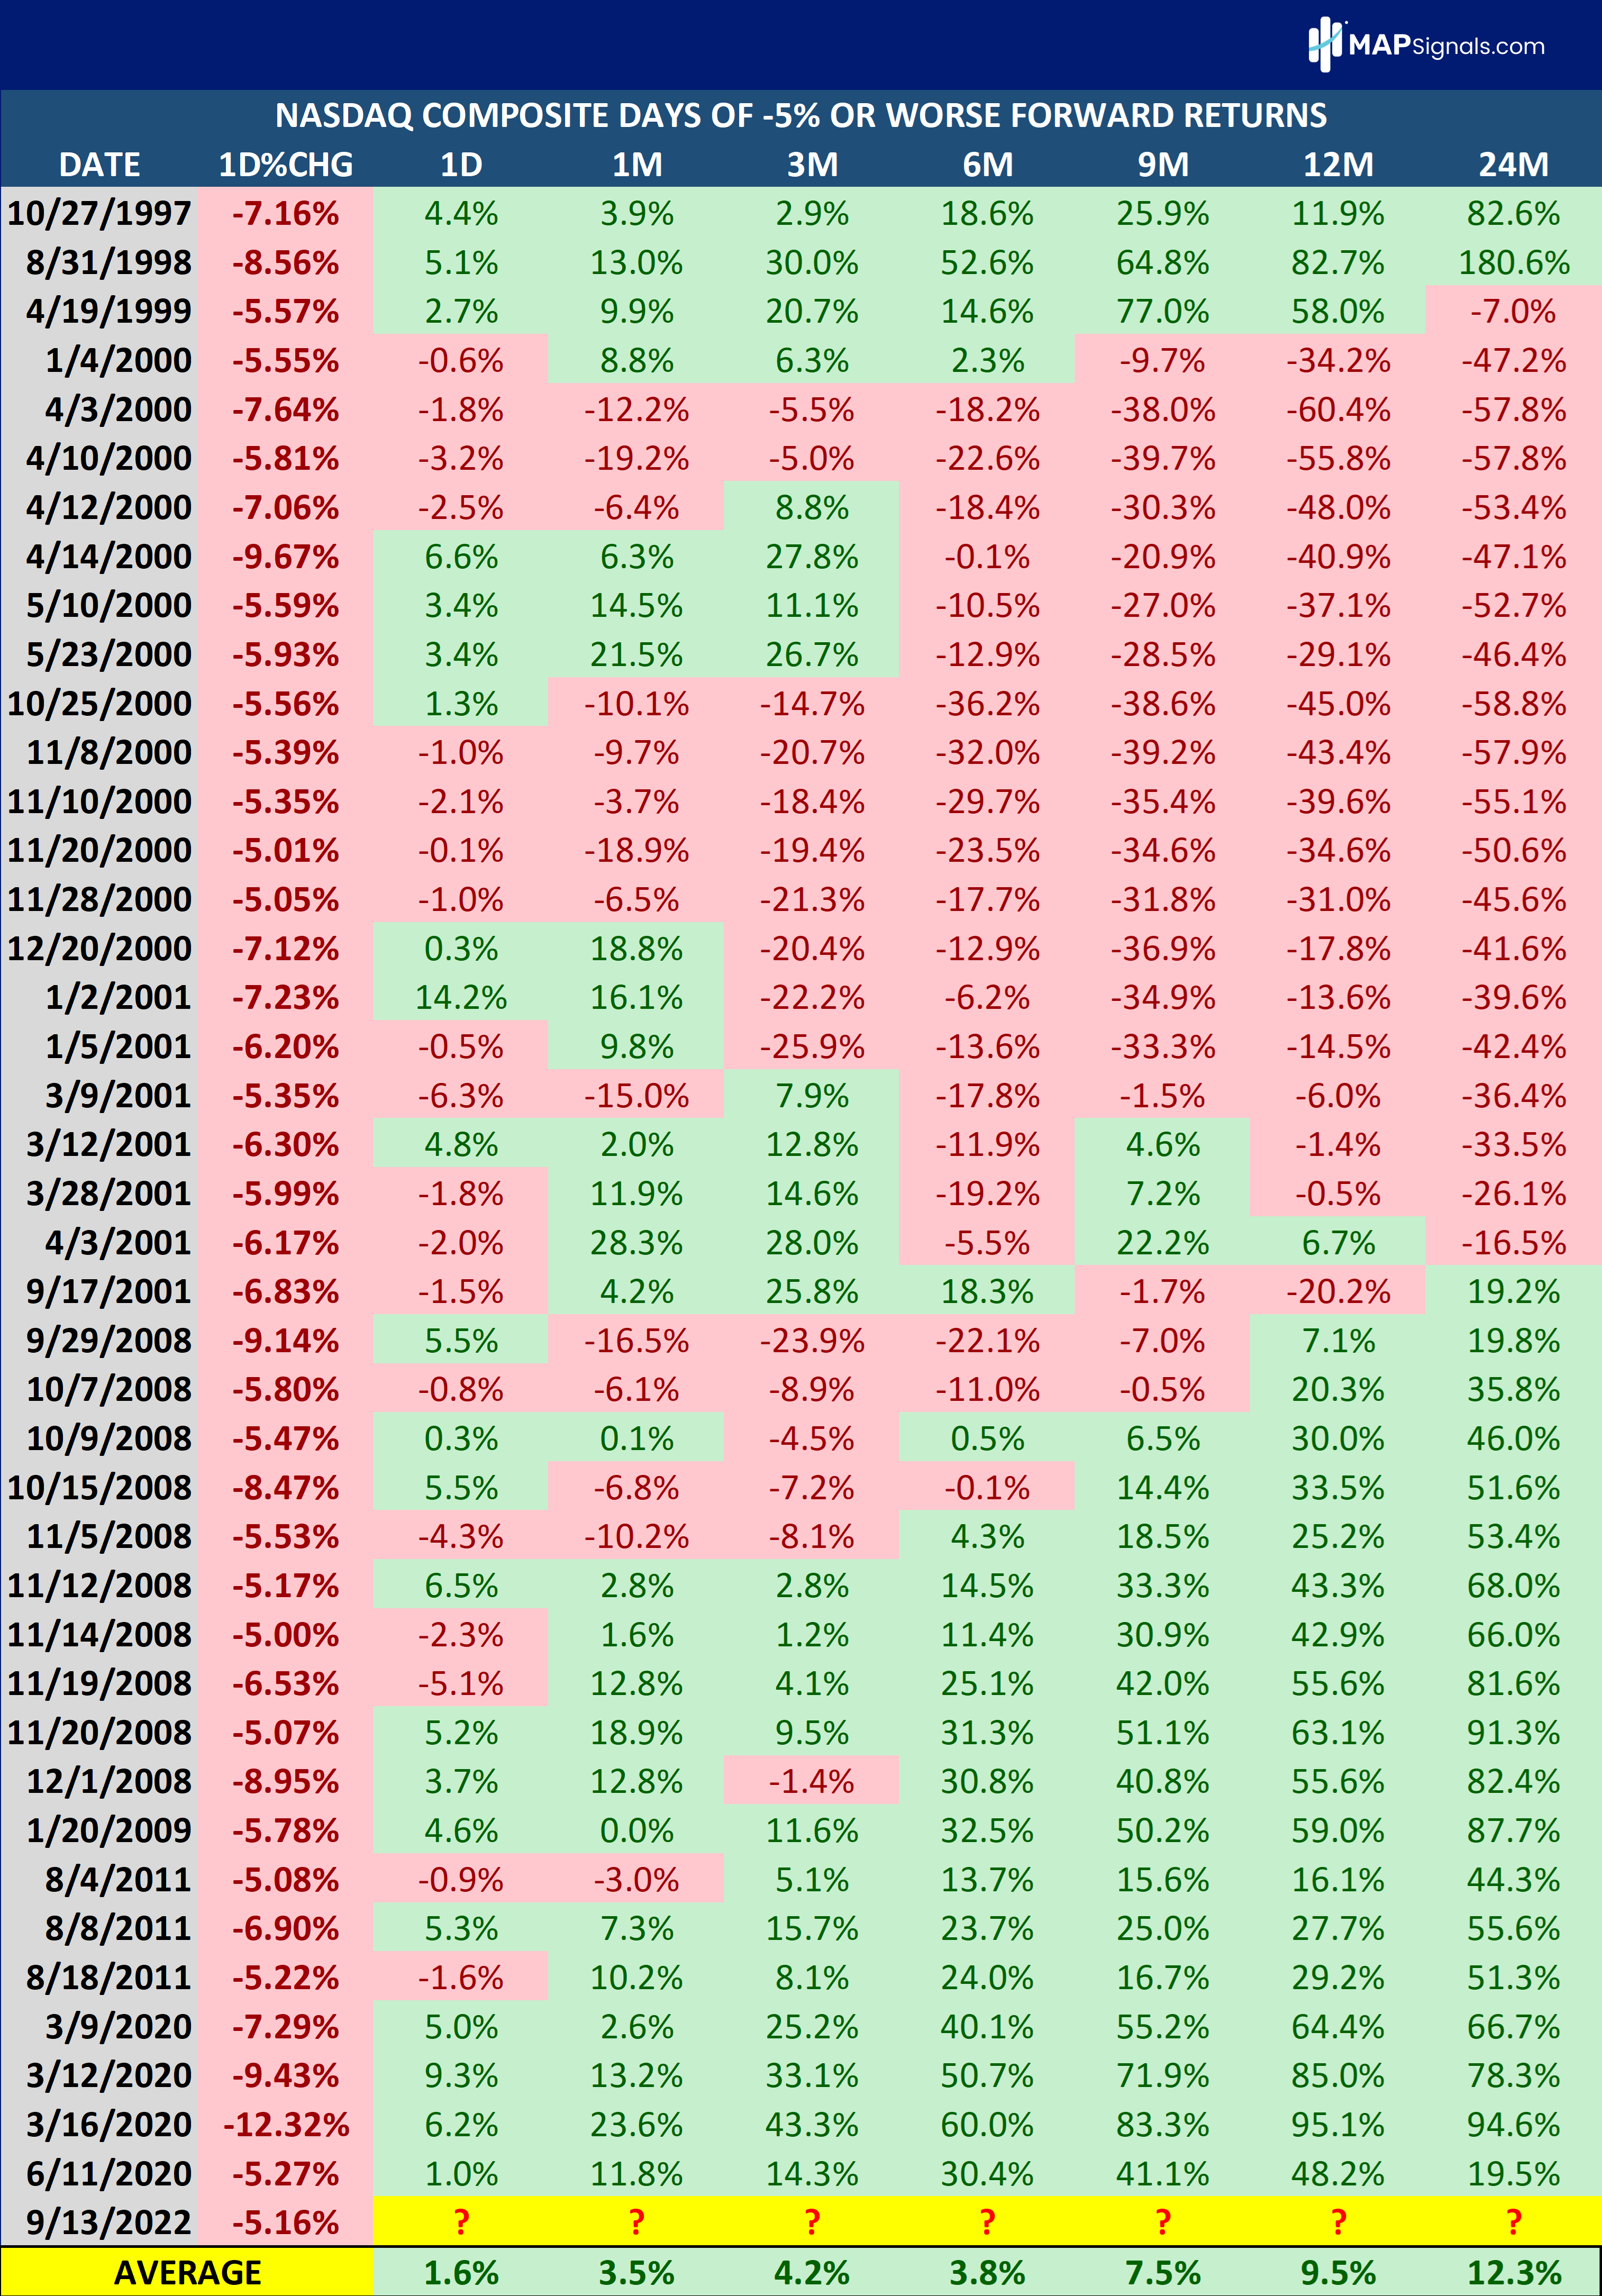
We looked for all the days in which the NASDAQ Composite closed -5% or worse. Tuesday was the 42nd trading day since 1990 that this occurred. The prior 41 times on average showed very promising forward returns. On average, the index was higher as follows:
- 1 Day Later +1.6%
- 1 Month Later +3.5%
- 3 Months Later +4.2%
- 6 Months Later +3.8%
- 9 Months Later +7.5%
- 12 Months Later +9.5%
- 24 Months Later +12.3%
It is important to note that as seen below, the results are heavily skewed for the tech bubble burst, 9/11, and the Great Financial Crisis. All the same, the average results were positive in all time frames:
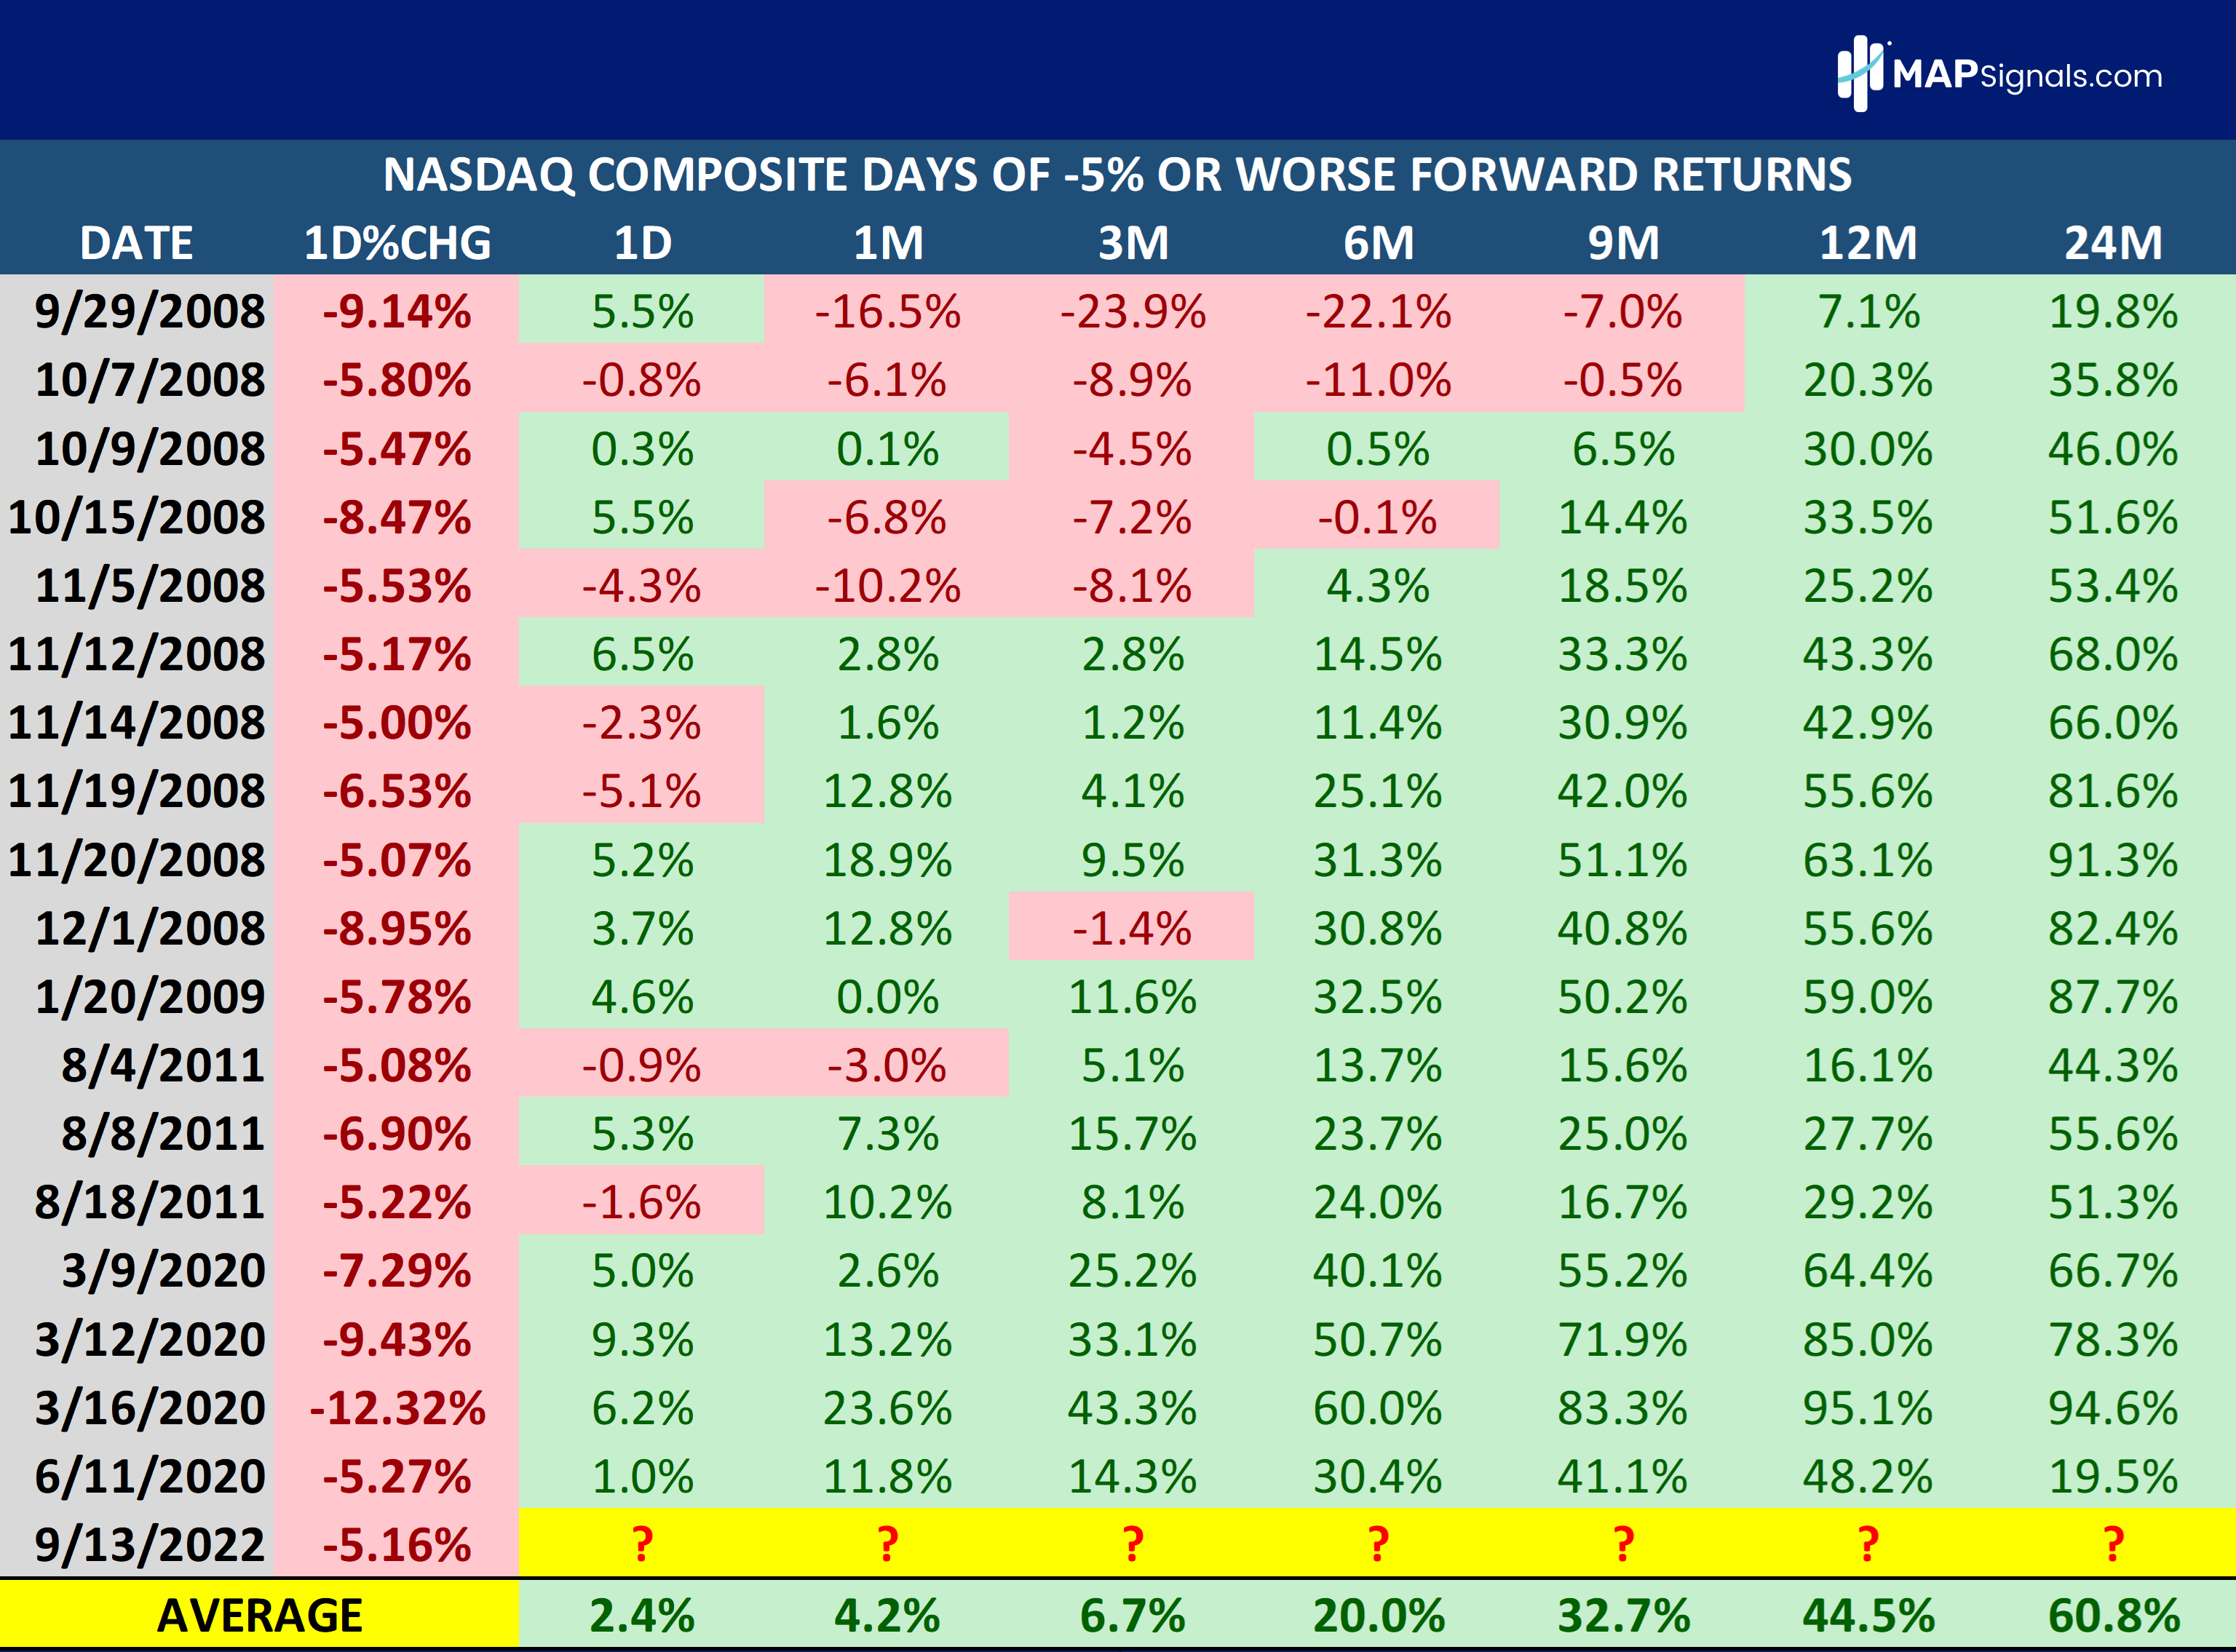
On that note, as an exercise, we can see how stunning forward returns are when we begin from 2005, which includes the Great Financial Crisis:
Naturally time will tell, but if history is any guide, now is not the time to panic.
Have a great evening!
JB