Winner Take All
I told my wife I’d be home by 10. Famous last words…
By 11:30 she called to find out where I was. I was playing in a local poker tournament- winner take all. If I quit early, I was heading home empty handed.
In the end, she was happy.
I casually sat back and watched players dropout. My stack kept growing at the expense of others. They had to fall in order for me to rise. Their chips had to flow somewhere. Winner take all is a zero-sum game.
They flowed to me. I came home 2 hours late but flush with cash…
Big Money flows into stocks the same way sometimes. A select few keep crushin’ it, while the others are left behind. Outlier stocks are the winners. “They all go up.”
This reminds me of my mom when she said: “many are called, but few are chosen.” Many stocks rise, but only a few are outliers.

Big Money Index Keeps Falling
Markets have been sloshing around for a month. At Mapsignals, we expected the data to change. And it has: The Big Money Index keeps falling.
This happens when there are less and less stocks racing higher on big money volumes. It fits the narrative of our prior post, the market master of misdirection. Stocks float along while big money exits stage left unseen.
Below is the BMI. It tracks big money going in and out of stocks. If the line is going up, money is pouring in. If it’s going down, breadth is weakening.
As you can see, the downtrend is here:
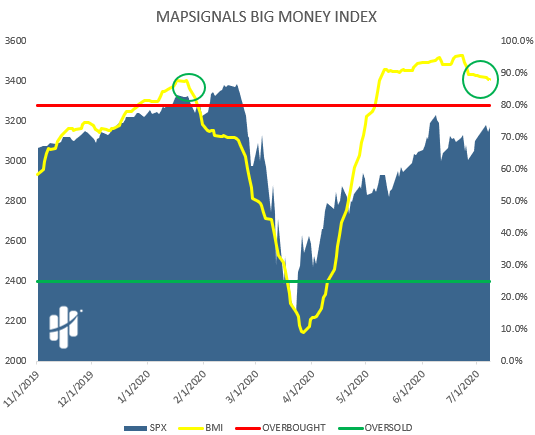
The BMI has been falling for over 2 weeks
Let’s keep diving deeper…
Sector Buying Is Evaporating
Below are 4 Big Money Sector Indexes. They track the velocity of buying on a moving average. If the green line is going up, the number of stocks seeing big money is increasing. If the line is dropping, fewer stocks are seeing big buying.
Nearly all sectors show the same pattern. Here are Industrials, Healthcare, Technology, & Discretionary (click the images to expand):
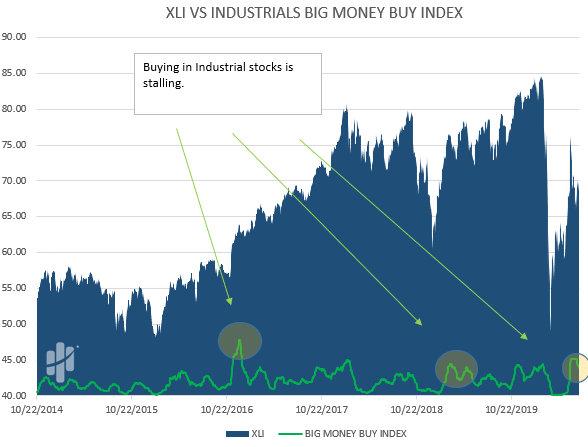
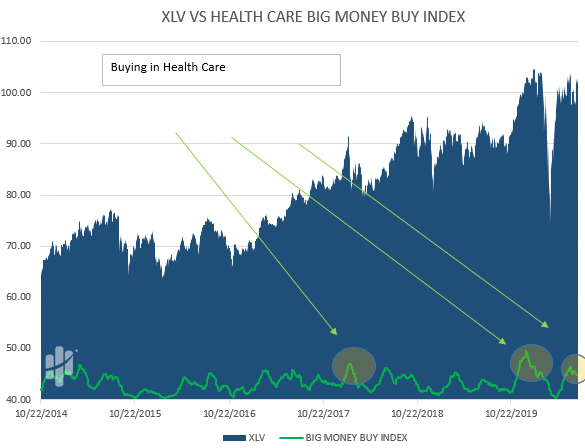

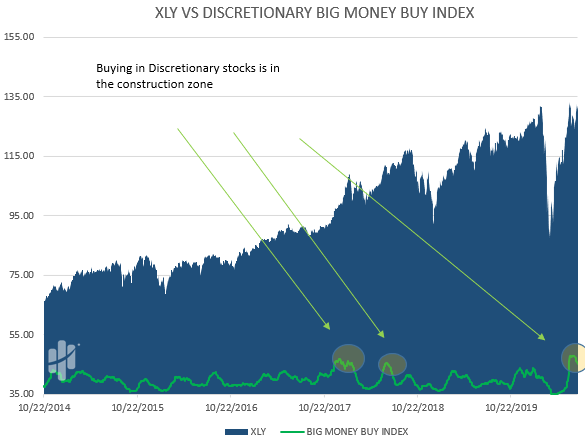
While the total number of stocks getting big money is falling – only a select few are winning the hands. They are taking all of the chips.
Let’s see who’s left at the table.
Technology Stocks Winner Take All
Technology is the runaway player racking up nearly all the chips. That’s obvious when looking at the NASDAQ 100.
Here’s the 1-month performance of the major indices. Look who’s in the lead:
- NASDAQ 100 ETF (QQQ) +7.04%
- S&P 500 ETF (SPY) -1%
- Russell 2000 ETF (IWM) -5.22%
We track Big Money going into all stocks. For months, our stock reports have said to bet on Technology. Here’s last month’s Mapsignals Top 50 report. It takes all of the top 20 reports for 6 months and ranks the most frequent stocks seeing big money.
It’s a winner take all report.
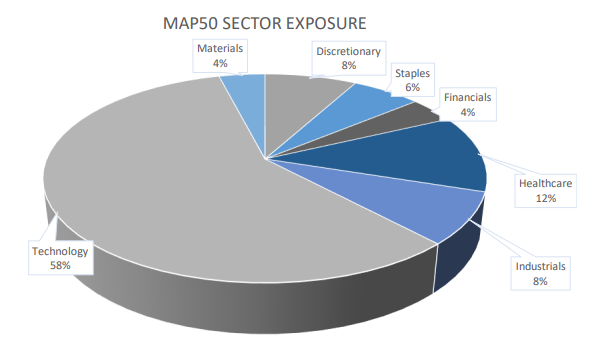
Nearly 6 out of 10 stocks are Technology. Those are the players to bet on.
The April and May MAP 50 reports blew the doors off the S&P 500.
The May Top 50 stocks averaged a gain of +14.2% vs +8.7% for the S&P 500. It was 54% Technology stocks.
The April Top 50 stocks averaged a gain of +9.5% vs +3.21% for the S&P 500. It was 50% Technology.
At Mapsignals, we’ve been holding many stocks on those reports for years. We believe that’s how you get rich…
Know when to hold ‘em.
Bottom line: Big buying is decelerating. A few stocks are grabbing all the chips. We like to bet on the few. We never sell those.
Eventually those outliers will take a breather and we’ll do what we always do. We’ll bet big and buy the few.
The top 20 pro poker players have aggregate earnings of nearly $600 million. They win by calculating odds and exploiting edge. The monster winners aren’t the cowboys splashing chips and making “oohs” and “ahhs.” They quietly flow with the game and adjust their play to win over time.
That’s how Mapsignals does it. Play with odds in our favor – winning over time.
That’s how I did the other night.
That’s how I magically made an annoyed wife a happy one.
But it only cost me all my winnings… ????