
MACRO: Big Momentum is a Buy Signal
Here are a few tidbits about the stock market. The S&P 500 has hit 46 all-time highs this year. It’s up 22% YTD and a whopping 63% since this bull market began two years ago.
Don’t let that juicy performance scare you. Big momentum is a buy signal.
But stocks’ huge gains aren’t keeping bears from calling for a nasty sell-off.
We know it’s hard to tune out the negative noise.
Wall Street’s latest worry list ranges from uncertainty about the pace of Fed easing to the recent back-up in interest rates, election jitters and Middle East geopolitical tensions, to name just a few.
Tune it out. Bull markets are born on despair, mature on skepticism, bloom on optimism, and finally die on euphoria. This time-tested behavioral evolution takes an average of four years to play out, not two.
While we may have finally transitioned from skepticism to cautious optimism, Wall Street’s endless worry list proves euphoria is still a long way off.
Our bullish macro message for investors hasn’t changed. This broadening rally has plenty of upside.
Today we’ll show you why market momentum signals more gains ahead. Then we’ll debunk the bears’ latest two big macro worries and show you three cyclical sectors with the most upside as this bull market keeps charging higher.
Big Momentum is a Buy Signal
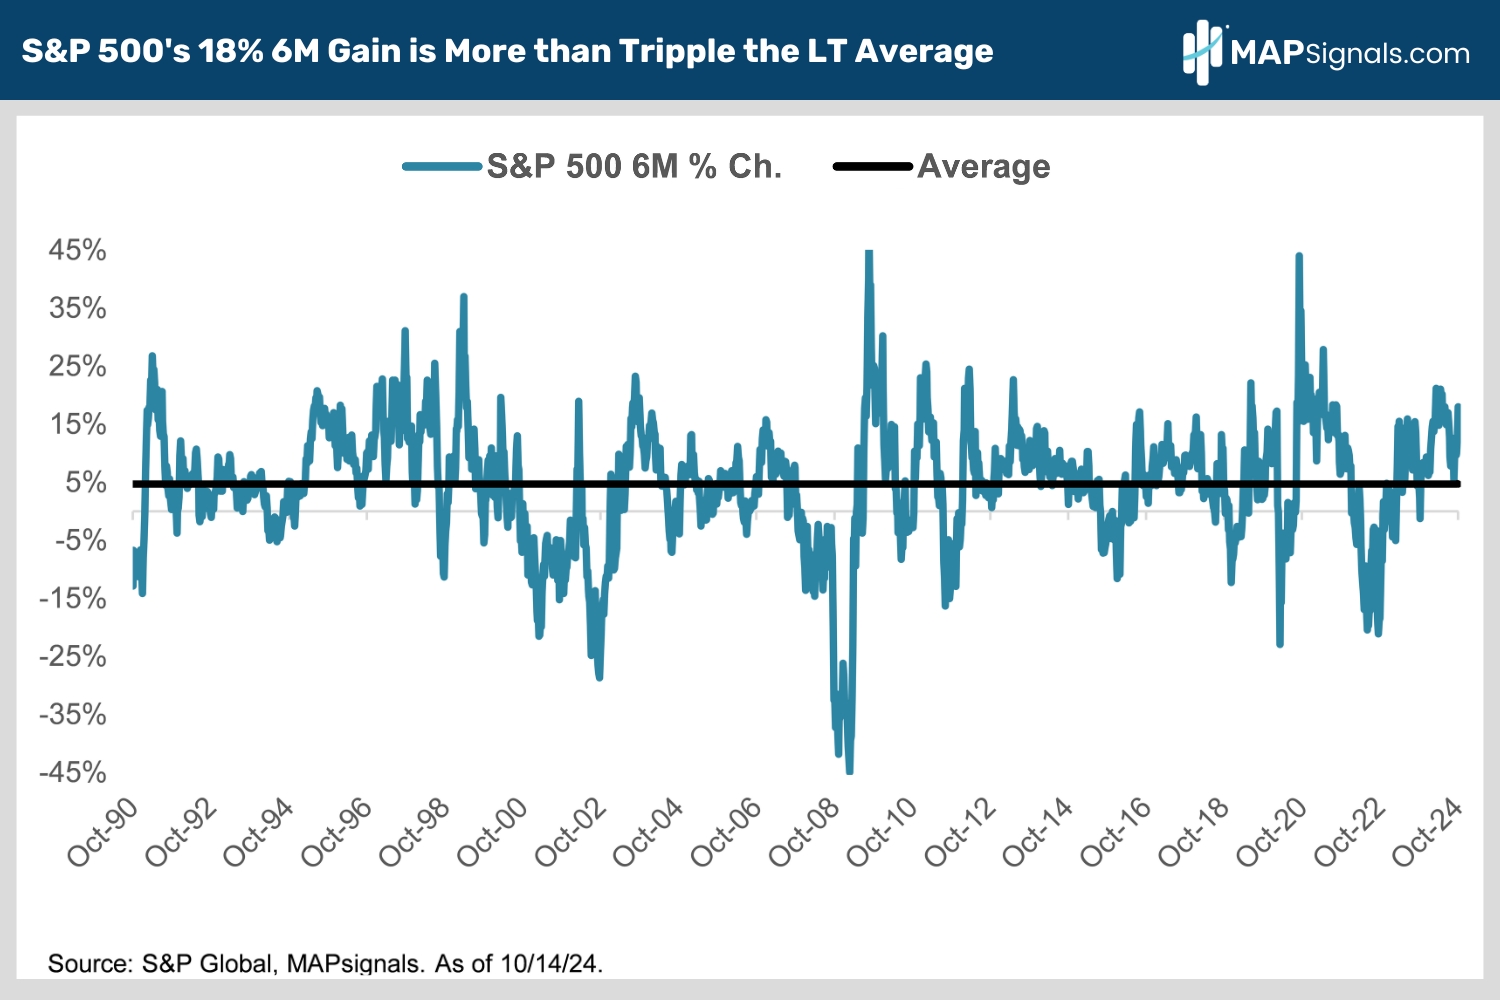
The market’s climb has been awe-inspiring. A quick look at market history shows just how strong it’s been.
Since 1990, the S&P 500’s average six-month gain is 4.7%. That’s less than a third of the 18% Mr. Market has delivered since mid-April!
We know it’s tempting to cash out after such a massive run. Keep reading to find out why that’s a big mistake.
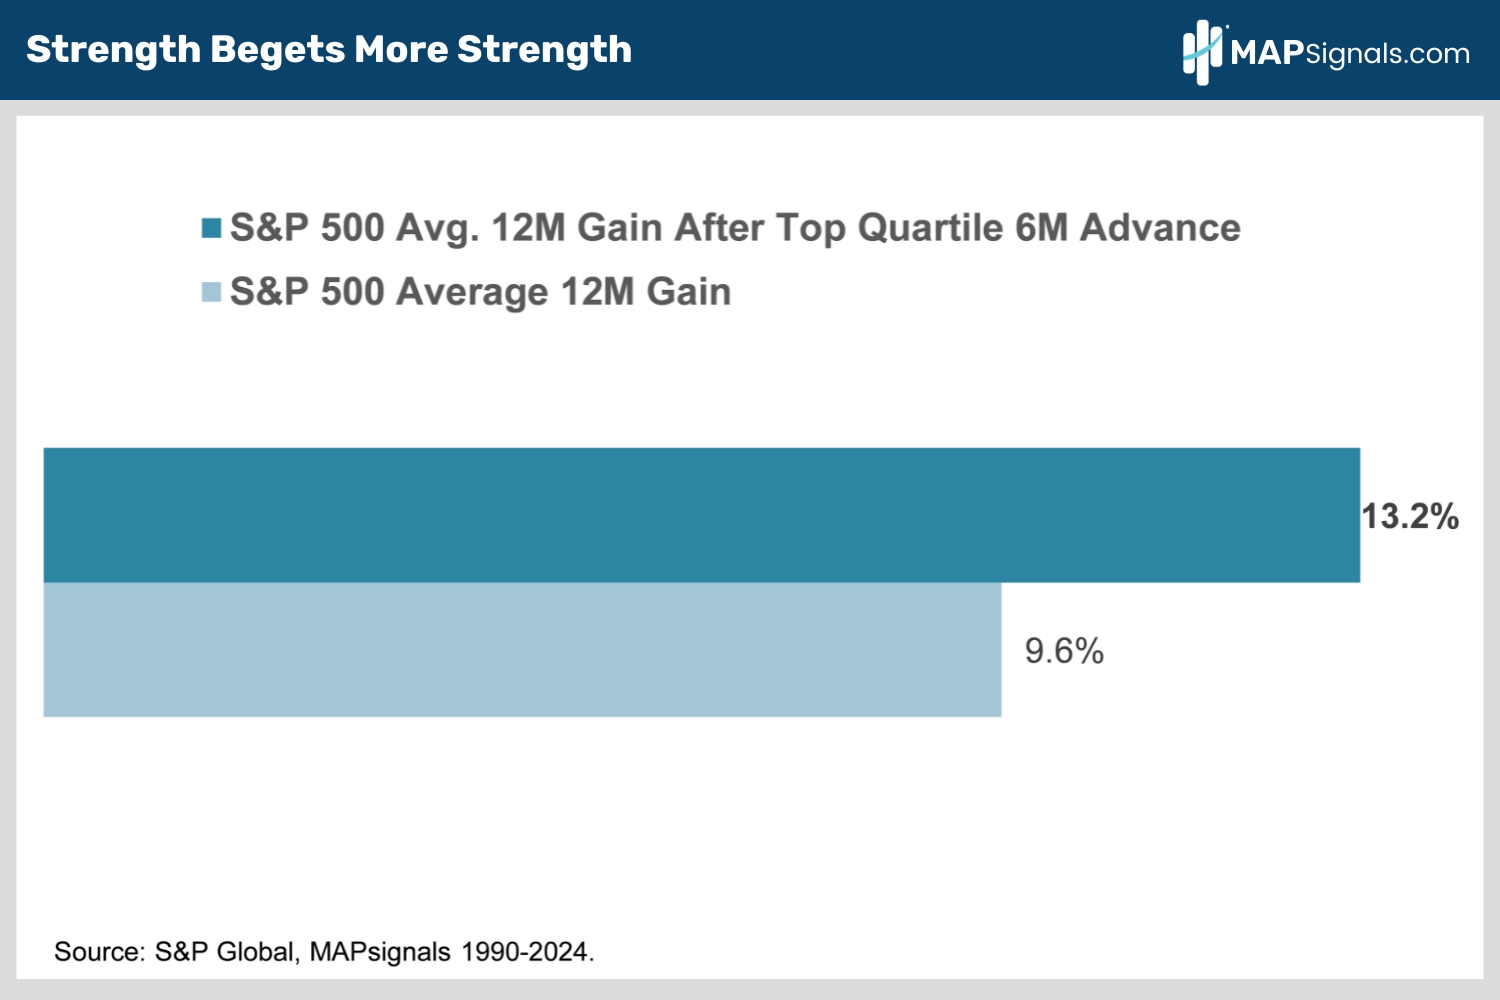
The market’s momentum is undeniably strong. But it turns out that turbo-charged rallies are a reason to buy rather than sell.
Since 1990, the S&P 500 has averaged a 13.2% gain in the 12 months following top-quartile six-month rallies, compared to only a 9.6% gain in an average 12-month period.
Some are calling the latest 6-month rally biblical in nature. If so, the following Wall Street adage reads like a scripture – strength begets strength:
On April 8th, we told you Strong Momentum isn’t a Reason to Sell Stocks. The S&P 500 is up 18% since.
Back then, our high conviction was largely based on stocks’ strong momentum over the prior 6 months.
We’re making the same call today.
But strong momentum isn’t the only reason we think this rally has legs.
Let’s shift gears and debunk two new worries topping bears’ worry list. I’m sure you’re hearing these a lot.
A slower pace of Fed interest rate cuts tops the list.
The bears say to sell stocks because the Fed will only be cutting rates slowly owing to continued economic resilience and a slowdown in inflation’s decline. Forget about any more juicy 50 basis point rate cuts.
Sounds like bad news for stocks, right?
Not so fast. Here’s what the bears miss. When easing has been slow, stocks fly.
Check out the performance of the S&P 500 after the first Fed rate cut dating back to 1954. When the pace of cuts is slow, the index is up 24% on average a year later. That’s 19% more than the S&P’s rallied so far.
Contrast this to fast rate cut cycles when the S&P 500 only gains 5.2% on average a year later, well below the 10% historical average annual gain:
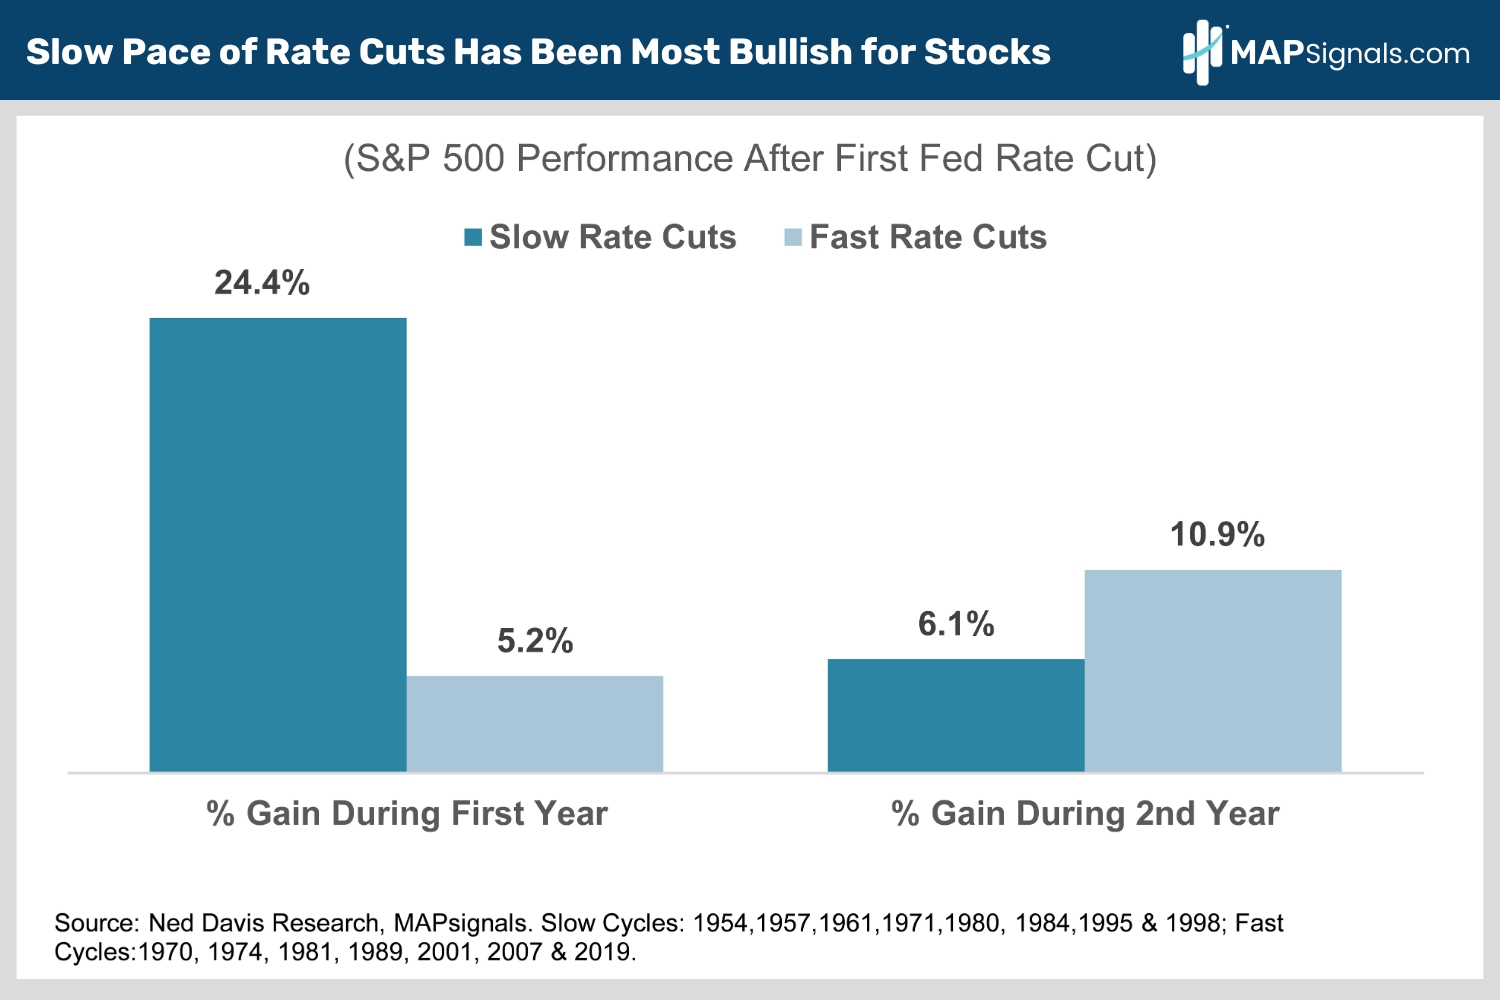
If the Fed is cutting rates quickly, it usually means there’s a crisis afoot (Dot Com Bubble, Great Financial Crisis, Covid 19 etc..) or the economy needs rescuing because it’s already slipped into recession.
That’s not the case today.
The latest Atlanta Fed real-time Q3 GDP growth forecast is 3.4%, and CPI inflation fell to 2.4% in September, the lowest reading since its 9.1% peak back in 2022.
This goldilocks macro picture points to gradual Fed easing, which has been very favorable for stocks.
Let’s pivot and tackle the other big new macro worry – the recent back-up in long term interest rates to 4.1% from September’s 3.6% low.
The bears argue this “higher for longer” macro will short circuit stocks.
First off, why rates are rising matters. Long rates aren’t up because of spiking inflation, they’re up because the economy is stronger than expected. That’s good news for stocks.
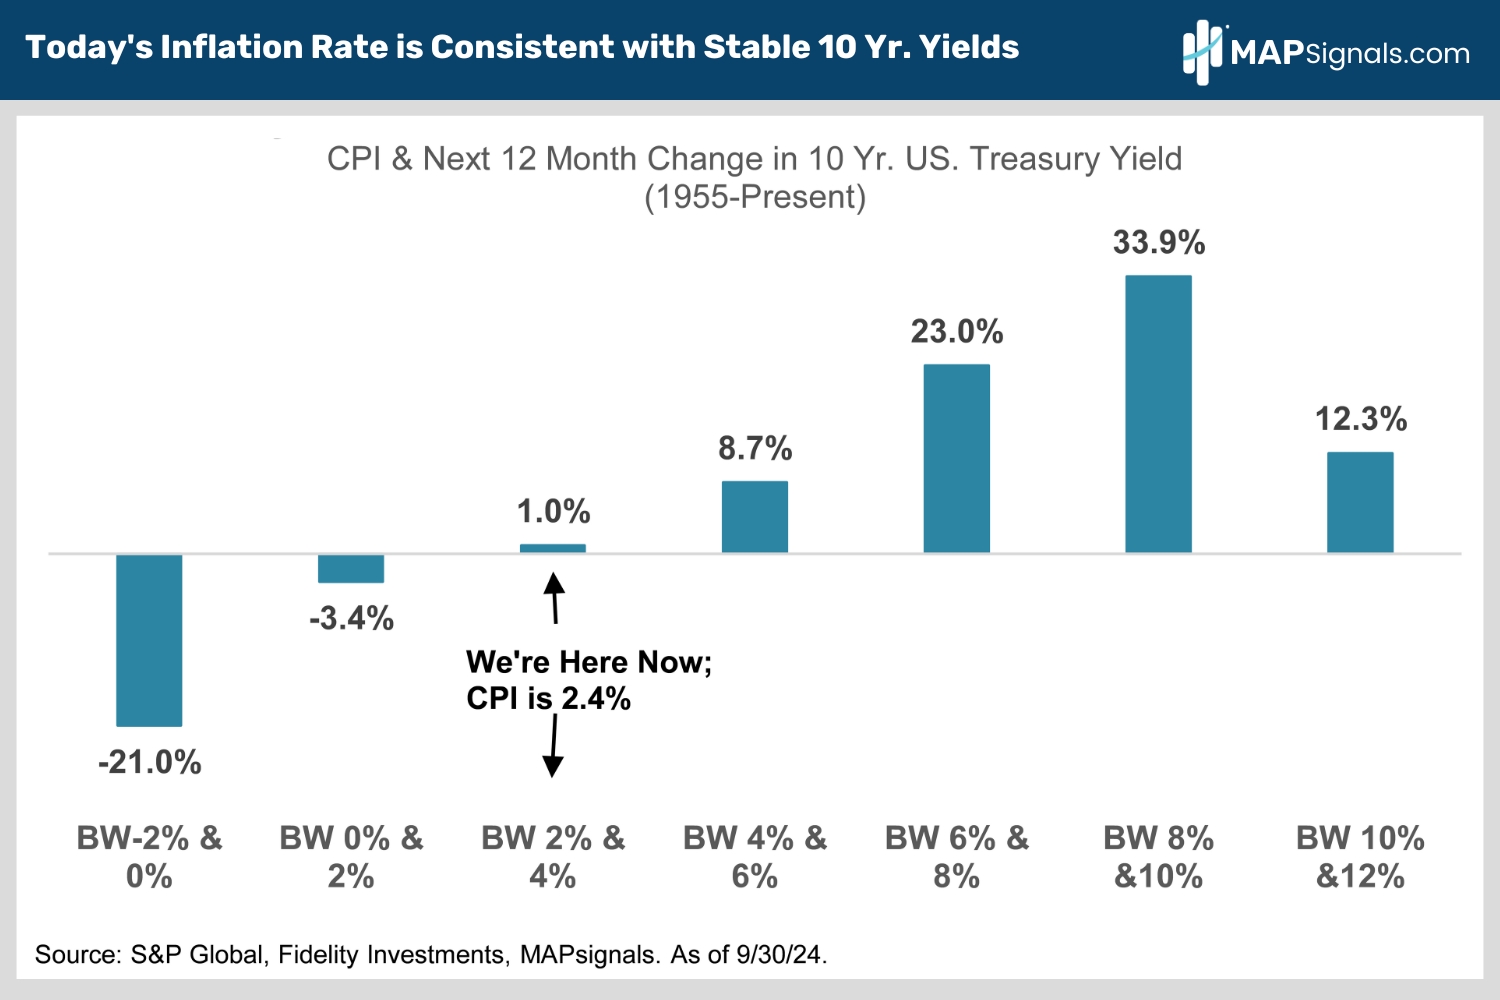
And history says long-term interest rates shouldn’t go much higher. Check this out:
Since 1955, when CPI inflation is 2.4%, 10 Year Treasury yields have been super stable. History says long rates aren’t going much higher with inflation this low:
What This Means for Your Portfolio
In January, we told you Macro Drivers Signal a Broadening Rally in 2024.
Broader market participation has been picking up steam since July. The S&P 500 Equal Weight Index rose 9.1% in Q3, easily beating the S&P 500’s 5.5% advance.
We’re still fans of big tech, but investors need to broaden their tech allocations beyond the Mag 7 to include smaller blue chips as well as mid and small cap tech names too.
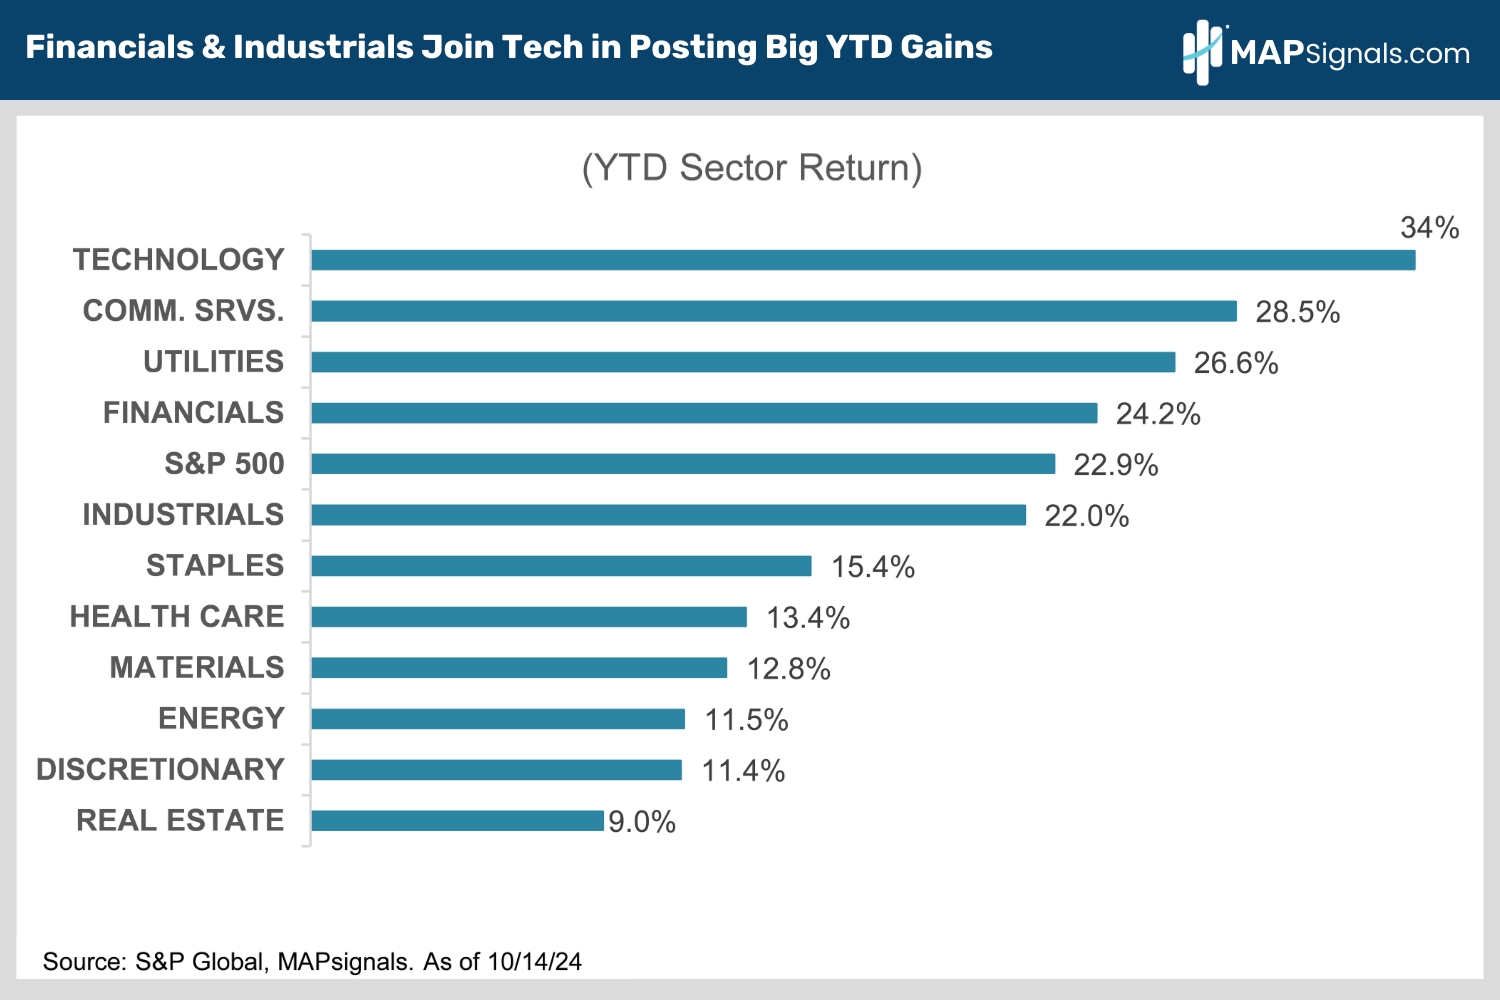
Other cyclical sectors like financials and industrials are also seeing strong institutional inflows as economic resilience forces skeptical fund managers to boost allocations to cyclicals amid a brightening earnings outlook.
Note the YTD leaderboard has broadened out to include other cyclical areas beyond just big tech:
In January, we told you Macro Drivers Signal a Broadening Rally in 2024.
Broader market participation has been picking up steam since July. The S&P 500 Equal Weight Index rose 9.1% in Q3, easily beating the S&P 500’s 5.5% advance.
We’re still fans of big tech, but investors need to broaden their tech allocations beyond the Mag 7 to include smaller blue chips as well as mid and small cap tech names too.
Other cyclical sectors like financials and industrials are also seeing strong institutional inflows as economic resilience forces skeptical fund managers to boost allocations to cyclicals amid a brightening earnings outlook.
Note the YTD leaderboard has broadened out to include other cyclical areas beyond just big tech:
Don’t let a bout of momentum sideline your portfolio. The evidence says to play offense rather than defense after high-momentum periods like we’re seeing now.
Here’s the Bottom Line: Stocks have had an amazing run. But don’t jump off the rally wagon just yet.
Since 1990, the S&P 500 has averaged a 13.2% gain in the 12 months following top-quartile six-month rallies like the S&P’s 18% rip since April.
Don’t be afraid to buy dips.
The economy is doing fine and the Fed will still keep cutting rates. Today’s 4.75% fed funds rate is too restrictive with inflation at just 2.4%.
Don’t sweat the pace of rate cuts.
Since 1954, when the Fed eases slowly, the index is up 24% on average a year later. That’s 19% more than the S&P’s rallied since the Fed’s first rate cut on September 18.
As for the recent rise in long rates, it’s unlikely to derail the equity rally. Since 1955, when CPI is 2.4%, 10- Year Treasury yields have been stable. History says rates aren’t going much higher with inflation this low.
Take advantage of any pre-election volatility to buy cyclical sectors like industrials, tech and financials. Economic resilience is helping them power record S&P 500 earnings.
It’s a safe bet they’ll continue to lead as this bull market charges higher.
If you want to find specific tech, financials, and industrials stocks ramping with Big Money support, get started with a MAPsignals PRO subscription. It’ll get you access to our portal that updates every morning, showcasing the exact tickers getting bought and their scores.
As we’ve highlighted previously, brand new stocks are leading the next leg higher.
Our prized Top 20 list is full of market-beating equities in these three sectors.
There are plenty of winning stocks to pick up as the market broadens out. If you’re a Registered Investment Advisor (RIA) or a serious investor, use a MAP to find them!
Invest well,
Alec