A Rare Bullish Signal Just Triggered
Stocks have been sold hard in 2022. In fact, we’re witnessing the longest bear market since 2008, at over 9 months.
But in some cases, like this week, selling reaches unsustainable levels, creating big potential upside. A rare bullish signal just triggered.

Investors are dealing with a host of problematic issues: high inflation, rising interest rates, elevated energy prices, and earnings uncertainty. No doubt, the mood is sour. Turn on any news outlet and odds are you’ll feel the negativity.
We even noted the monster moves we’re seeing in the NASDAQ lately. Volatility is high without a doubt.
But there’s a positive silver lining.
You see, stocks move based on supply and demand. When sellers outnumber buyers, prices fall. That’s been the case all year.
And we’ve now reached sell levels that historically point to big upside for stocks. Rarely does selling of this magnitude last. Often, these moments precede a major rally.
A Rare Bullish Signal Just Triggered
Let’s start from the top level then work our way down. The Big Money Index, which measures demand for stocks is flashing oversold.
In fact, this gauge hit oversold for the 4th time in 2022 recently. This is the most oversold instances in a year since 2008:
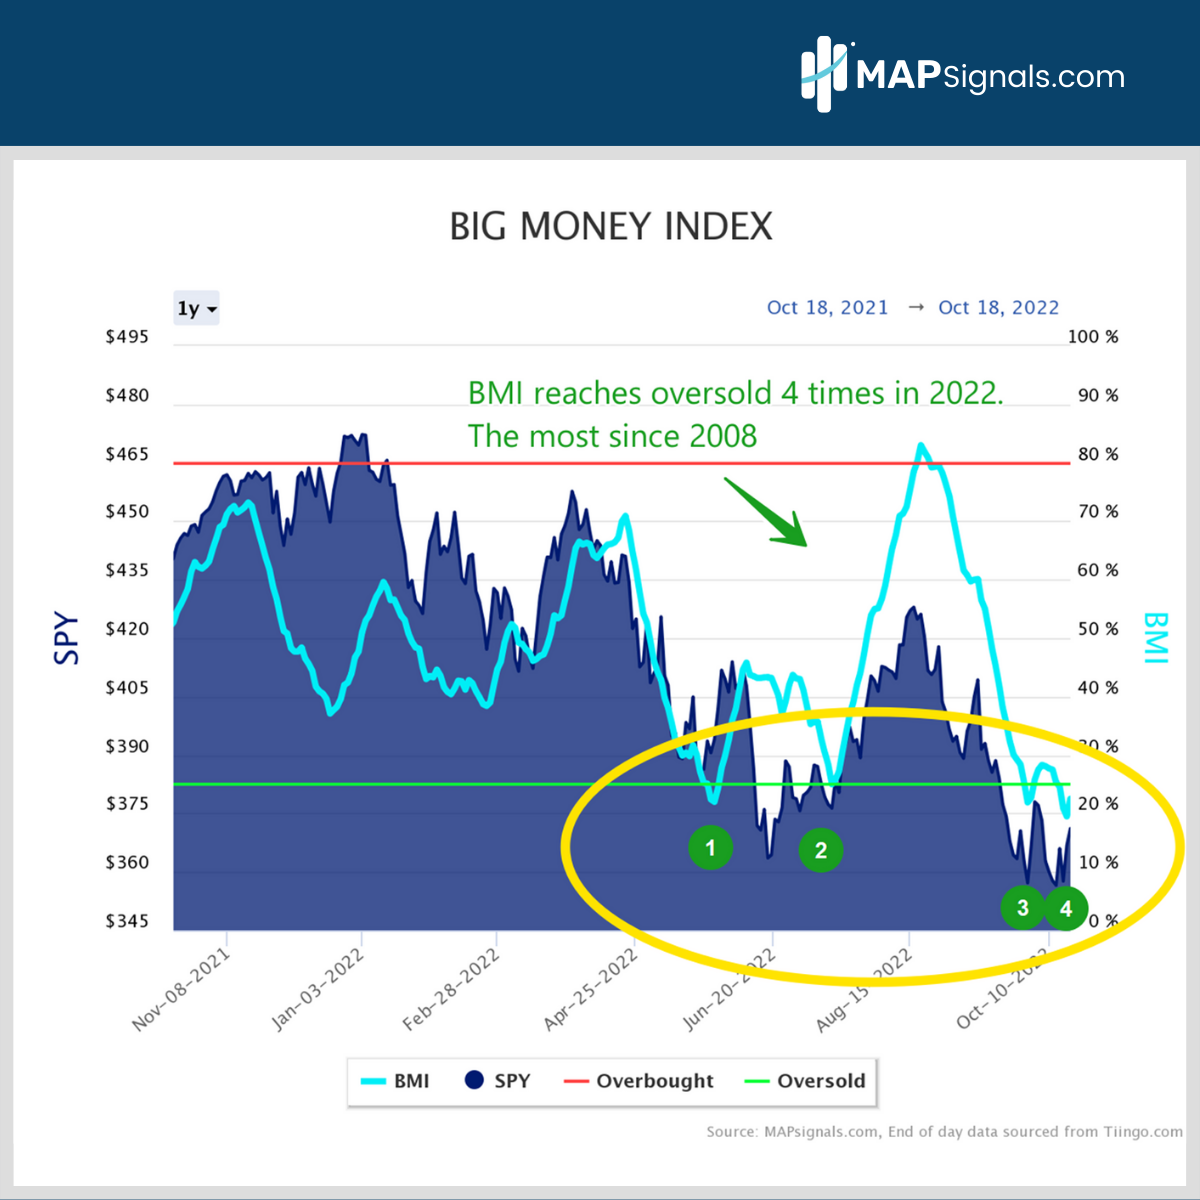
Keep in mind the BMI is constructed on a 25-day moving average of buys and sells. It calculates 25 discrete datapoints and plots the average.
But diving deeper, the latest green zone reading shows the weakest breadth reading all year. In fact, it’s the lowest reading since the 2020 pandemic selloff. Let me show you what I mean.
From September 13th – October 17th, the 5-week total of buy signals numbered only 342. These are stocks powering higher with outsized volumes. Compare this to 3712 sell signals over the same period. That registers a breadth reading of 8.5%. Said another way, 91.5% of our signals were sells.
Have a look:
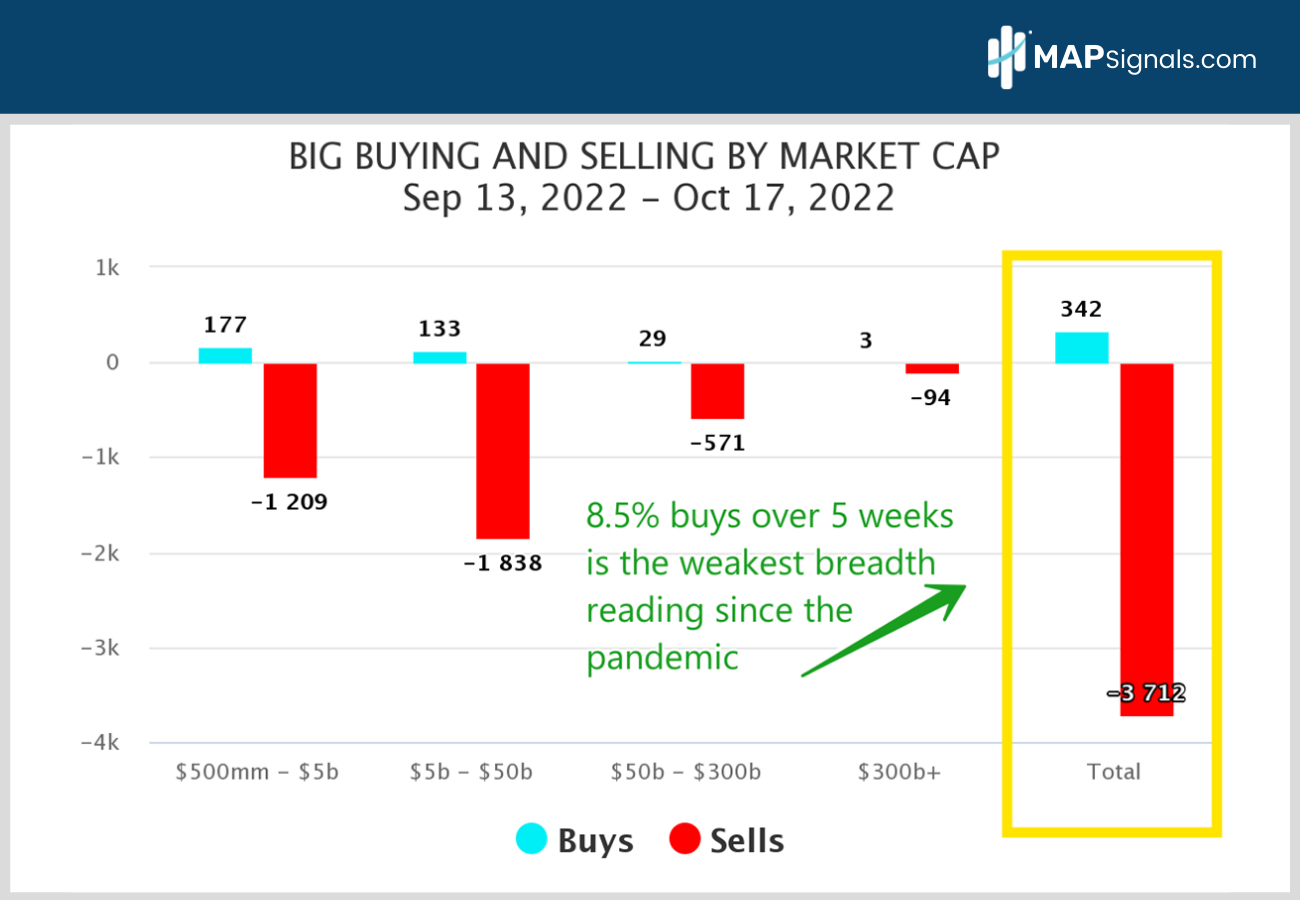
That’s an extremely low reading, indicating capitulation. Those are usually great times to buy stocks, right? YES.
Prior to this week, the last time we saw similar red of this magnitude was in April 2020. And we all know markets roared months later.
Here’s a look at forward S&P 500 returns since 2012 after readings below 8.5%. There’ve been 36 instances the past 10 years:
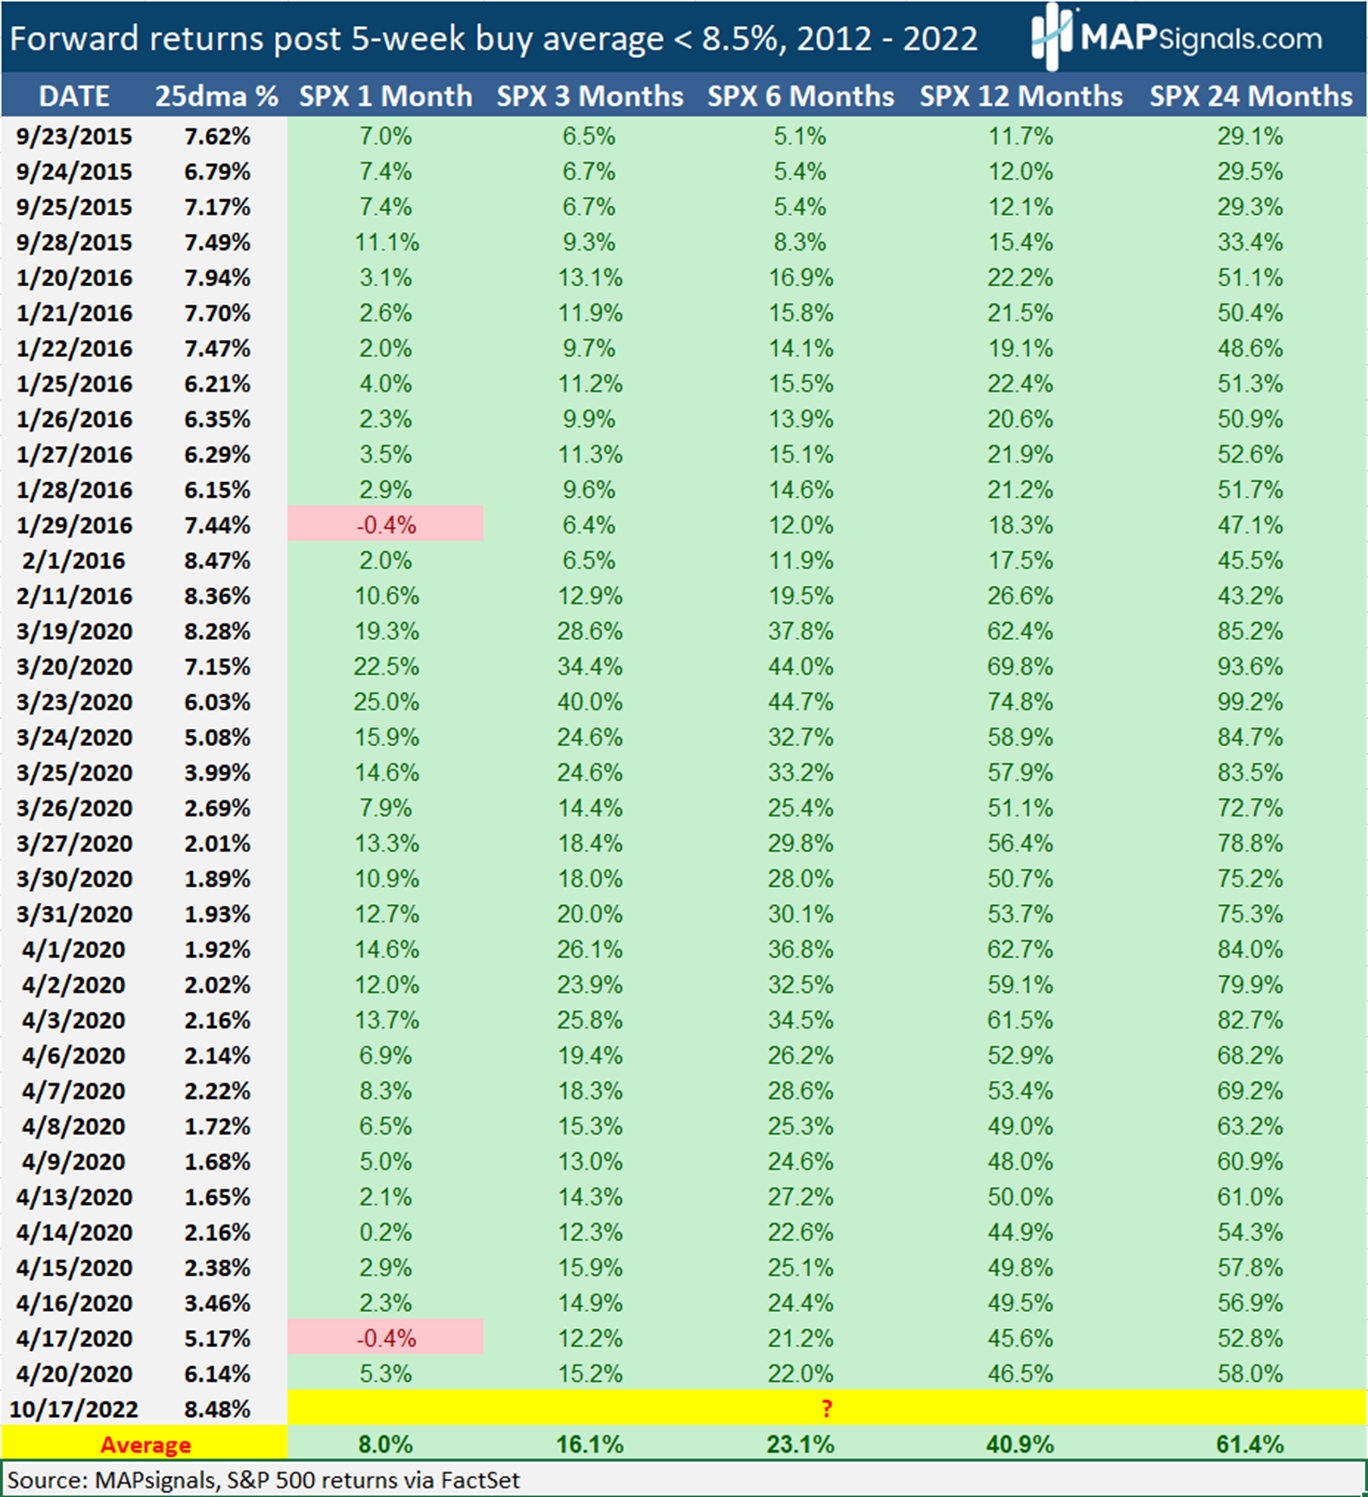
Incredibly, the forward 1-month average return is 8%! The 12-month gain is nearly 41%. Wow. In all instances from 3 months forward, stocks were higher.
But let’s keep going. Let’s do this same exercise going back to 1990. That way we capture the bear markets of 2002 and 2008.
Since 1990, there’ve been 137 instances below 8.5% breadth readings. And the results are incredibly bullish:
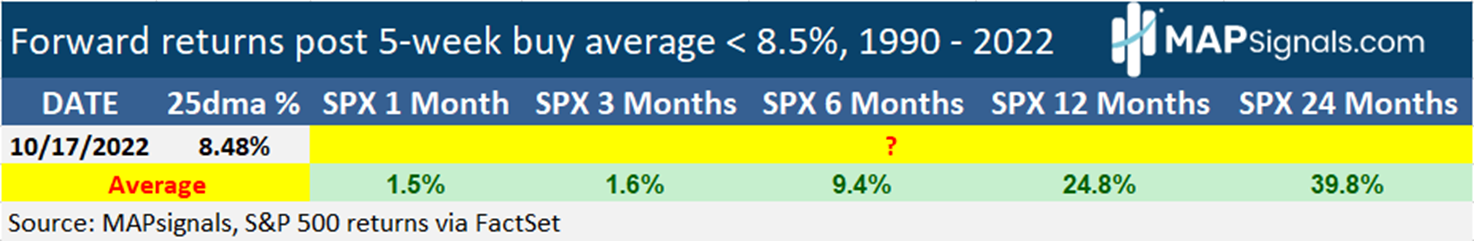
A year after this signal, stocks are up nearly 25% on average. Two years later the average gain is nearly 40%.
And the biggest takeaway of all is this: In all 12-month and 24-month instances going back to 1990, stocks were positive. Yep, this signal currently is batting 1000.
I’ll say it again, a rare bullish signal just triggered!
Let’s wrap up.
Here’s the bottom line: Stocks are oversold. And this week triggered the lowest breadth reading since the pandemic. In fact, this weak breadth reading has only happened 137 times since 1990. It’s rare!
History says stocks will be higher on average months from now… and odds are a lot higher based on the data.
There’s no doubt markets are in challenging times right now. It’s going to take a big shift in the macro landscape to trigger a bullish catalyst. It’ll come eventually, that’s for sure.
This level of selling spells big opportunity.
The MAPsignals data-driven approach is a great tool to enhance your portfolio, no matter what level of investor you are. Follow the Big Money with us and become a better informed investor.
Have a great week!