• Menu
  • Skip to right header navigation
  • Skip to main content
  • Skip to primary sidebar
  • Skip to footer

MAPsignals

We map big money.

  • Latest Insights
  • Power of MAP
    • MAP Products
    • MAP System
    • MAP White Papers
    • Videos & Interviews
  • Profit with MAP
  • About
    • About MAP
    • MAP Team
    • Authors
    • MAP System
    • MAP Products
    • Big Money Index
  • Members
    • Get Started With MAP
    • My MAP
    • Big Money Charts
    • MAP View
    • MAP View Options
    • MAP Top 20 Weekly
    • MAP 50
    • Member Updates
    • Platinum Updates
    • Members Only Posts
    • Performance
  • Portal

A Rare Buy Signal is Approaching

May 12, 2022 //  by Lucas Downey//  2 Comments

Fear is high. De-risking is at levels not seen since March 2020.

That’s the bad news. The good news is where I’m going to focus today. When selling is this intense, a rare buy signal is approaching.

A Rare Buy Signal is Approaching

Look, the past month has been brutal for stocks. Since March 29th, the S&P 500 (SPY ETF) is down 13.53% and the NASDAQ 100 (QQQ ETF) fared worse, falling 18.97%.

Action like this is nauseating to sit through. When the crowd sells stocks in mass, it gets downright ugly. That’s where we are now. But on the flip side, that’s also when opportunity arrives in a big way.

Market bottoms aren’t made when buyers are rejoicing in the streets. Lows are hit when everyone throws in the towel. They give up.

Now, I can’t tell you exactly when this selloff will end. But what I can say is this – a rare buy signal is approaching.

Today we’ll size up the Big Money picture and compare it to recent periods with similar action. From a data standpoint, selloffs have a lot in common. And big drawdowns often precede massive rallies. So, hang in there.

Let’s dive into some data.

Big Money Index is Almost Oversold

The last few weeks have seen relentless selling. When buyers disappear, our Big Money Index falls in a straight line. This is a huge change from the rotational action we watched for nearly a year. In fact, the BMI sits at a level not seen since April 2020.

As the index falls, sellers are in control. When it approaches oversold, correlation is high. That means all stocks feel the heat.

That’s been the case for the past 3 weeks. Below you’ll see how the BMI (blue line) is at levels not seen since the pandemic lows:

Lowest level since April 2020 | Big Money Index

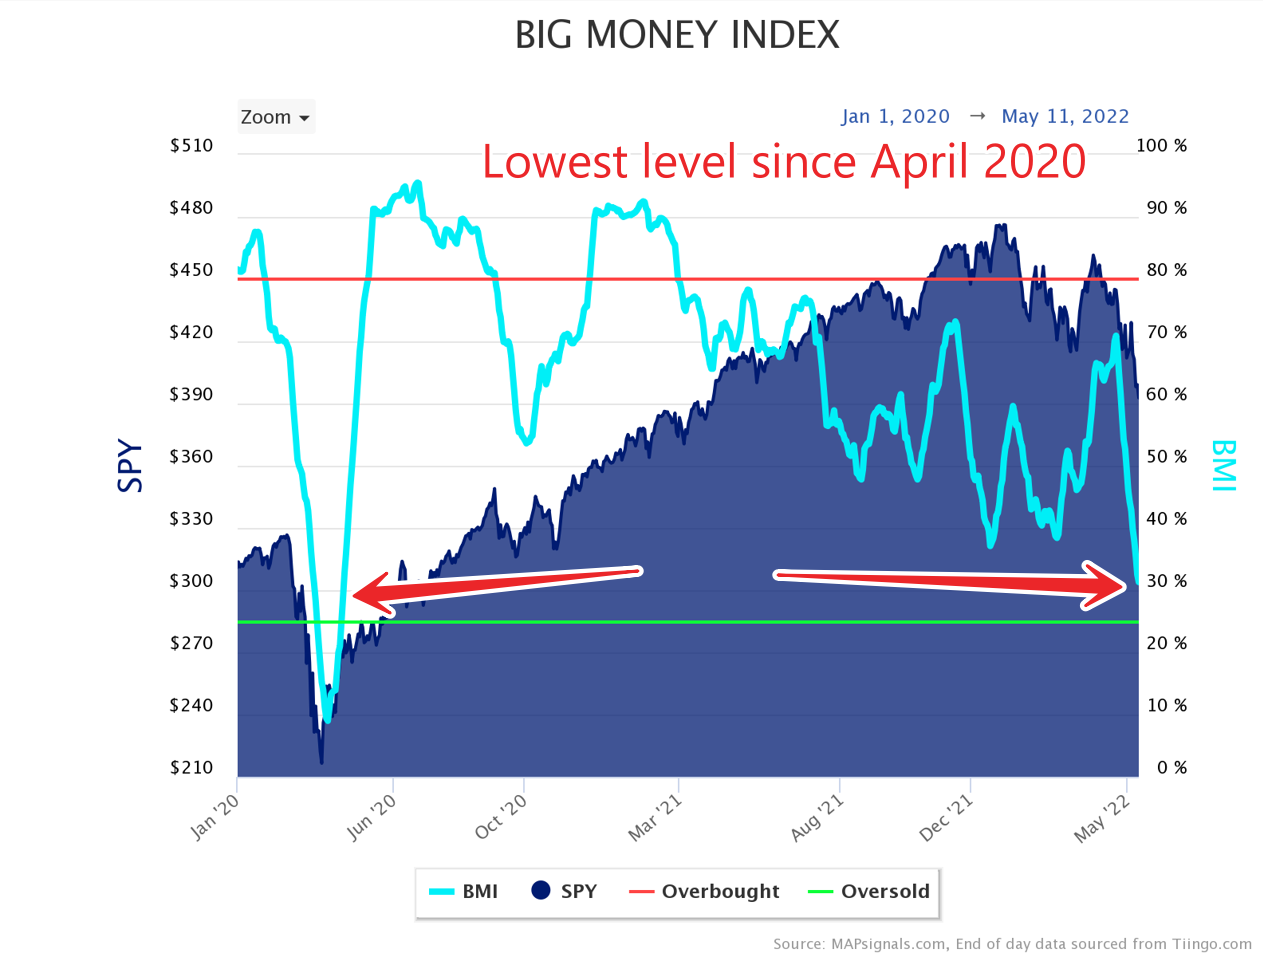
Currently the reading is 32%, meaning the ratio of buys to sells is 68% in favor of sellers. That’s heavy selling. As a reminder, a 25% reading is when we hit a true oversold measure. Chances are we’ll see it in the coming week or so.

But it’s important to put major selloffs, like now, into context. Often, investors see huge pullbacks and think we’re covering “new” territory, but in reality, we’ve had plenty of similar-style repricings in the past.

To show you what I mean, let’s look under the hood at the daily buys and sells of stocks. These are the signals that drive the BMI.

There are a couple things to point out. First, buyers have dried up dramatically. And 2nd, Monday’s pullback saw the single biggest day of stock selling in 2022:

Big Money stock buys and sells | Lack of buyers

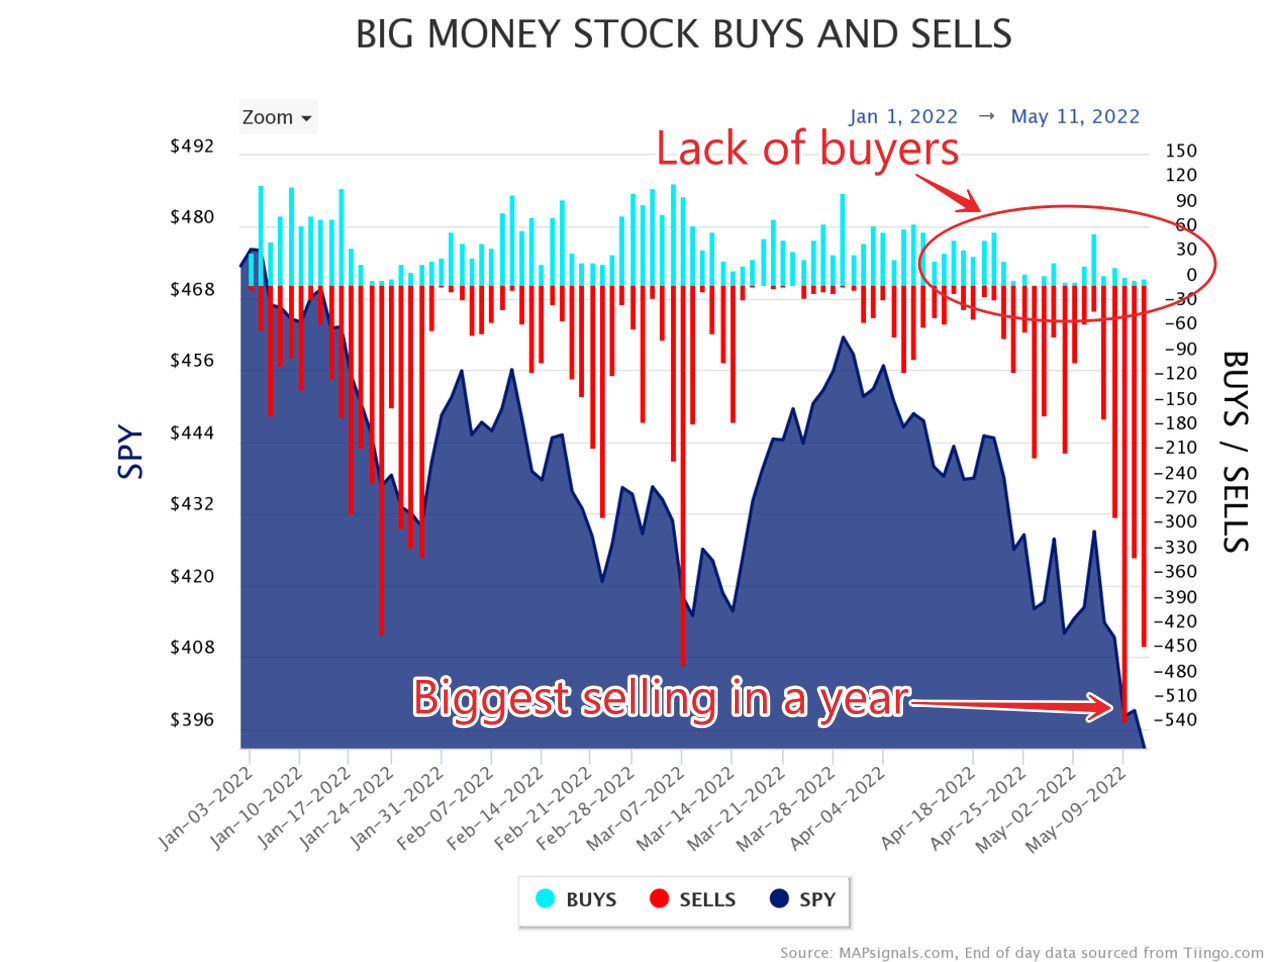
In fact, 530 stocks were sold. We’d have to go back to March 2020 to see worse action. But get this, in nearly all oversold periods, it took this kind of onslaught to reach oversold. So for comparison, we’ll check out a handful of oversold instances.

Below are snapshots of the last 6 oversold periods. I want you to notice a few things:

  • Massive selling often marks a bottom
  • Arrows point to the day the BMI went oversold
  • Usually, stocks rip higher once oversold

Up first is the March 2020 pandemic. I recall it vividly. When oversold triggered, we sent out our buy notice in a post titled, Send the Marines. Notice how selling dried up shortly after oversold was reached:

Big Money stock buys and sells | MARCH 2020

Those big red bars are hundreds of stocks getting sold into oblivion…just like what’s going on now.

The next 2 oversold periods hit in late 2018. October saw stocks stage a relief rally after reaching the green zone. December reached oversold and then markets zoomed:

Big Money stock buys and sells | October & December 2018

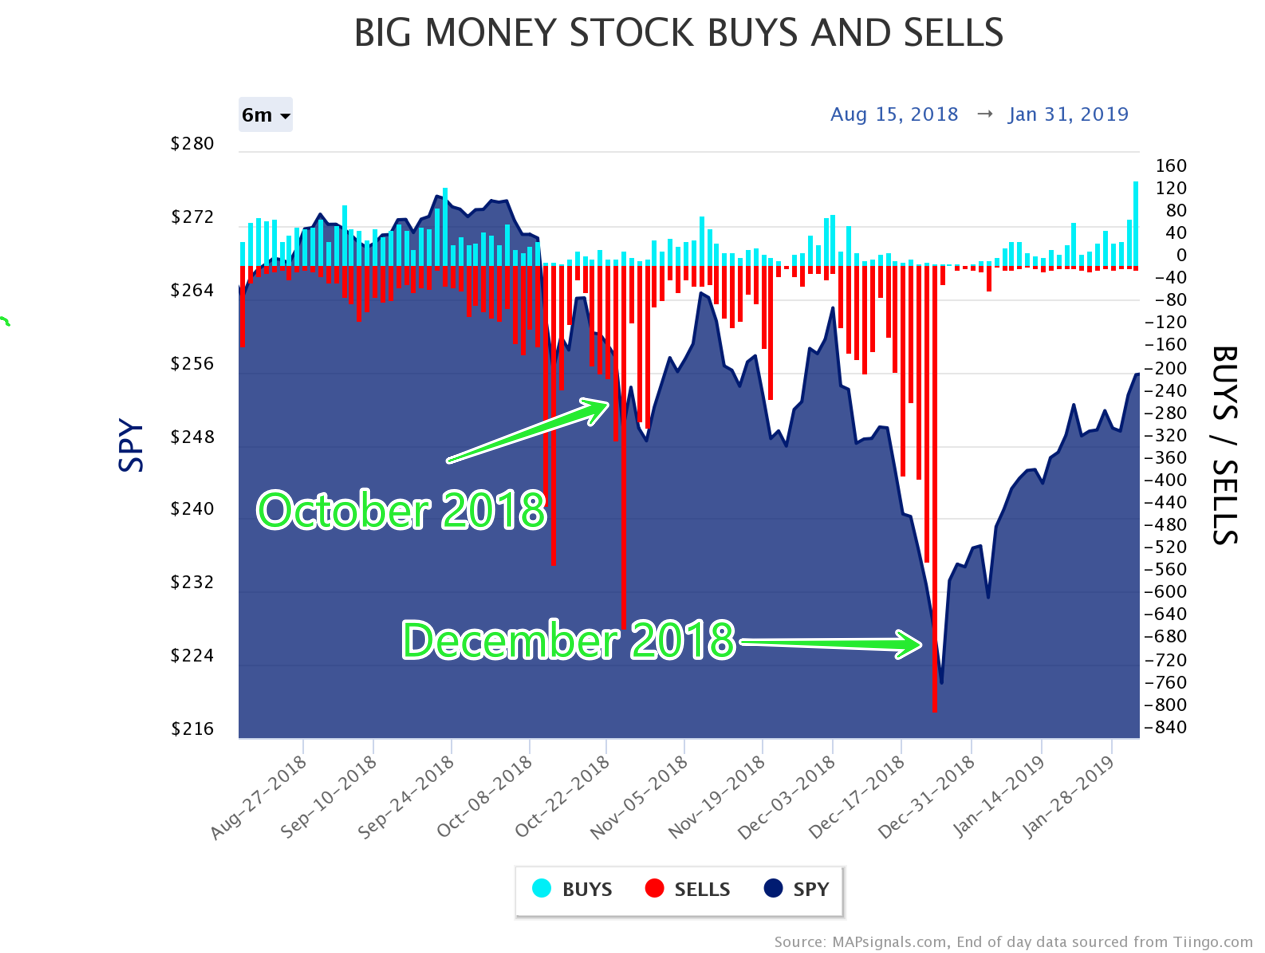
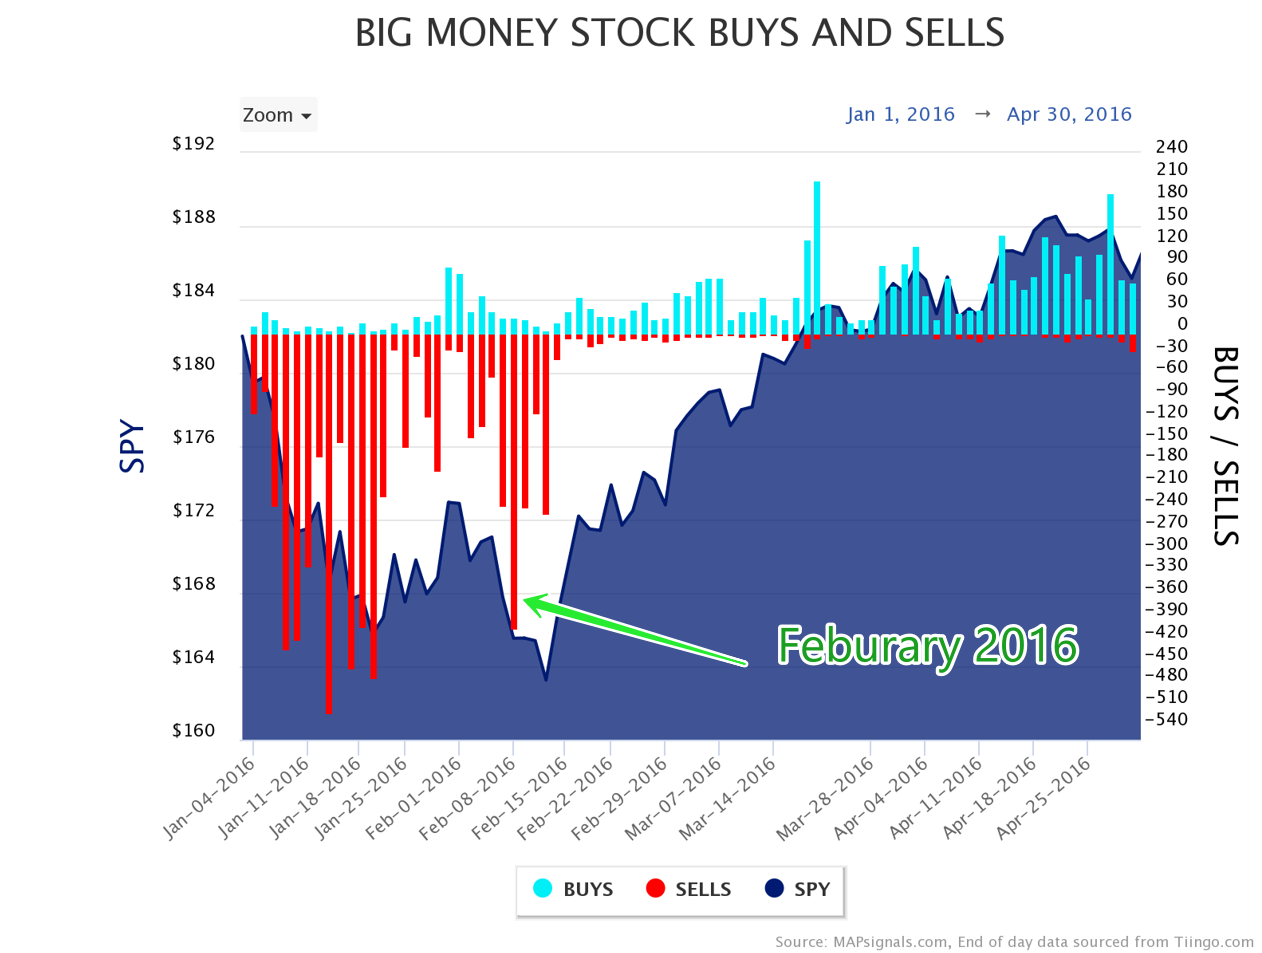
Like today’s data, the troughs tend to be once the BMI falls below 25%. Next is February 2016. The same pattern emerges. Huge selling gets us oversold, then markets rip:

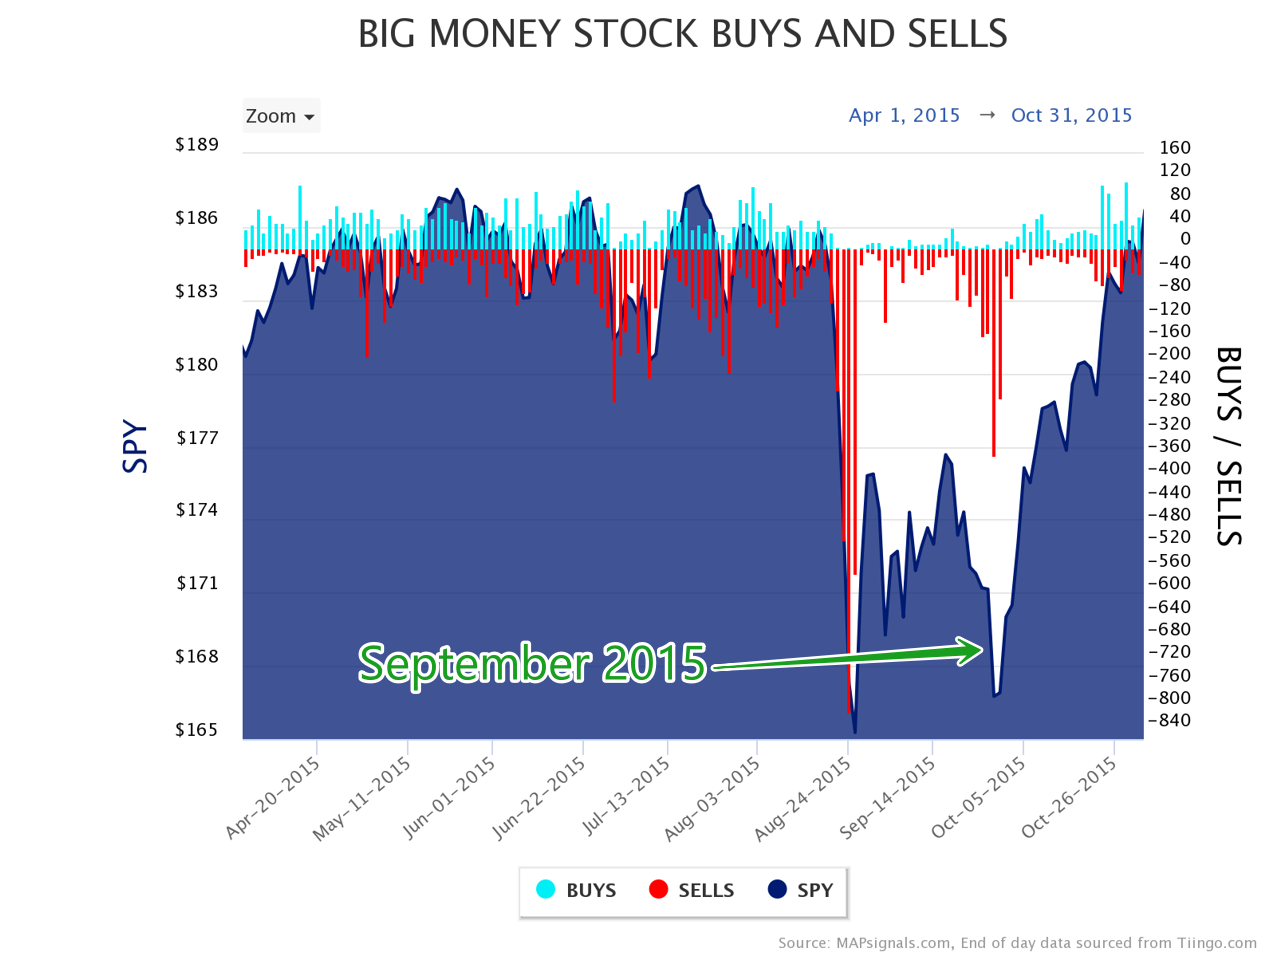
Now see September 2015:

Big Money stock buys and sells | September 2015

Finally, notice how October 2014 has a similar feel too:

Big Money stock buys and sells | October 2014

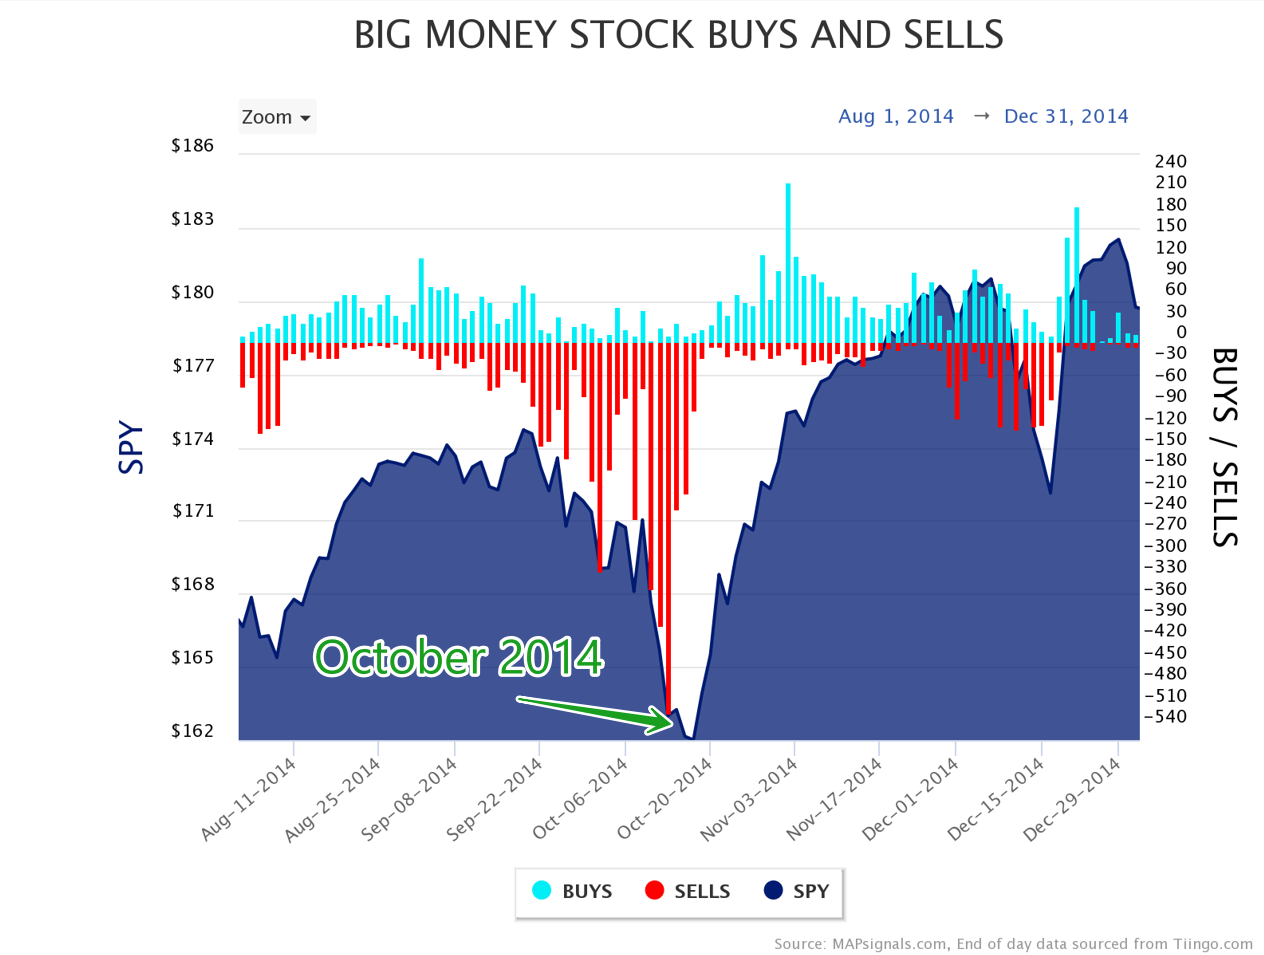
Each of these wipeouts, show a recurring playbook. First, selling reaches unsustainable levels, then it eventually exhausts itself, which leads to eventual buyers.

And it’s why when the BMI dips too far, it’s a flashing opportunity. That’s why it’s paramount to set aside emotions when markets are in panic mode. Based on history, a rare buy signal is approaching.

A Rare Buy Signal is Approaching

Let’s now go back further. Since 1990, we’ve had only 20 instances where stocks were oversold. They’re scarce. Based on 30+ years of data, only 5% of trading days are in the green zone.

These 5% moments are tail events. They’re opportunity.

To finally drive home the point, below are all 20 prior oversold periods. You’ll see the date we went oversold and the forward returns for the S&P 500. On average, stocks are massively green months and years later:

Days Oversold during Recessions

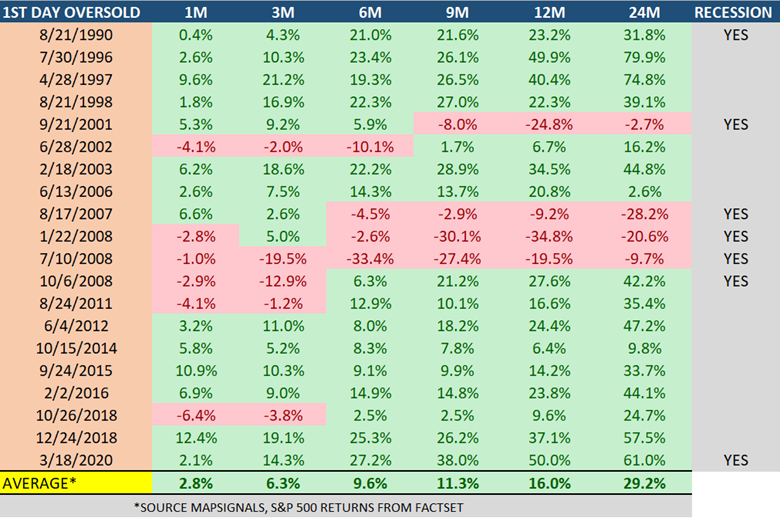
If you’re like me and you want a positive message in stock land, here it is. The window of opportunity usually comes along when fear is abundant. After the BMI dips below 25%, the average 2-year performance for the market is nearly a 30% gain.

Look, no one has a crystal ball. No one knows when this meltdown will stop. But, it’s hard to argue with stats like that. When the investing world is turned upside down, I look to data for answers.

Let’s wrap up.

Here’s the bottom line: A rare buy signal is approaching. We’re likely days away from an oversold Big Money Index.

Monster pullbacks in our data look and feel similar: selling reaches a climax and eventually exhausts itself, paving the way for greener pastures.

Opportunity is coming.

***And if you want to follow our BMI daily and other cool data-driven insights, get started with any level of MAPsignals subscription here. Let data improve your investing process.


Lucas Downey
Lucas Downey

Lucas is co-founder of MAPsignals. His full bio can be found here.
Prior to MAP, he was Head of ETF Sales at Cantor Fitzgerald & SVP of Derivatives at Jefferies, LLC.

Spread the word!

Category: All, Big Money Insights Weekly

Previous Post: «Market Volatility Update Market Volatility Update
Next Post: Market Volatility Update 5-15-2022 Market Volatility Update»

Reader Interactions

Comments

  1. Jonathan

    May 12, 2022 at 10:25 am

    Always appreciate your blog posts, thank you! Have been a follower ever since you used actual data to clearly predict the dip in March 2020. The only data I question a bit is that if we are going into a recession, although it’s only a few data points it seems less predictive of future potential of upside? Recessions fairly consistently had lower returns / greater risk.

    Reply
    • MAPsignals Staff

      May 12, 2022 at 10:53 am

      Jonathan – thanks for the awesome thoughts. When we practically nailed the COVID low it was something for sure!

      You know I wonder about recession possibility too. But the truth is there’s no real way to know if we’ll actual have one and what it’ll look like. High inflation and rising interest rates is a situation we haven’t dealt with for many years. If inflation peaks or shows a softening, stocks could rally at least in the short-term. The market really needs a catalyst to rerate higher. It’ll come eventually is my bet.

      With that said, I am of the belief that oversold periods do represent areas to pick up stocks on sale. That doesn’t mean bet the farm. History indicates that this level of selling likely won’t last forever. There’s likely a few diamonds in the rough.

      Reply

Leave a Reply Cancel reply

Your email address will not be published. Required fields are marked *

Primary Sidebar

Get Big Money Insights for FREE

Want to know where the Big Money is headed?

Just enter your email address below. You'll get our FREE NEWSLETTER sent directly to your inbox.

We call it Big Money Insights... It’s your weekly sneak peek at the powerful market-moving forces that are hidden from 99% of investors.

"*" indicates required fields

This field is for validation purposes and should be left unchanged.

Categories

  • All
  • Big Money Insights Weekly
  • Big Money Series
  • Macro Insights
  • MAP In The Media
  • Members Only
  • Performance
  • Podcast
  • Special Reports
  • Stocks
  • Videos & Interviews
  • White Papers

Archives

  • February 2023
  • January 2023
  • December 2022
  • November 2022
  • October 2022
  • September 2022
  • August 2022
  • July 2022
  • June 2022
  • May 2022
  • April 2022
  • March 2022
  • February 2022
  • January 2022
  • December 2021
  • November 2021
  • October 2021
  • September 2021
  • August 2021
  • July 2021
  • June 2021
  • May 2021
  • April 2021
  • March 2021
  • February 2021
  • January 2021
  • December 2020
  • November 2020
  • October 2020
  • September 2020
  • August 2020
  • July 2020
  • June 2020
  • May 2020
  • April 2020
  • March 2020
  • February 2020
  • January 2020
  • December 2019
  • November 2019
  • October 2019
  • September 2019
  • August 2019
  • July 2019
  • June 2019
  • May 2019
  • April 2019
  • March 2019
  • February 2019
  • January 2019
  • December 2018
  • November 2018
  • October 2018
  • September 2018
  • August 2018

Follow us on Twitter

MAPsignals Follow 1,434 1,061

MAPsignals is a data platform that tracks institutional money flows in stocks and ETFs. Sign up for free insights here: https://t.co/SaAVHjKC9J

mapsignals
mapsignals avatar; MAPsignals @mapsignals ·
49m 1621476848990359552

Pendulum has swung

Helene Meisler @hmeisler

Highest volume for the QQQs since 12/13

Reply on Twitter 1621476848990359552 Retweet on Twitter 1621476848990359552 0 Like on Twitter 1621476848990359552 0 Twitter 1621476848990359552
Load More...

Footer

© 2021 Mapsignals.com

  • Home
  • Contact & Disclaimer
  • Privacy Policy
  • Terms & Conditions
  • Opt-out preferences
  • FAQ

Copyright © 2023 · Mai Law Pro on Genesis Framework · WordPress · Log in

✕
What Happened to Risk Assets White Paper is Here

Get your copy here and take a journey through our thoughts on margin and leverage.

Enter your email address below and you'll get our FREE NEWSLETTER sent directly to your inbox. 

 We call it Big Money Insights... It’s your weekly sneak peek at the powerful market-moving forces that are hidden from 99% of investors.

MAPsignals
Manage Cookie Consent
We use cookies to optimize our website and our service.
Functional Always active
The technical storage or access is strictly necessary for the legitimate purpose of enabling the use of a specific service explicitly requested by the subscriber or user, or for the sole purpose of carrying out the transmission of a communication over an electronic communications network.
Preferences
The technical storage or access is necessary for the legitimate purpose of storing preferences that are not requested by the subscriber or user.
Statistics
The technical storage or access that is used exclusively for statistical purposes. The technical storage or access that is used exclusively for anonymous statistical purposes. Without a subpoena, voluntary compliance on the part of your Internet Service Provider, or additional records from a third party, information stored or retrieved for this purpose alone cannot usually be used to identify you.
Marketing
The technical storage or access is required to create user profiles to send advertising, or to track the user on a website or across several websites for similar marketing purposes.
Manage options Manage services Manage vendors Read more about these purposes
View preferences
{title} {title} {title}