
When Buyers Disappear
Investing isn’t easy. And the last year is proof that bull markets can turn bearish fast.
The past week of data has a different tone. Today we’ll cover when buyers disappear.
Markets have been under a lot of stress for months. Fears of earnings slowdowns, raging inflation, higher interest rates, and a Russian war have caused incredible uncertainty. But even with each of those negative headwinds, there’s been plenty of areas thriving.
Heck, last week I pointed out how a few groups were in a bull market. That wasn’t new info. Areas like Healthcare, Energy, Real Estate, and Utilities have been attracting capital for a while. They were the sole reason the Big Money Index wasn’t falling.
But that’s changed recently. Buyers in those areas have practically vanished. Leaders have stopped leading. And when nothing is getting bought, markets can fall hard. Just on Tuesday the S&P 500 (SPY ETF) fell 2.90% and the NASDAQ 100 (QQQ ETF) fared worse with a plunge of 3.77%.
As ugly as those returns are, I find it useful to look at the data head-on. So, today we’ll go through these new datapoints, discuss what they mean, and more importantly what to expect going forward. And you might be happy to know there’s a positive message in all of this.
Let’s get to it.
When Buyers Disappear
When data shifts, take notice. For months we’ve had pockets of leadership. Certain groups were thriving, pushing the Big Money Index to their highest levels since November.
Since Thursday, that narrative changed. Buyers dried up. That’s caused the BMI to nosedive:
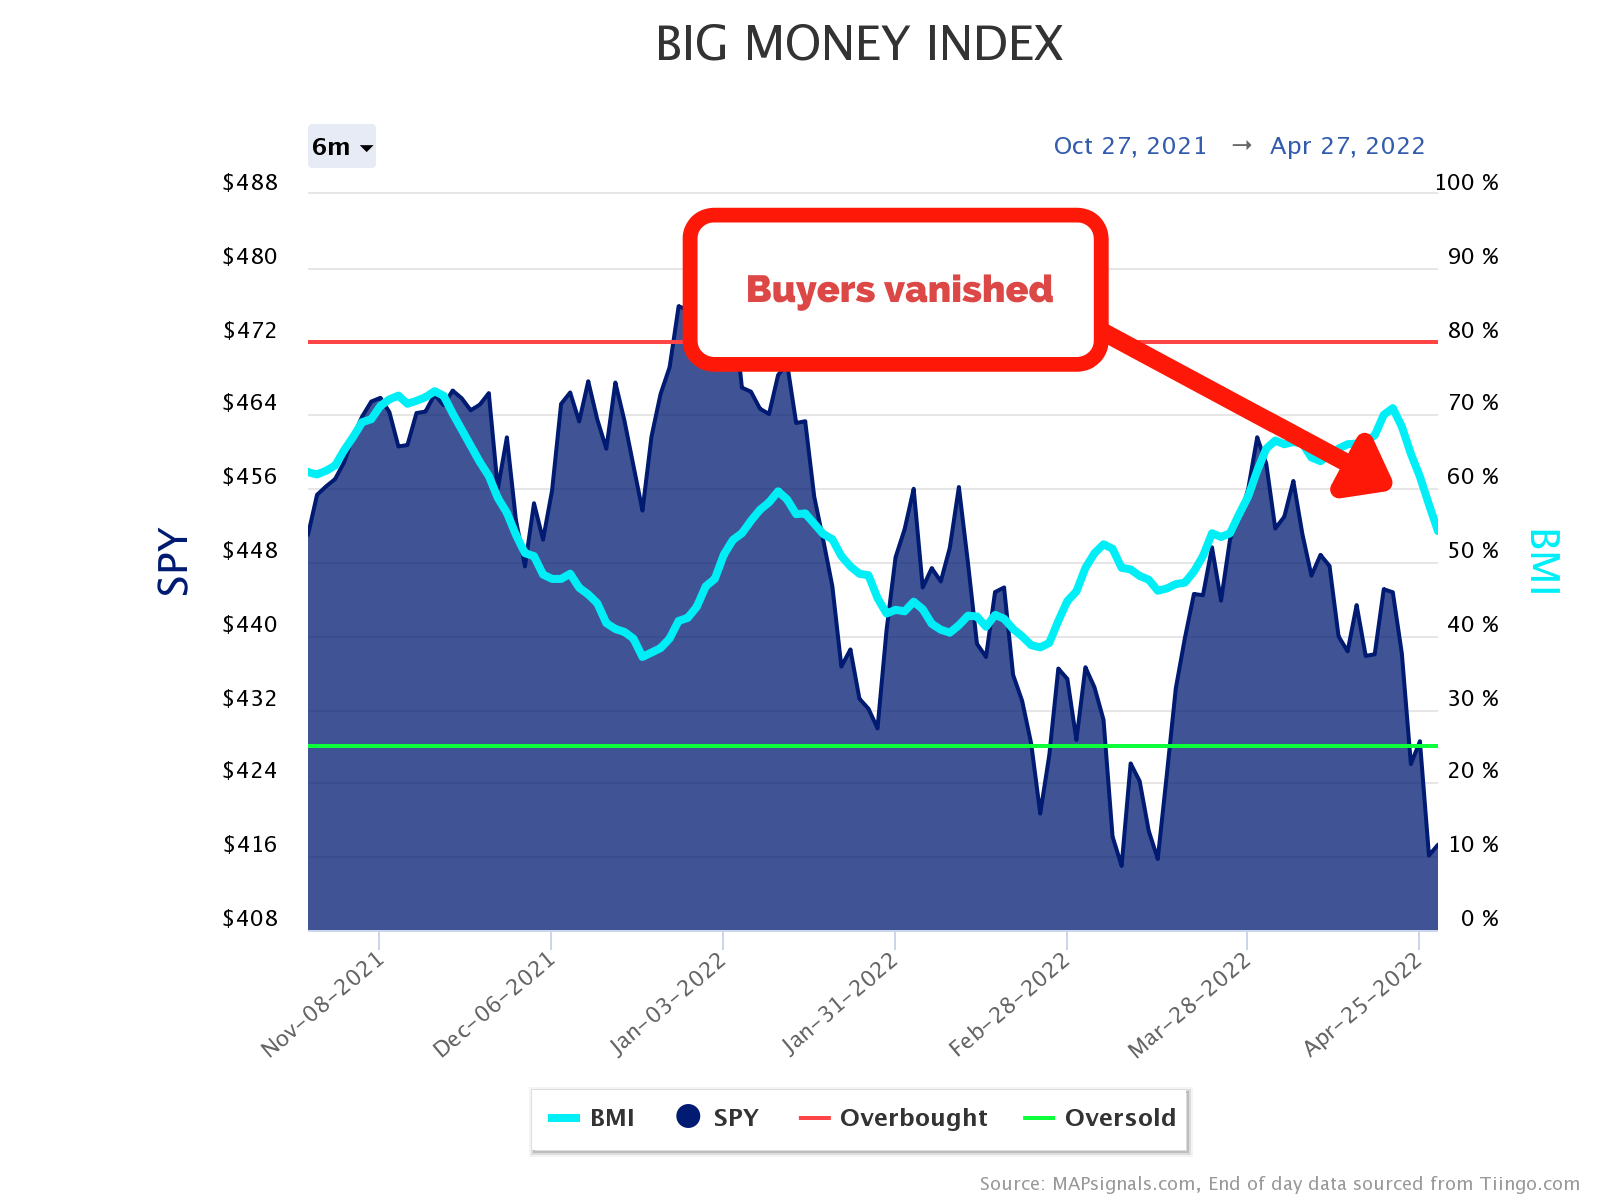
The last week saw the BMI fall from 71% to 54%. That’s a massive shift. But we’ve come to expect choppiness. The rangebound action of the BMI over the past 6 months points to the many rotations under the surface.
One week Tech stocks fall and Energy ramps. The next week small-caps rally as defensive companies thrive. It’s been difficult to follow!
But this latest trend in data clearly points to a lack of leadership anywhere.
Usually, the BMI moves slowly. But when buyers disappear, it can fall quickly – like now. Below you’ll see what’s causing the deterioration in our daily buys and sells chart. I’ve pointed to what’s important. There’s been practically no buying since Thursday:
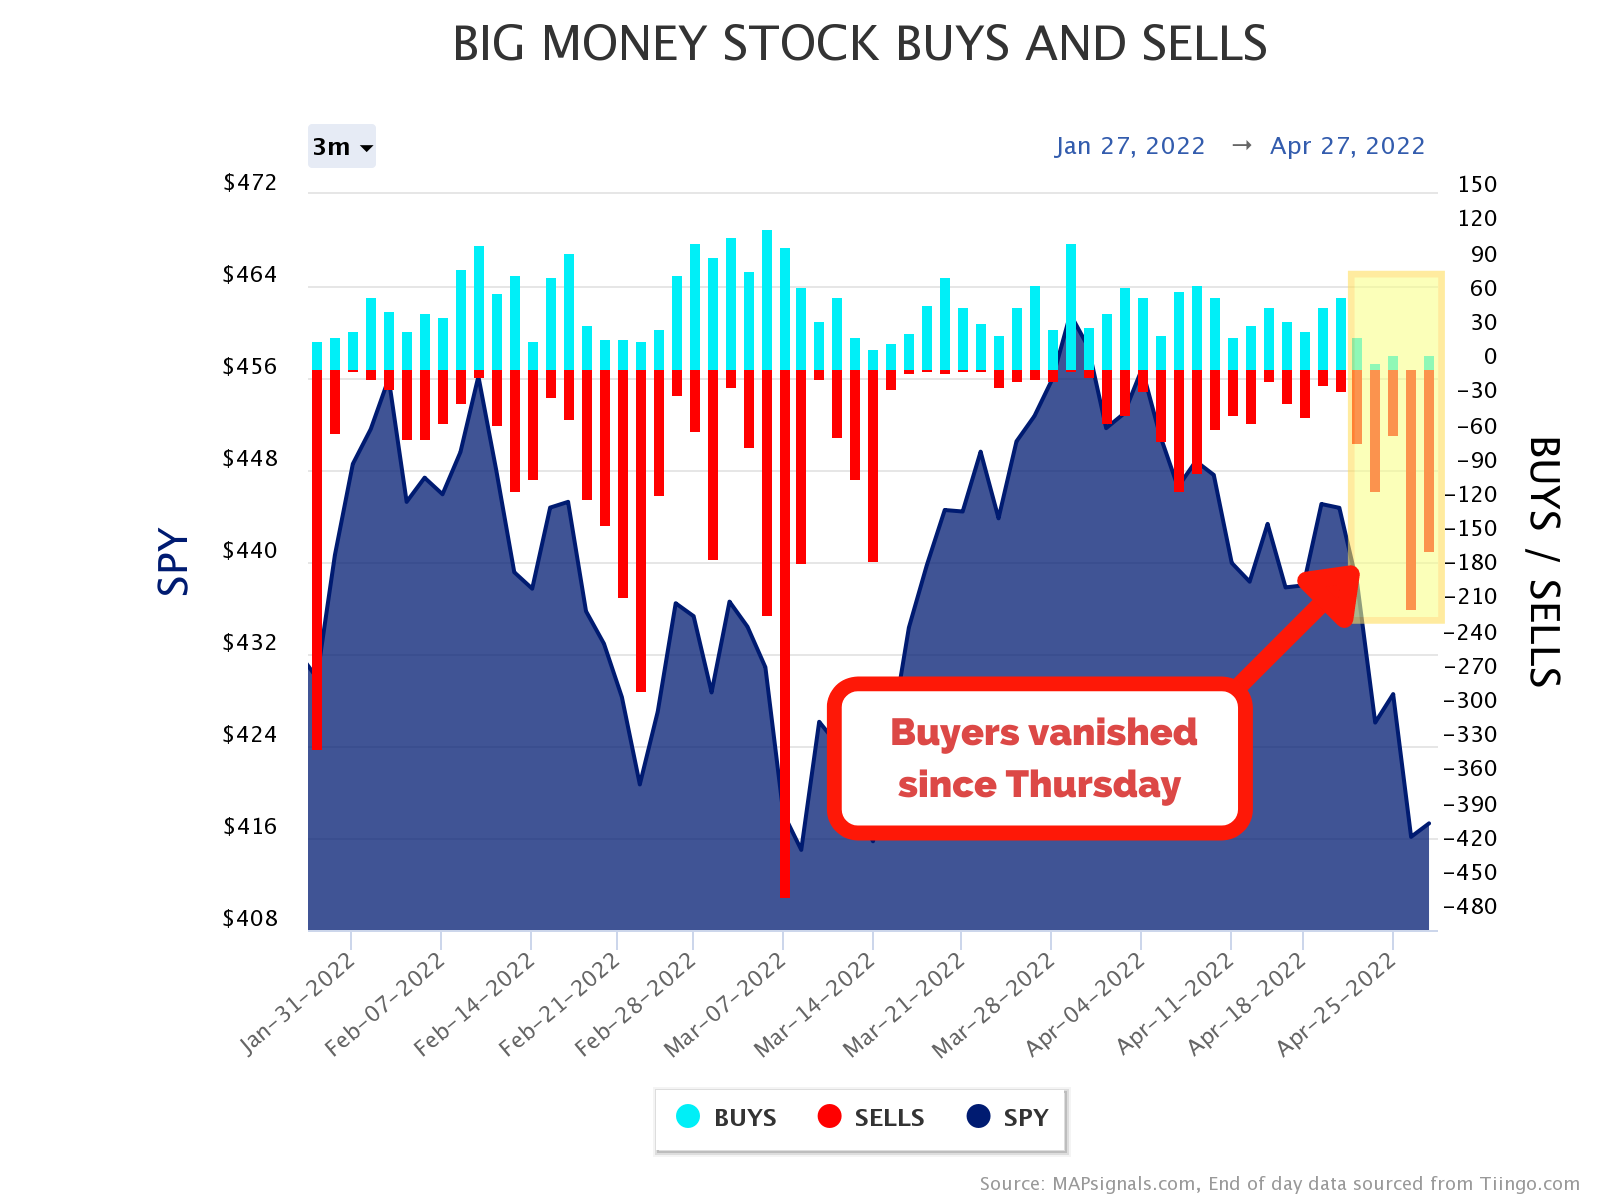
Just on Tuesday alone, our data triggered 209 stocks getting sold. But more importantly, there were zero buys. That’s very rare risk-off action that happens typically when portfolios are under stress. Portfolio managers sell everything (even the good stocks) and get leaner as fear perks its ugly head.
When no one is buying, sellers take control.
This action also suggests that the BMI will fall further in the coming days, until the selling pressure dries up. As of now, there’s no indication the selling is done. But we know it’ll stop eventually…history proves it always does.
And that begs the million-dollar question: How do markets perform after big sell days with virtually no buyers? We studied prior days similar to Tuesday’s action for answers. The results may shock you.
Market Performance After Huge Selloffs
After sitting on a Wall Street trading desk for years, I learned that opportunities usually arise when markets are in free-fall. And the cool thing is the data also backs it up.
So, we went back and studied other large selloffs for clues on what’s ahead.
For the first lookback, we pulled all days when QQQ was down more than 3.5% in a day going back to 2003. There were 59 instances. The forward 1-month to 3-year performance is incredibly bullish:

The 1-year return on average for QQQ after a 3.5% down day is a massive +33.2% gain. Wow! It’s hard to be long-term bearish with numbers like that.
But what about the MAPsignals data? You know, the big chunky red bars. We studied that, too.
Study number 2 looked at all days since 2003 with two variables: a day with at least 200 stocks being sold and less than 10 stocks getting bought. So again, we wanted to isolate huge sell days with hardly any buyers…major risk-off sessions.
The results are in. Out of 113 similar days to Tuesday, the forward performance for QQQ is off the charts positive:

Returns source: FactSet
That’s oodles of green. Trawling through data paints a rosier picture for stocks than any headlines I can find right now. Big selloffs have been fertile grounds for adding to great stocks. And that’s what we’re all about at MAPsignals.
Based on these forward gains, when the buyers disappear…it’s a long-term opportunity. So smile!
Let’s wrap up.
Here’s the bottom line: Data continues to shift left and right the past year. And lately we’re seeing very intense selling, dropping the BMI hard.
The short-term picture for stocks is cloudy. There’s no doubt about it. In fact, I can’t say the selloff is done. But, if history is any guide, the long-term picture is amazingly bright for great companies. And that’s what matters.
That’s also the message of the greatest investors of all time too. Warren Buffett and Peter Lynch remind us to focus on the long-term. It’s how you build incredible wealth.
Look, at some point, the buyers will step back in and great stocks will dominate like they’ve done in the past. Until then, I’m inclined to add a little risk on these big nasty selloff days. History says I’m likely to be rewarded.
What say you?
***And if you’re thinking about getting defensive in your portfolio, Jason’s latest video is out: Best Defensive ETFs To Buy Now for May 2022. He walks you through some ideas using our portal for subscribers.
Always remember that the process is more important than the picks.
Make sure to follow our YouTube channel here so you never miss any of our videos.