Always Follow Mama Goose
Goslings follow the leader.
It’s very simple – wherever mama goose goes, they go.
The Big Money Index is like mama goose.
As we’ll show, it’s a leading indicator.
Right now, mama is changing directions.
We are slaves to our data – we react as new information emerges.
Simply stated, we always follow mama goose.

Always Follow Mama Goose – The Big Money Index
We try and only focus on changes.
Our job is pretty boring – we simply follow the big money.
Last week we reached overbought – the big money index is dropping a dime.
A dime is an assist in basketball.
Assists in investing, help us navigate markets.
This week, we noticed 2 things that may signal changes…ie, markets could be ready to pullback.
- The Big Money Index stalled on Wednesday. This is important because the index rallied for 6 weeks straight.
- The Big Money Index fell this morning. This just confirms that we have likely peaked with the BMI.
So, why is all of this important?
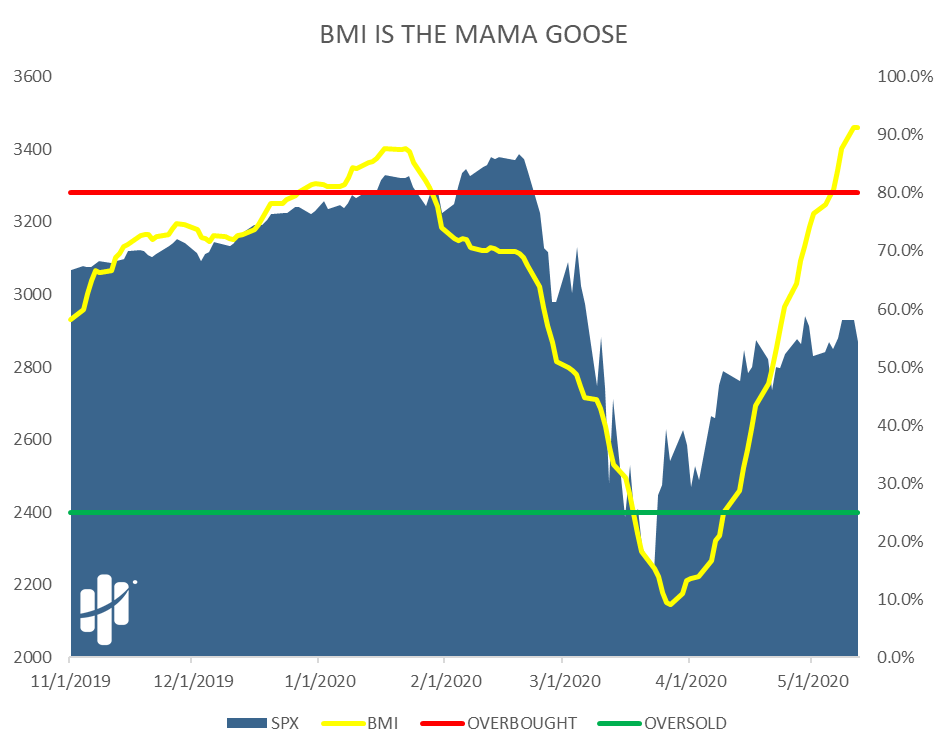
Have a look, below.
This is a zoom-in on the BMI.
As a reminder, on January 30th, we signaled Ch-Ch-Ch-Changes in our data.
We noticed that the index was falling back then.
That meant, a pullback was likely near.
The Big Money Index is a leading indicator.
There are 2 takeaways:
- Look how the BMI began to fall in late January before the market pulled back.
- Notice how the BMI signaled oversold, days before the low. If you recall, when we went oversold, we yelled to send the marines.
Right now, the data is signaling a change.
We expect the BMI to fall in the coming days and weeks.
To us, that’s a good thing.
We haven’t aggressively added to great stocks in many weeks.
Maybe we’ll get our chance in the weeks to come.
Technology Stocks Rule The Roost
Clearly some stocks have been blasting higher.
There are a handful of big winners – we own many.
We just released our MAP 50 list for May.
It’s Mapsignals’ best stocks – out of all stocks.
April’s MAP 50 beat the S&P 500 by a factor of 3 last month, just FYI.
This list is only available to subscribers.
But, look at the sector concentration below…if you look closely, you’ll see where the big money has been flowing.
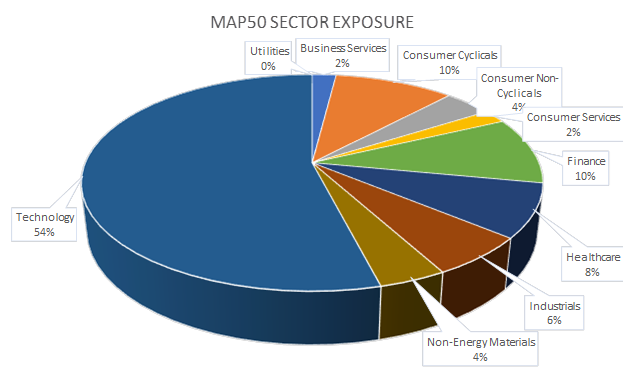
That’s right, over half of our top stocks are in Technology.
And that has been the best place to be…ie, always follow mama goose.
So, check this out.
We calculated the performance of the MAP 50 list released on April 15th, as of May 13th.
The average return for all 50 stocks was +9.5%.
Compare that to SPY (S&P 500 ETF), which returned +3.21% over the same period.
That’s juice.
How Mapsignals Plays An Overbought Market
Do we expect to revisit March lows?
No.
We do expect a modest pullback after a monstrous rally.
We bought the dip back in March and have been cruising ever since.
For us, now is not the time to rush in with both hands.
Being patient will pay off.
Each week we display the BMI as a speedometer.
The below image should tell you how we feel:
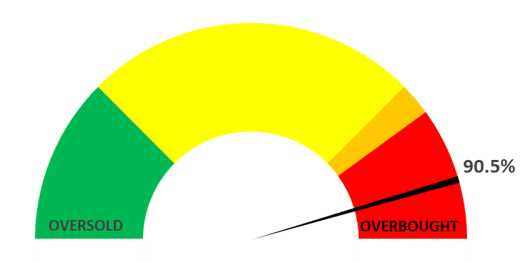
Green means go and red means stop.
We save emotion for our family life. When investing in stocks, we simply follow the big money.
Right now, the data suggests that lower prices are around the corner.
Signs point to changes.
In one nursery rhyme – mother goose flew to the moon.
Our data tells the same rhyme.
Stocks flew to the moon.
No matter what happens, we always follow mama goose.
For more on how to become a Mapsignals subscriber – click here.