")
Big Money Index Is Dropping A Dime
In basketball, dropping a dime means to assist another player.
This helps them make an easy shot.
That’s what Mapsignals tries to do with investing.
We look for an edge – based on stats.
Scottie Pippen was the king of dropping a dime.
Right now, our data is dropping a dime.
Big Money Index Is Dropping A Dime
Stocks have risen like a phoenix from the ashes.
Our strongest buy signal came on 3/19/20 – we said to send the marines.
Wicked rallies tend to happen when stocks get destroyed.
The recovery in stocks has taken people by surprise, but this is very typical price action.
Below you can see that the Big Money Index is now overbought.
There are 2 things I want to point out about this rally:
- Markets can easily become overbought after being oversold
- This overbought market is technically based – not FOMO-based
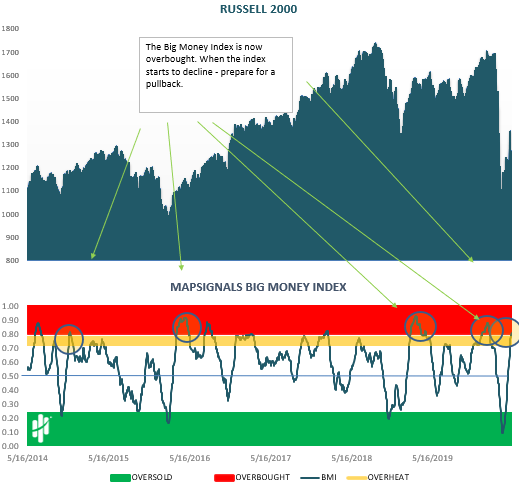
As you can see, the three prior times we went oversold (green area) we quickly became overbought soon after.
That’s exactly where we are now.
December 2018 was the last oversold signal we saw prior to the pandemic.
Back then, it only took about 6 weeks for the market to hit overbought.
This is similar to what we are seeing now.
We were oversold just 7 weeks ago.
Does this mean markets are going to crash?
No.
An overbought market, like this, is likely going to last a while…likely weeks.
That’s what you can expect with a technical repricing.
When the Big Money Index starts to fall – pay attention.
The last time it fell when markets were overbought was in late January, Ch-Ch-Ch-Changes.
Leading up to then we were overbought for a while – we were extremely cautious.
Big ETF Buying Is No Where To Be Seen
One of our favorite measures for an exuberant market looks to ETFs for clues.
Big ETF activity was dropping a dime back in January.
Today is different.
We don’t believe this market rally is FOMO-based.
If it were, we’d likely see ETFs getting bought by retail folks.
Below is the Mapsignals Big Money ETF chart.
It tracks big unusual trading in ETFs.
When markets get extremely overbought, we usually see big green sticks before markets fall.
Green sticks indicate big money is likely going into ETFs (usually near peaks).
Red sticks indicate big money is likely going out of ETFs (usually near lows).
The takeaway now is how ETF buy signals are non-existent…ie no FOMO.
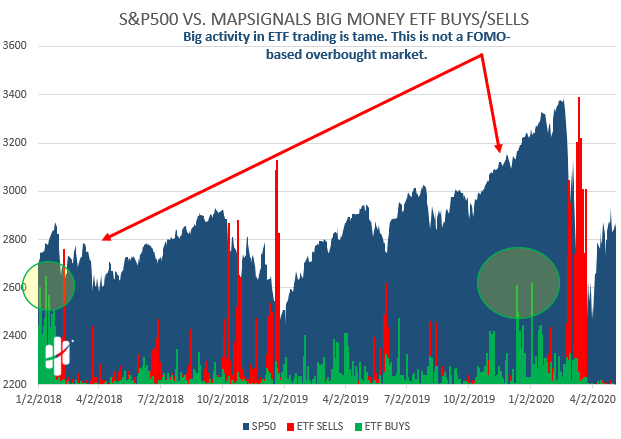
This likely means that markets have a little more gas to burn before exuberance hits.
Big Buying In Stocks Is Ramping
Not all stocks are participating in this rally.
Technology and Health Care names lead the charge.
This has been a theme we’ve been talking about for weeks.
There are a handful of monster growth stocks breaking out.
Great examples are Shopify, Inc. and Masimo Corp.
Below are the top 20 signals they have made:

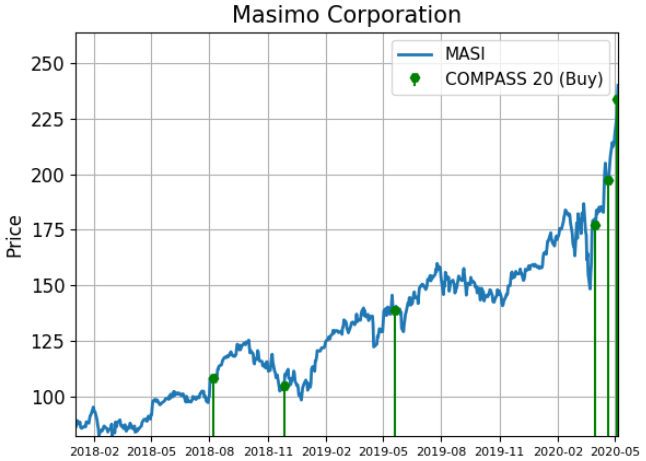
For more stocks like these, consider subscribing to Mapsignals.
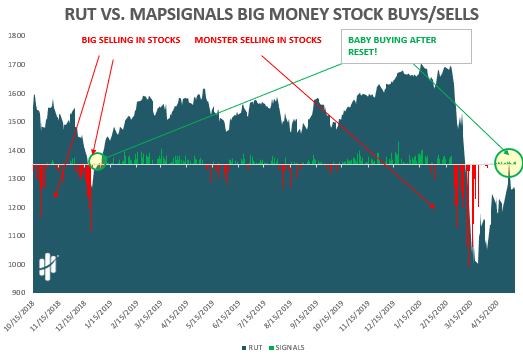
But, what’s going on under the surface?
There aren’t a ton of stocks gapping higher on big volume – but, the numbers are growing…like seeds.
The following chart was dropping a dime a month ago when we posted climate change market.
Green sticks = there are more buys than sells for a given day.
Red sticks = there are more sells than buys.
Those little seeds from a month ago are becoming little trees. Like after a forest fire, eventually the seedlings break through the scorched earth…
Bottom line: our data is dropping a dime.
It’s an assist for what’s to come.
We aren’t scratching our heads with this market action.
We’ve seen this time and time again. Data makes our view unemotional and scientific.
It’s simple, follow the big money.
Buyers are in control right now, and until that changes, enjoy the ride.
Don’t make your shots complicated.
The easiest shots come from assists.