• Menu
  • Skip to right header navigation
  • Skip to main content
  • Skip to primary sidebar
  • Skip to footer

MAPsignals

We map big money.

  • Latest Insights
  • Power of MAP
    • MAP Products
    • MAP System
    • MAP White Papers
    • Videos & Interviews
  • Profit with MAP
  • About
    • About MAP
    • MAP Team
    • Authors
    • MAP System
    • MAP Products
    • Big Money Index
  • Members
    • Get Started With MAP
    • My MAP
    • Big Money Charts
    • MAP View
    • MAP View Options
    • MAP Top 20 Weekly
    • MAP 50
    • Member Updates
    • Platinum Updates
    • Members Only Posts
    • Performance
  • Portal

Are We There Yet

January 7, 2021 //  by Lucas Downey//  11 Comments

 “Daddy, are we there yet?”

“We’ll get there when we get there. Try and relax.”

It’s the same story every road trip.  Anyone who has taken a 3-hour car ride with young kids knows the strife I speak of.

The first half hour is a thrill. We’ll play “I spy” and sing songs to kill time. But then something changes as boredom sets in. The anticipation of the destination isn’t the focus anymore.

are we there yet

Extreme overbought periods for stocks are similar to agonizingly long road trips. Impatient investors, like anxious kids may start out planning for a pullback. They are eager to wait for great deals.

But being patient is hard! The inevitable questions start trickling in: are we there yet? Is it time to go to cash?

Patience and process quickly give into emotional impatience. Experienced investors are the road-trip driver: they know we’ll get there when we get there.  Being frustrated that we’re not there is a waste of energy. And it rubs off on everyone else too- like kicking the seat.

I learned long ago, there’s peace in the moment: enjoy the ride, take in the scenery, and let your mind wander. 150 miles is 150 miles no matter how you slice it…

That brings us to where we are now. Stocks are doing some incredible things. Yesterday’s rally was epic from a data standpoint. Things are getting extremely overbought.

We gave our data-driven market forecast, “when will stocks pullback” back on December 20th  for our readers. What we are seeing now is late-stage irrational buying.

So, about that nagging question:

Are we there yet? Have market’s peaked? Could it go on?

Sure. But, no matter what: data drives our decisions.

Big Money Index – Are We There Yet?

Markets have been overbought for nearly 5 weeks. This is right in line with our 30-year historical average. MAPsignals data told us to expect this.

The Big Money Index is leveling off:

big money index are we there yet

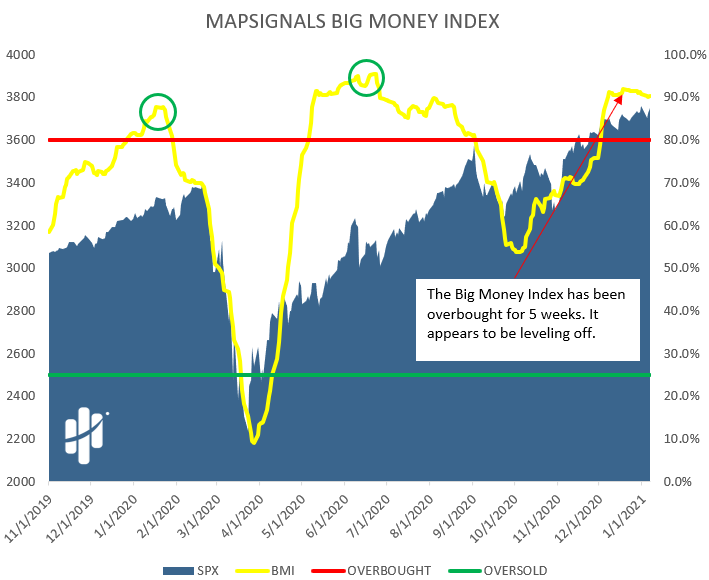
We believe the BMI has peaked which our data predicted would happen December 21st. So far, the actual peak reading of 91.9% was December 18th! So, our prediction was off by only one trading day – but right on schedule…

This flattening indicates we’ve reached that orbital velocity we were expecting. Any meaningful pullback in the Big Money Index would be a warning sign.

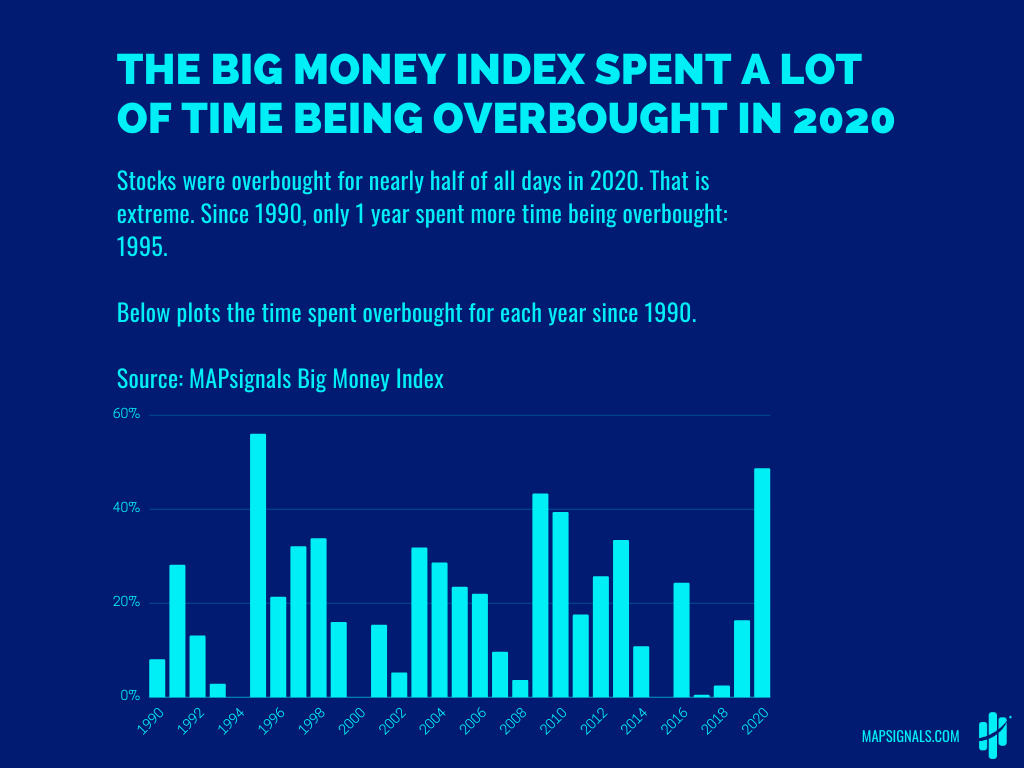
But before you ask if we’re there yet, you should know that markets sometimes stay overbought for incredible durations.

For example, look no further than last year. We looked at overbought periods going back to 1990. Shockingly, 2020 stayed overbought for nearly 6 months!

Time spent overbought

Some trips take longer than others. Being annoyed doesn’t change the arrival time.

As I said, we religiously follow the data.

Where the BMI goes, markets tend to follow.

So, We’re not there yet!

But, we are getting closer. Let’s pass some time looking at some scenery.

Stocks See Epic Buying

We foresaw yesterday being an epic buy day. And we were right.

Below shows the daily count of stock buy and sell signals. It was a monster day:

monster stock buying

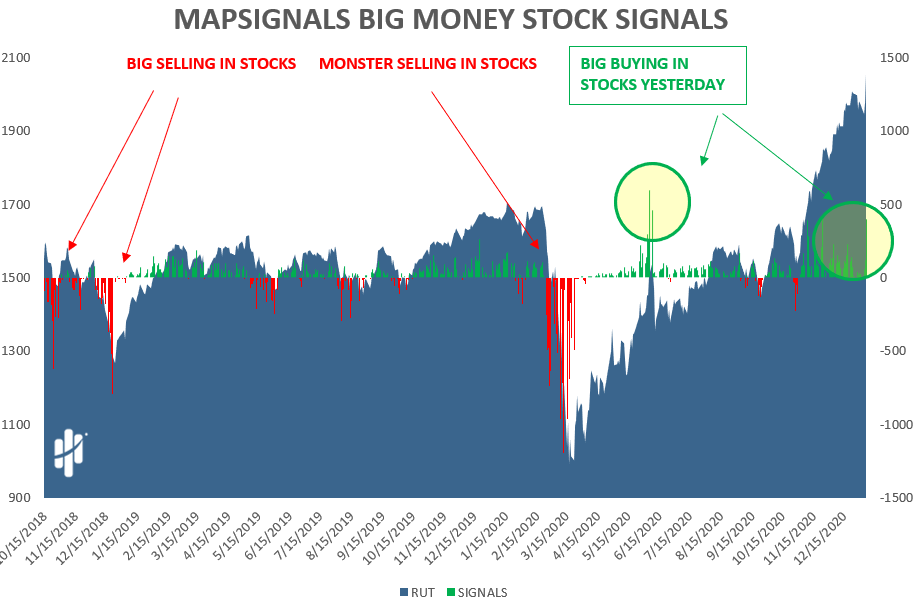
Let’s zoom in on that. We call this juice:

monster stock buying zoom in

Typically, when we see meg-buying like this, while being extremely overbought, it’s a warning sign: Things are frothy.

Most buying was in Discretionary, Financials, Energy, Industrials, & Materials… familiar strong sectors lately.

“Now, are we there yet?”

We’re getting there. But this wasn’t the only warning sign.


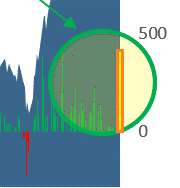
ETFs Also See Huge Buying

To get where you’re going, you’ve got to know where you’ve been. Most importantly, you’ve got to know where you are. Sometimes big buying is bullish, like when stocks have been in a downtrend.

Other times like now, it’s late stage buying. When we see epic ETF buys in an extremely overbought market…it’s usually signaling a near-term bearish warning.

ETFs see huge buying

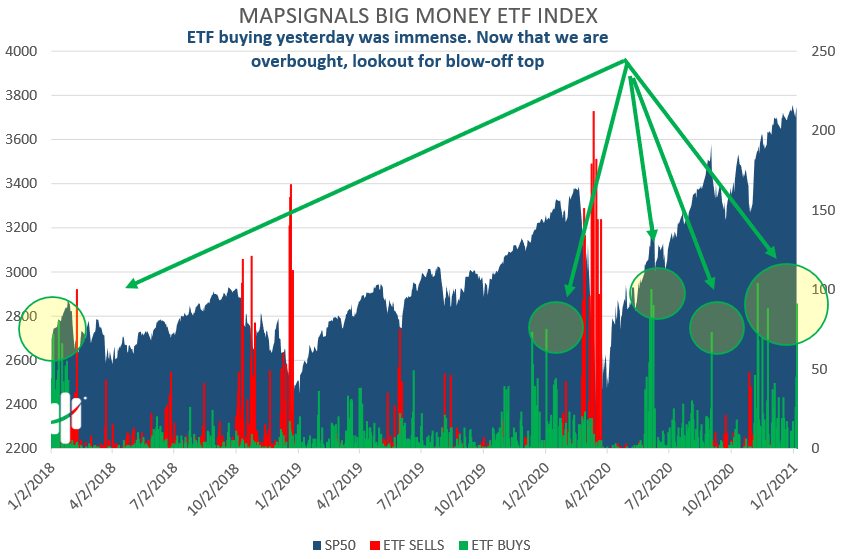
Looking above, we see that big green ETF sticks usually align with near-term market peaks.

The warning signs are here folks. The signs say the big bullish road trip is coming close to the end. But when the road trip ends and we get to Disneyland- the fun starts!

So, don’t freak out- this doesn’t mean we are bearish on stocks medium or long-term. We foresee a market pullback as a natural correction. When stocks get too lofty, they need to come back in line.

So, don’t get too impatient! Jumping in and buying stocks with both hands now is likely a poor idea. Better prices are likely around the corner.

The Bottom Line: extreme greed is in the air. Signs are pointing to a near-term peak in the coming weeks. Our data predicted the BMI to peak December 21st. It happened on December 18th. Our data predicts that the market will peak on January 18th, 2021 at a level of 3828.50.

Whether or not we nail it to the day is unimportant. What is important is for you to start prepping your buy lists now. Be prepared, but also try and relax.  The ride is the ride, no matter how long or short we want it to be.

The next time someone asks you: Are we there yet? Has the market peaked?

Feel free to use my response: I spy with my little eye, a blow-off top is nigh.

Lucas Downey
Lucas Downey

Lucas is co-founder of MAPsignals. His full bio can be found here.
Prior to MAP, he was Head of ETF Sales at Cantor Fitzgerald & SVP of Derivatives at Jefferies, LLC.

Spread the word!

Category: All, Big Money Insights Weekly

Previous Post: «BIG MONEY 20 Big Money 20 January 2021
Next Post: How To Handle Market Exuberance big money podcast»

Reader Interactions

Comments

  1. Tomas

    January 7, 2021 at 11:18 am

    Hi gents. Well as I’m writing this shortly after your post the SPX is at 3805. Would you prioritise the date or the SPX value in your prediction? Thanks

    Reply
    • MAPsignals Staff

      January 7, 2021 at 12:04 pm

      Hey Tomas – it’s only a framework to build expectations. The data will always be paramount.

      For us the timing tends to be more important than the level. The beauty is we can pivot with new incoming data. Enjoy the ride!

      Reply
  2. Ali

    January 7, 2021 at 11:48 am

    As usual great post, patience is the key to success in this game!

    Reply
  3. Sal

    January 7, 2021 at 11:52 am

    Hi first of all. Thank you for your service, a bright spot in the advisory market.
    I have a theory that should match yours and was wondering about your opinion.
    I fully agree that during the following two to three weeks the market will significantly correct and this might be simply after the major earnings…the actual and main reason will be results and guidance totally inconsistent with the current lofty valuations…Thanks

    Reply
    • MAPsignals Staff

      January 7, 2021 at 12:10 pm

      It certainly could be the case. Often we find that the price action occurs first, then the story follows.

      In general, there tends to be clues that we can point to once buying in stocks slows. Always keep in mind that we are in extraordinary times. Holding outlier stocks tends to pay off long-term no matter what happens.

      Reply
  4. Dita

    January 7, 2021 at 12:49 pm

    What are examples of outlier stocks.

    Reply
    • MAPsignals Staff

      January 8, 2021 at 8:31 am

      Hey Dita – check out our whitepapers to get a feel for what outlier stocks are.

      You can find our white paper catalog here: https://mapsignals.com/white-papers/

      Reply
  5. Harald

    January 7, 2021 at 3:37 pm

    It is too simple to rely – or put too much weight – on one single indicator. The Smart Money Index is one of many. An important one. But watch also the VIX, The Accumulation – Distribution Line – and – first and foremost the chart itself.

    Reply
    • MAPsignals Staff

      January 7, 2021 at 4:19 pm

      100% agree. We look at everything in the collective to base our outlook.

      Reply
  6. Tomas

    January 8, 2021 at 11:44 am

    A live day to day BMI chart would be a great addition to the site

    Reply
    • MAPsignals Staff

      January 8, 2021 at 12:06 pm

      That is the top priority this year. Bringing our data to life for everyone.

      We will get there, likely in 2021.

      Reply

Leave a Reply Cancel reply

Your email address will not be published. Required fields are marked *

Primary Sidebar

Get Big Money Insights for FREE

Want to know where the Big Money is headed?

Just enter your email address below. You'll get our FREE NEWSLETTER sent directly to your inbox.

We call it Big Money Insights... It’s your weekly sneak peek at the powerful market-moving forces that are hidden from 99% of investors.

"*" indicates required fields

This field is for validation purposes and should be left unchanged.

Categories

  • All
  • Big Money Insights Weekly
  • Big Money Series
  • Macro Insights
  • MAP In The Media
  • Members Only
  • Performance
  • Podcast
  • Special Reports
  • Stocks
  • Videos & Interviews
  • White Papers

Archives

  • February 2023
  • January 2023
  • December 2022
  • November 2022
  • October 2022
  • September 2022
  • August 2022
  • July 2022
  • June 2022
  • May 2022
  • April 2022
  • March 2022
  • February 2022
  • January 2022
  • December 2021
  • November 2021
  • October 2021
  • September 2021
  • August 2021
  • July 2021
  • June 2021
  • May 2021
  • April 2021
  • March 2021
  • February 2021
  • January 2021
  • December 2020
  • November 2020
  • October 2020
  • September 2020
  • August 2020
  • July 2020
  • June 2020
  • May 2020
  • April 2020
  • March 2020
  • February 2020
  • January 2020
  • December 2019
  • November 2019
  • October 2019
  • September 2019
  • August 2019
  • July 2019
  • June 2019
  • May 2019
  • April 2019
  • March 2019
  • February 2019
  • January 2019
  • December 2018
  • November 2018
  • October 2018
  • September 2018
  • August 2018

Follow us on Twitter

MAPsignals Follow 1,430 1,061

MAPsignals is a data platform that tracks institutional money flows in stocks and ETFs. Sign up for free insights here: https://t.co/SaAVHjKC9J

mapsignals
mapsignals avatar; MAPsignals @mapsignals ·
10h 1621212723706040320

Glad to see more positivity in my feed lately.

Stocks going up is helping!

Reply on Twitter 1621212723706040320 Retweet on Twitter 1621212723706040320 0 Like on Twitter 1621212723706040320 3 Twitter 1621212723706040320
Load More...

Footer

© 2021 Mapsignals.com

  • Home
  • Contact & Disclaimer
  • Privacy Policy
  • Terms & Conditions
  • Opt-out preferences
  • FAQ

Copyright © 2023 · Mai Law Pro on Genesis Framework · WordPress · Log in

✕
What Happened to Risk Assets White Paper is Here

Get your copy here and take a journey through our thoughts on margin and leverage.

Enter your email address below and you'll get our FREE NEWSLETTER sent directly to your inbox. 

 We call it Big Money Insights... It’s your weekly sneak peek at the powerful market-moving forces that are hidden from 99% of investors.

MAPsignals
Manage Cookie Consent
We use cookies to optimize our website and our service.
Functional Always active
The technical storage or access is strictly necessary for the legitimate purpose of enabling the use of a specific service explicitly requested by the subscriber or user, or for the sole purpose of carrying out the transmission of a communication over an electronic communications network.
Preferences
The technical storage or access is necessary for the legitimate purpose of storing preferences that are not requested by the subscriber or user.
Statistics
The technical storage or access that is used exclusively for statistical purposes. The technical storage or access that is used exclusively for anonymous statistical purposes. Without a subpoena, voluntary compliance on the part of your Internet Service Provider, or additional records from a third party, information stored or retrieved for this purpose alone cannot usually be used to identify you.
Marketing
The technical storage or access is required to create user profiles to send advertising, or to track the user on a website or across several websites for similar marketing purposes.
Manage options Manage services Manage vendors Read more about these purposes
View preferences
{title} {title} {title}