
Orbital Velocity
Stocks have reached orbital velocity. That’s when markets blast into overbought conditions and drift there for a bit…typically weeks.
It may feel like you’re sitting still right now, but you’re moving really fast. The earth that you’re sitting on is rotating at roughly 1,000 miles per hour.
To get a satellite up in orbit, you need to first get out of earth’s atmosphere. You have to blast up out of the atmosphere at 25,000 mph. Once there, satellites can circle around Earth suspended in a geostationary orbit, by maintaining a speed of ~7,000mph…

Stocks act the same way.
To launch a satellite, you need a rocket to blast it through the earth’s atmosphere. To get an overbought market, stocks need to hitch a ride on rocket-fueled buy signals. The red overbought area of the Big Money Index acts as a barrier: similar to the earth’s atmosphere. Once momentum in stocks gets going though, it builds and builds until finally the blastoff happens.
Since the initial vaccine news on November 9th, stocks rocketed higher.
For weeks, the BMI flatlined as money sloshed in and out of sectors. Then last week, stocks finally pierced through the red zone. MAPsignals’ data suggests that they’ll be suspended here in orbital velocity for a bit.
Let’s recap the launch that got us here.
Big Money Index Reaches Orbital Velocity
At MAPsignals, we try to keep things simple. If the Big Money Index is heading higher, it tells us to stay bullish. We planned for that in our early November post, we have liftoff. The data has been a one-way train: big buying. Since the election, sellers just disappeared.
You can see that as the BMI ramps like this:
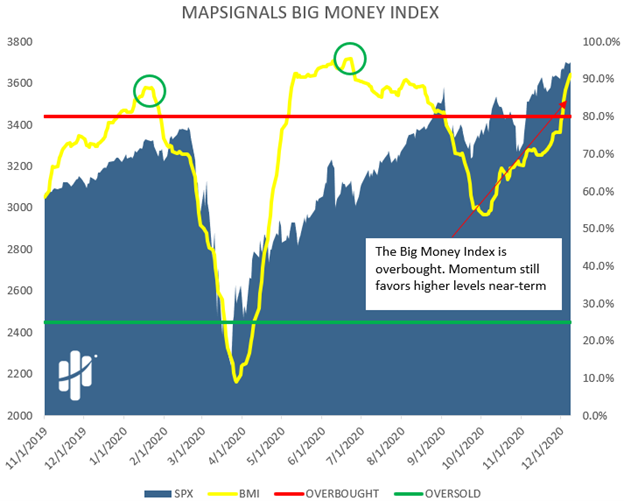
We are reaching levels that tell us a market peak is near. Which means, the yellow line can’t get that much higher: 100% is the max. As a reminder, the BMI measures all signals netted over a 25-day moving average in terms of buying. If there isn’t a single sell signal for 25 days- the BMI would be 100.
While the BMI can’t break above 100, it can sustain orbital velocity for weeks and in rare cases (like this year), months. That’s why we expect the market to stay overbought for a few weeks. We believe markets should stay elevated until sell signals increase.
When selling finally arrives, it acts like gravity on the BMI. A falling BMI will likely begin once the reopen stocks slow their climb. I say “reopen” because the engine driving stocks higher since the election/vaccine news has been small-cap and value stocks.
Small-Cap Stocks See Monster Buy Signals
We discussed the rotational rampage a month ago… the key point being that growth stocks are no longer the spotlight of the market.
Since the Pfizer vaccine news on November 9th, companies with market capitalizations of less than $25B have collected the most capital.
As you can see, nearly 80% of all buy signals since then have been in smaller companies…ie the “reopen trade.”
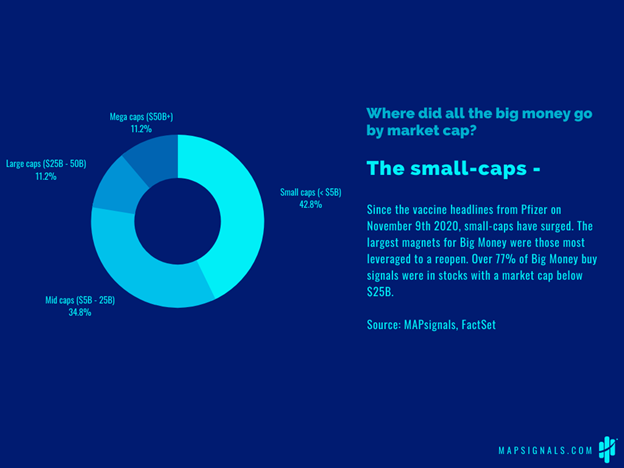
Those tiny companies are the rocket fuel lifting the market. If they continue to stay bid, the BMI will maintain its orbital velocity.
Now, let’s look by sector. The reopen theme is dominant in our data. Looking over the same period since November 9th, we see that the top 6 sectors attracting the most buys are:
- Financials
- Discretionary
- Technology
- Industrials
- Healthcare
- Real Estate
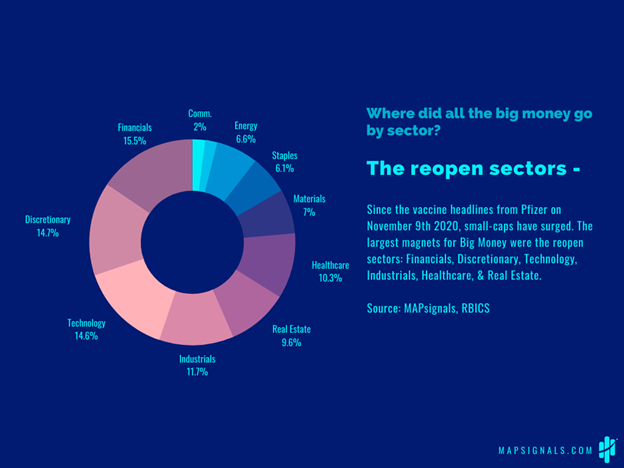
The chart above shows how prior dead sectors have awakened with a vengeance. Groups that were battered because people were told to stay home, have now gotten a boost with a reopening in the foreseeable future.
Excitement for these areas of the market are running hot to say the least. One might call it exuberance…
Reopen Sectors See Huge Momentum
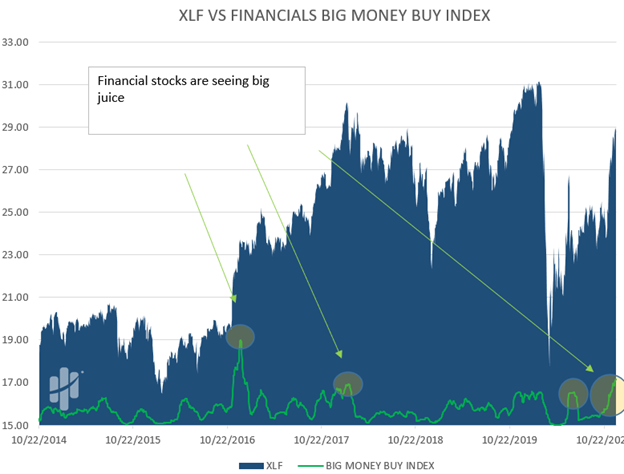
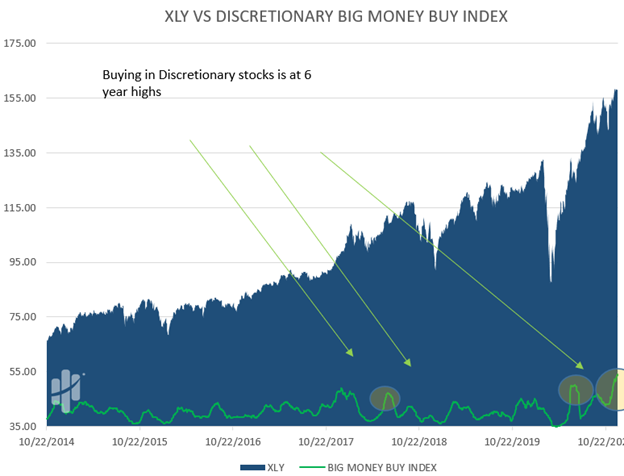
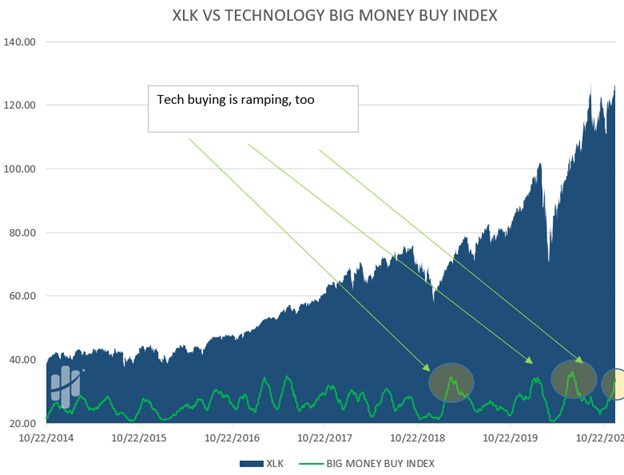
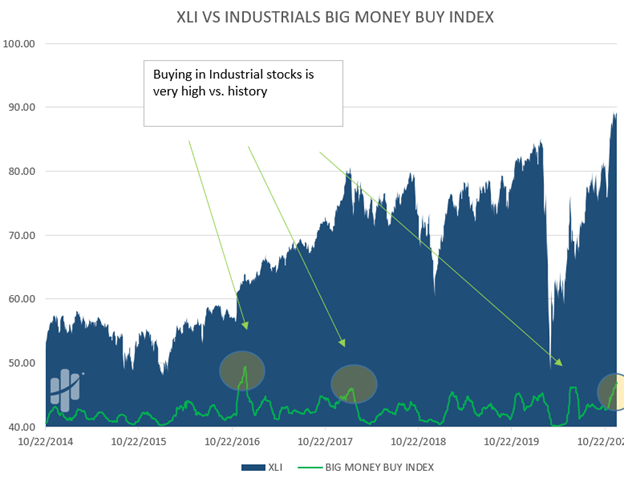
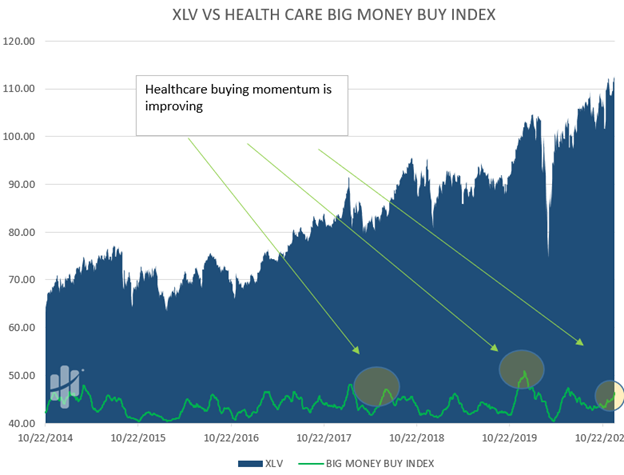
A sector’s true story can be told by measuring its magnitude of buying, which can’t be seen in a conventional price chart. When we plot the momentum of buying over a normal chart, “invisible” patterns emerge.
Below are charts plotting the 25-day moving average of buy signals against each relative sector index ETF. A rising green line means that the momentum of buying in the sector is increasing quickly.
Notice how when our Big Money Sector Indexes peak, they tend to line up with sector peaks:
First up is Financials:
Next, Discretionary:
Technology is ramping, too:
Industrials:
And Healthcare:
Lastly, Real Estate:
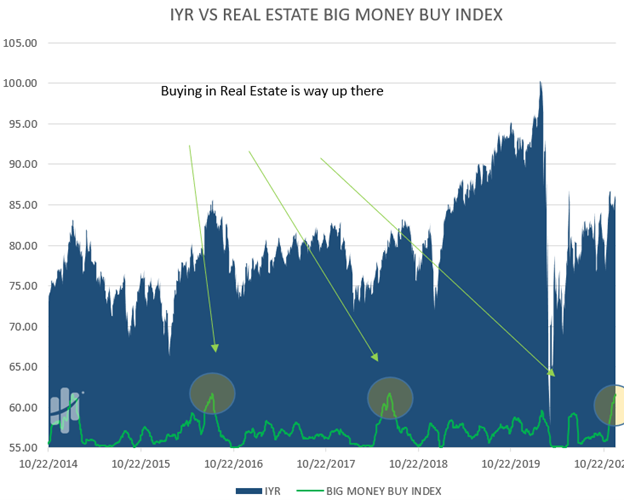
When you couple these charts with tables detailing small-cap and value buying above, we see the real picture. Wall Street thinks forward- not in terms of today. The street has repriced all of these previously hated sectors virtually overnight.
They have risen so far so fast that near-term, they may be too hot to handle. But can they rise more? The answer is yes, so be careful as you pick your spots.
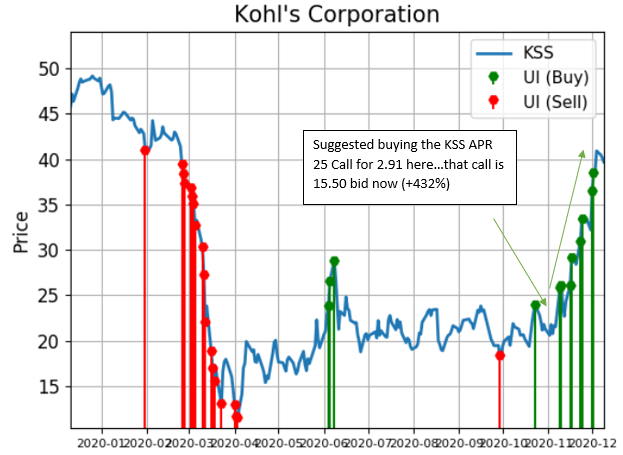
For the many who missed it, the best time to get involved in the reopen trade was sadly weeks ago. But MAPsignals regulars did not miss the rocket on Discretionary stocks heading to the moon. We had some amazingly prescient Retail option picks the weeks of 10/25/20 & 11/1/20.
As an example, on 11/1/20 we showcased Kohl’s Corp. (KSS) as a long idea…the stock was trading at $21.29. The setup was to buy 1 KSS APR 25 Call for 2.91…
As of this writing, KSS is trading at 39.67. The call is $15.50 bid, which means an unrealized return of +432%!
Source: MAPsignals, End of day data sourced from Tiingo.com
(*hypothetical performance which may or may not be possible)
That’s rocket fuel right their folks. If you want to learn more about our options subscription, head on over here.
Here is the bottom line: rockets and stock-blastoffs amaze us all. Don’t let the fireworks dazzle you and divert your attention. We are heavily overbought, but should stay that way for a few weeks…ie orbital velocity.
For astronauts reading this, now would be a good time for a spacewalk. The shuttle should cruise for a bit, but when it’s time to get back in- it will be quick.
If you are curious on our latest market thoughts, we discuss our data in detail on our latest podcast, The Investing Bonus Level. It turned out to be a timeless discussion on how investors should handle these overbought periods from a historical perspective.
We have achieved orbital velocity and geostationary orbit. The BMI is sky-high and could stay that way for weeks or even months. But be aware: when the BMI starts its fall, prepare for re-entry to earth’s atmosphere.
It can get bumpy and hot. But how sweet it is to come back. The best stock opportunities tend to come in the fall to earth.