
Best Oversold Indicator
Most holiday weeks the stock market is quiet. Professional traders step away from the screens.
But in 2021, there’s reason to have cheer. Our best oversold indicator triggered on Monday.
December has been a wild month for markets to say the least. Small-caps went into a tailspin, sending the Big Money Index nosediving. Many stocks were getting oversold.
I even suggested a playbook back then: if you’re bold, start dipping toes and if you’re a trader wait 2-3 weeks for an oversold signal.
Now, initially I was thinking there was the possibility of the BMI reaching oversold. That didn’t happen. Something else did.
On Monday, there was a major datapoint indicating a relief rally was coming. Beautifully, it lined up with Alec’s post, No guts no glory. The MAPsignals team believes in buying dips!
As I’ll show you, Monday’s selloff was enough to trigger our best oversold indicator. Yep, days when selling is large enough, chances are we rally in the short-term.
This doesn’t mean the all-clear signal is here. What it means is there are oversold days that you’ll want to pay attention to going forward.
Let’s get to it.
Big Money Index Reaches Near-term Lows
Last week, I had a ton of fun writing the best oversold Stocks to buy. In the BMI section, I noted how the BMI is trying to bottom out.
There was just enough buying to mute the bears. It’s still hanging around the 40% level:
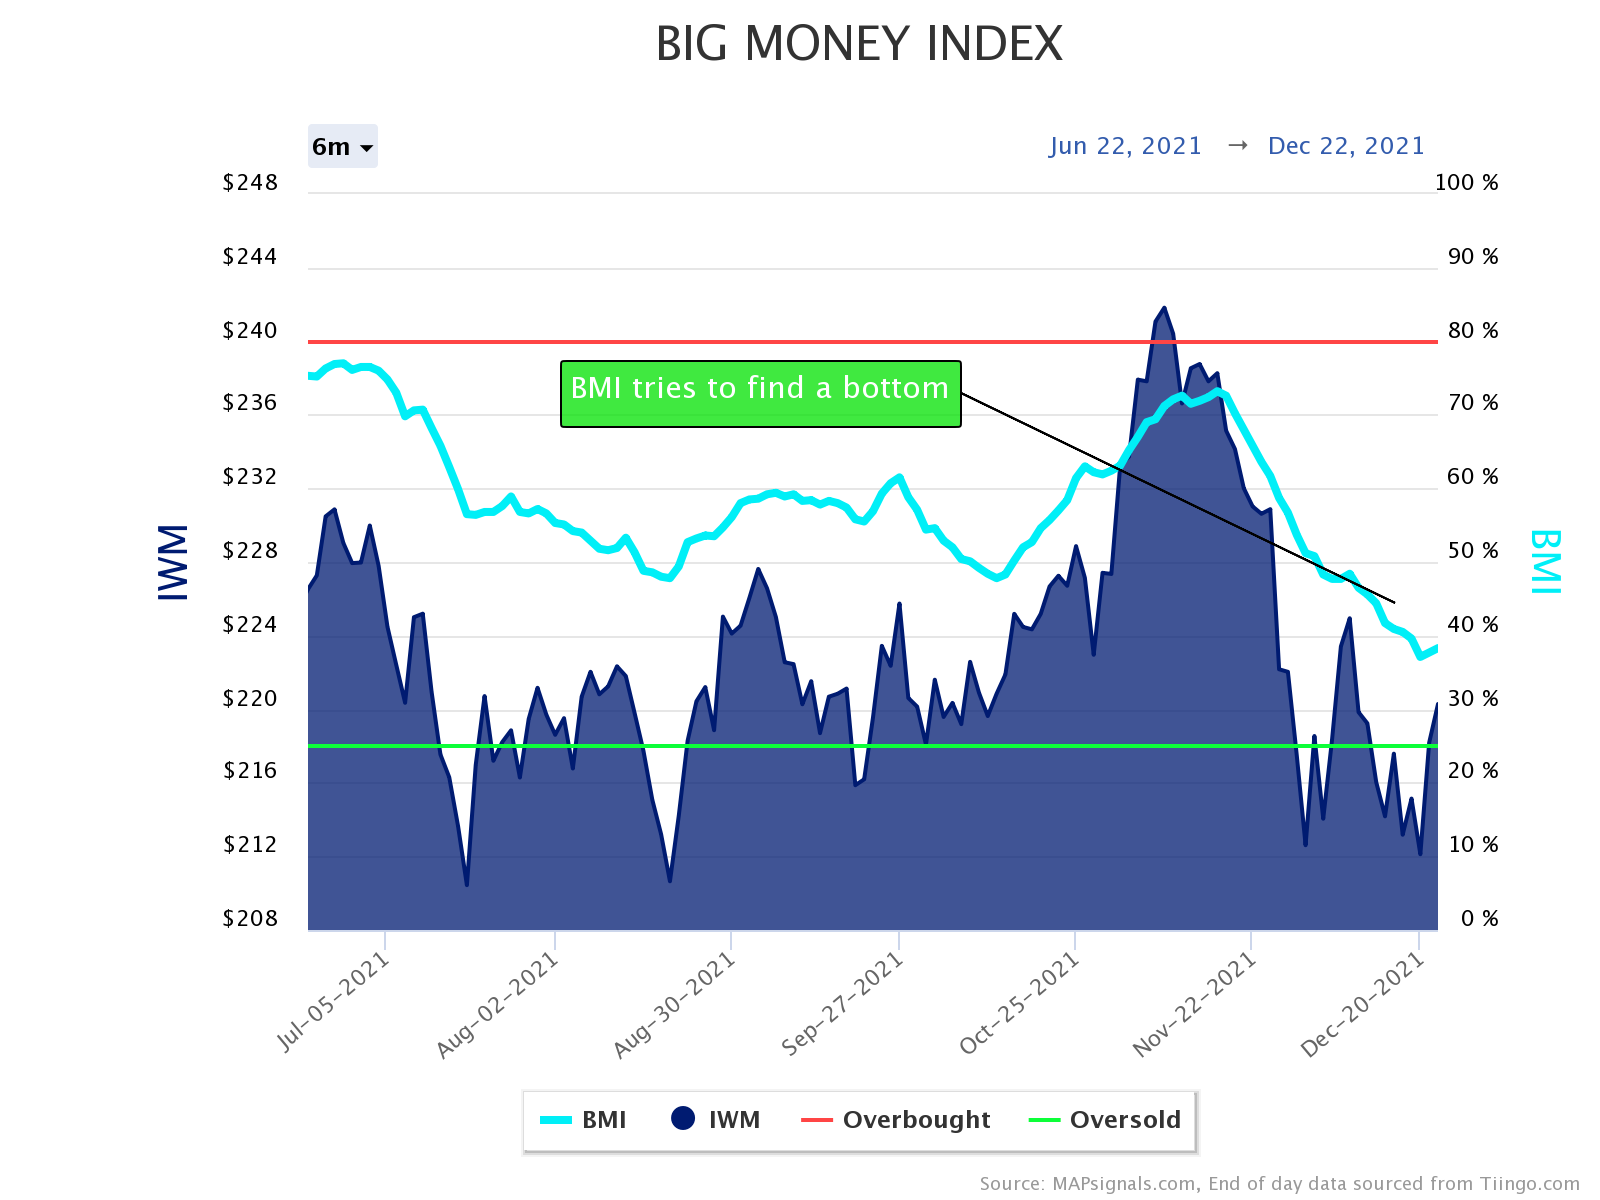
And since the BMI is created on a 25-day moving average of buys and sells, it can have a lag effect if the data shifts. But in general, it moves slow and decelerates when the rate of selling declines.
Think of it as measuring the velocity of buying and selling in stocks.
But oftentimes, what happens on a daily basis is more important than the 25-day trend…at least near-term. There was a clue that markets were gearing for a relief rally after Monday’s action.
This brings me to our best oversold indicator. Stay with me.
Best Oversold Indicator
When you look at data every day, what’s important is to notice extreme areas. The stock market reveals powerful exhaustion areas.
Many times, the best oversold indicator is when stock selling reaches prior reversion points. And the latest big sell day was on Monday – a holiday week!
Below is our daily Big Money Stock Buys and Sells chart. There are 2 things I want to point out about it:
- It’ll be renamed soon because the current title gives it no justice!
- It spots oversold days ripe for a bounce.
I’ve outlined Monday’s sell data and prior days (post-pandemic) with similar action.
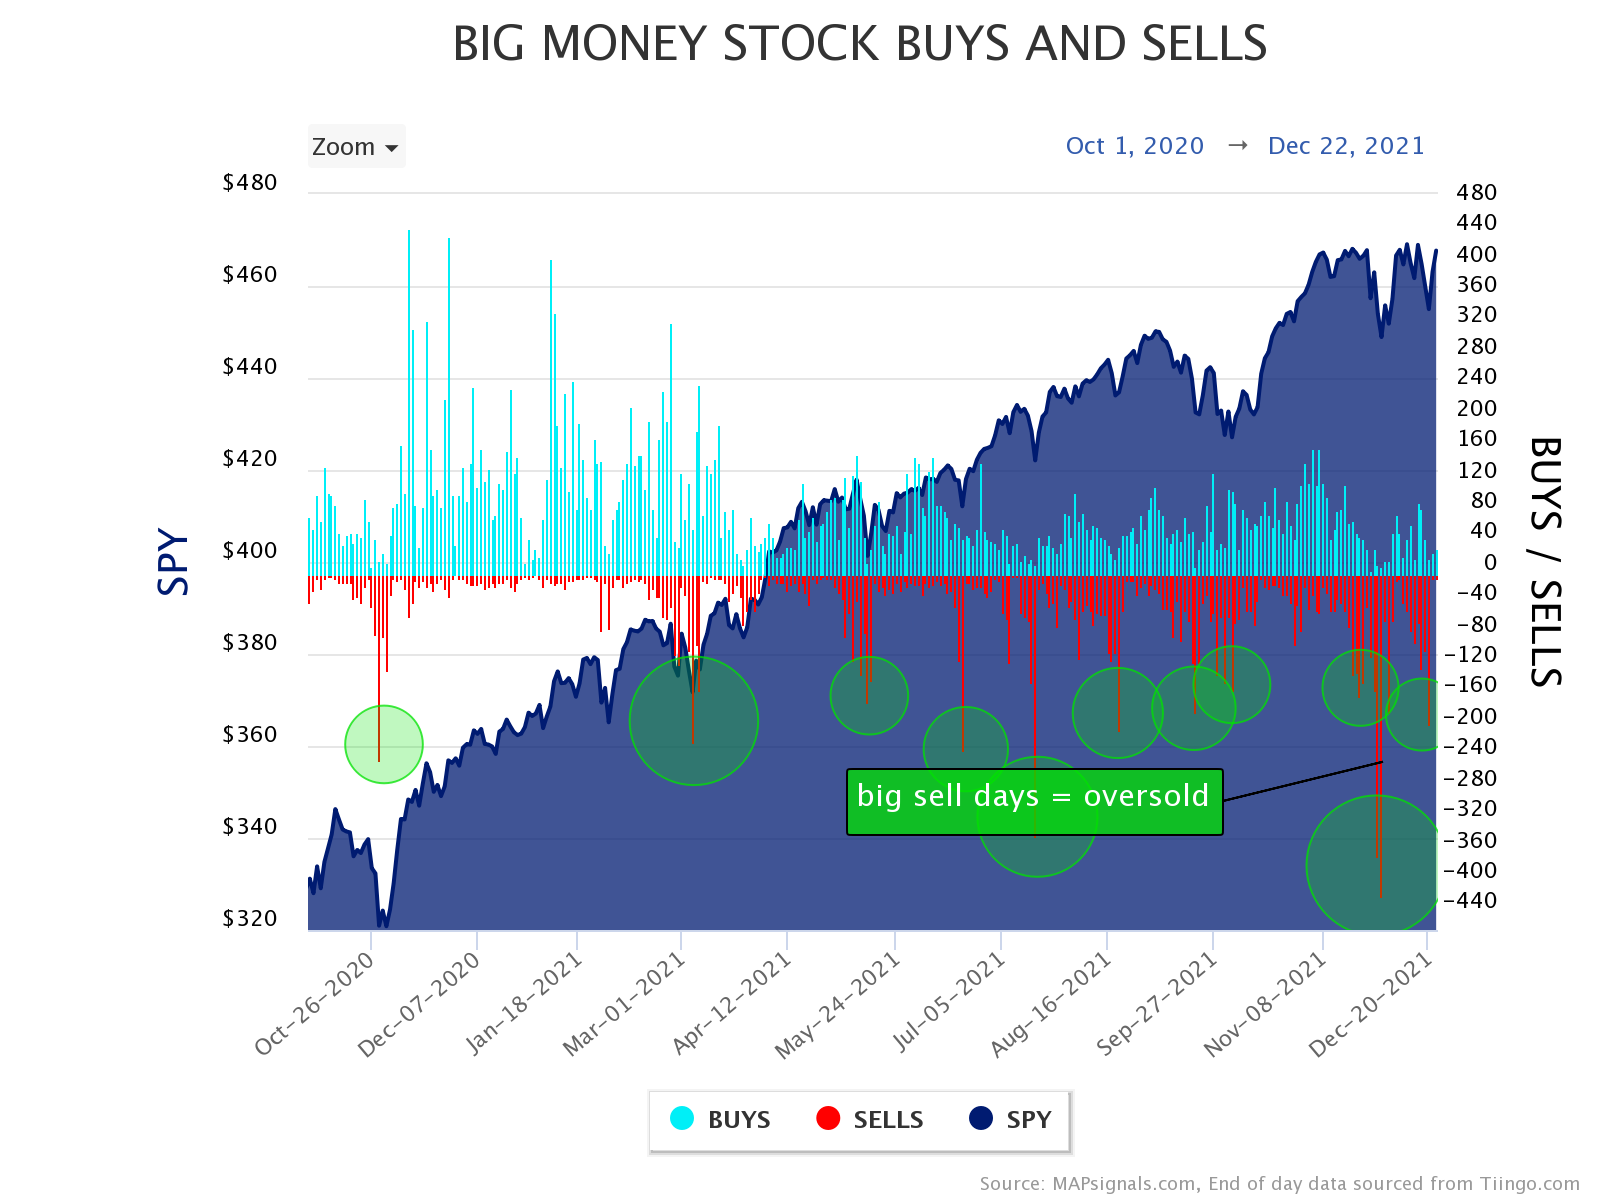
Notice anything? If you look closely, markets tend to bounce in a big way right after big sell days. And if you don’t believe me, look at this.
Below are each of those big sell days and the forward 1 day and 1 week performance of the S&P 500 (SPY ETF). It’s mega JUICE.
I’ve included the daily tally of stocks seeing big volumes alongside the number of those stocks getting sold. Anytime ~15%+ of the universe gets sold, it’s the best oversold indicator:
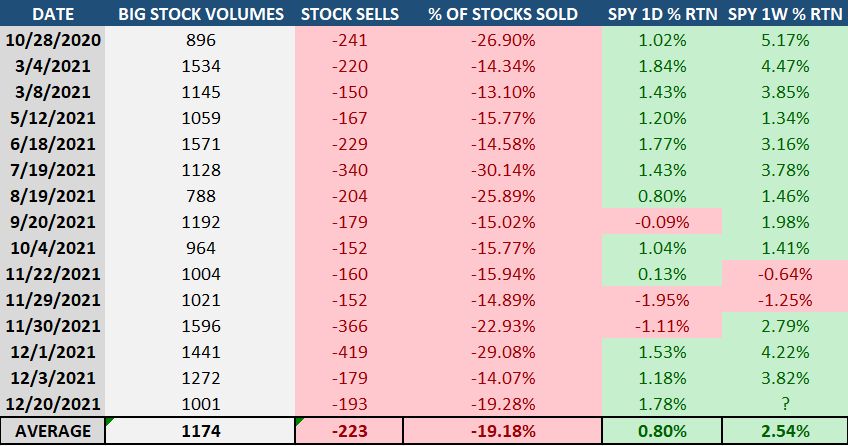
Source: MAPsignals, FactSet
As you can see, the average 1-day gain for SPY after a big sell day is +80bps. Even more incredible, the average 1-week gain is +2.54%!
Look, sometimes Christmas comes early for stocks. And if you’re looking for the best ones in our data, look no further than the MAP 50 list. It includes the top stocks getting the most Big Money the past 6-months.
Many of those names got battered during the latest small-cap pullback.
I believe opportunity is knocking.
Let’s wrap this up:
Here’s the bottom line: The week of Christmas is usually quiet for stocks. But this year there’s reason for hope. Monday triggered our best oversold indicator.
In 2022, if you’re looking for stock market research with an edge, consider signing up for a MAPsignals subscription. Don’t follow the news, follow the Big Money.
Happy holidays everyone!
Lastly, check out our latest Big Money Series video: How Big Investors Trade Index Additions. For years we’ve noticed how stocks that get added to an index usually see buy activity beforehand.
In this video we chat about it.
Enjoy!
Make sure to like and subscribe to our YouTube channel here!
Also, you can find our other videos here.