
Big Money Index Is Nosediving
There is one story to tell today.
The Big Money Index is nosediving.
Let’s cut to the chase. Headlines are swirling about 2 risks to the market: the omicron variant and Fed taper talk. And while some headlines warrant focus, at MAPsignals, I’ve learned to pay less attention to news…I realized long ago that it rarely amounts to sound investment advice.
I found my home in data. More often than not, it tells the real story. And today’s message is blunt: Selling in stocks is the highest since the pandemic low.
In the past 2 weeks, our data has flipped…on a dime.
Extremes are here. There’s immense pain and carnage. Portfolio managers are de-risking.
And I’ll show you all of this. Today’s charts are the most important you’ll see. And as scary as all of it is, there are green shoots to look forward to in the coming weeks.
Just like there was a game plan back in early March 2020, and we made our biggest bullish call ever on March 19th, 2020 – I have one today.
Let’s do this.
Big Money Index Is Nosediving
We need to start from the top and work our way down. The Big Money Index is nosediving – in other words, it’s deteriorating at an alarming pace.
Below I’ve outlined this plummet and how on the surface it looks eerily similar to July’s selloff…but hang with me:
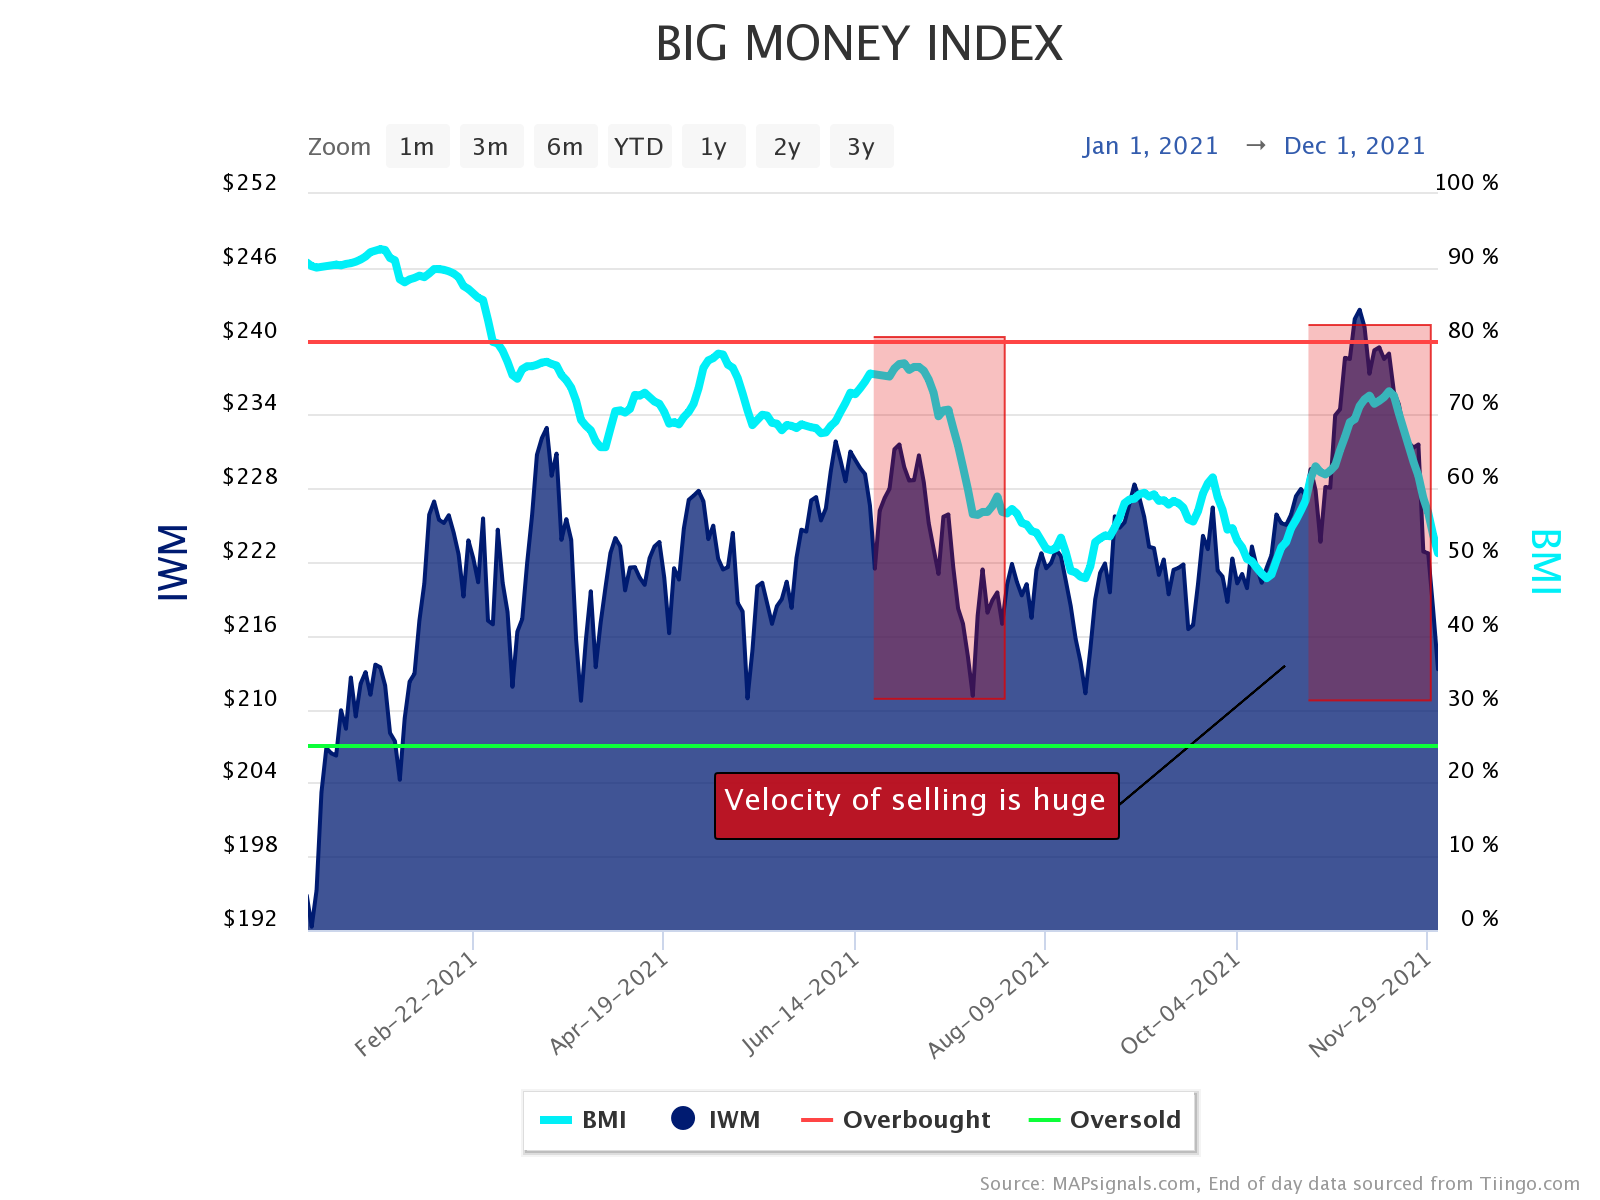
The level of selling is much higher than July. And before we look at sell signals, I want to backup for a second.
Each day we track the number of stocks & ETFs that trade in a big way. It’s important because it’s another datapoint to add to the narrative. I rarely bring this chart out, but today it needs a mention.
Below shows the Big Money Trading Activity chart. These are the daily counts of tickers seeing unusual trading. Our universe size is 1400 – 1600 stocks depending on the environment.
Look how the last 2 days have seen a max-out in terms of big trading counts. And I also highlighted July’s trading counts:
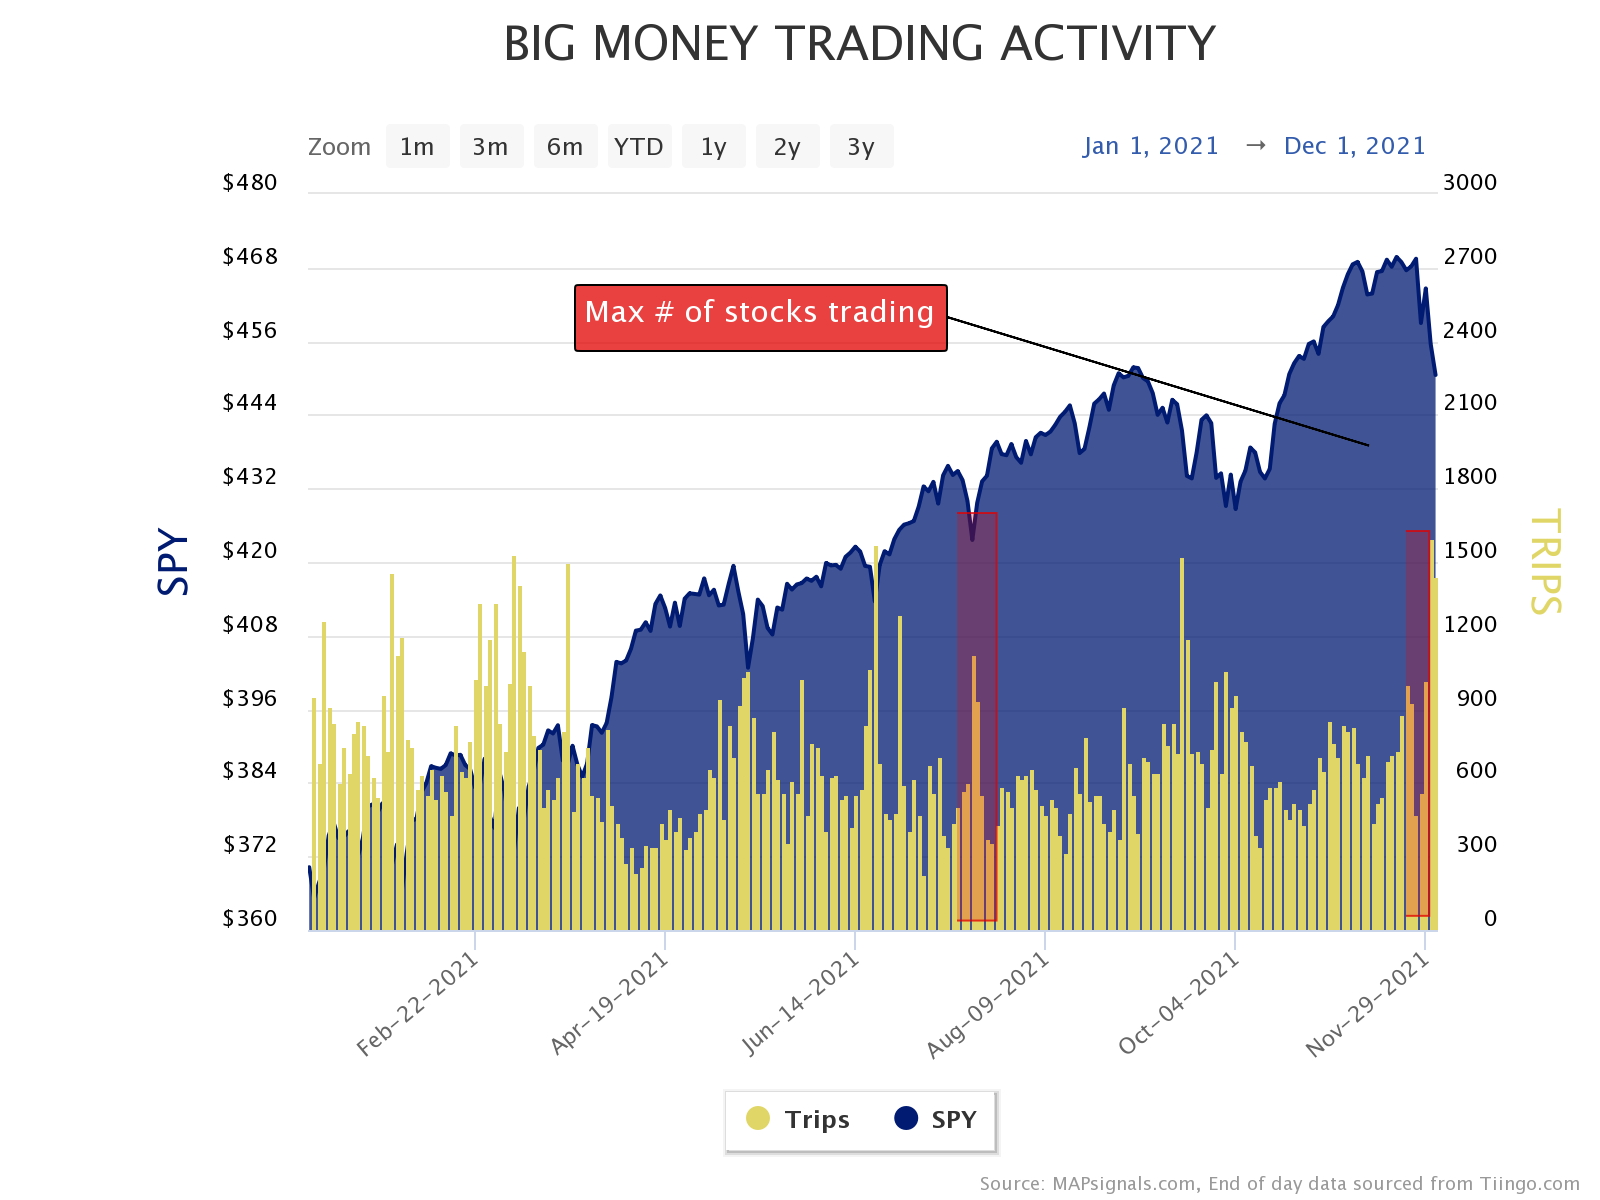
Guys and gals, the current level of trading activity is magnitudes higher than July’s. Here’s the same look at trading levels going back to the pandemic:
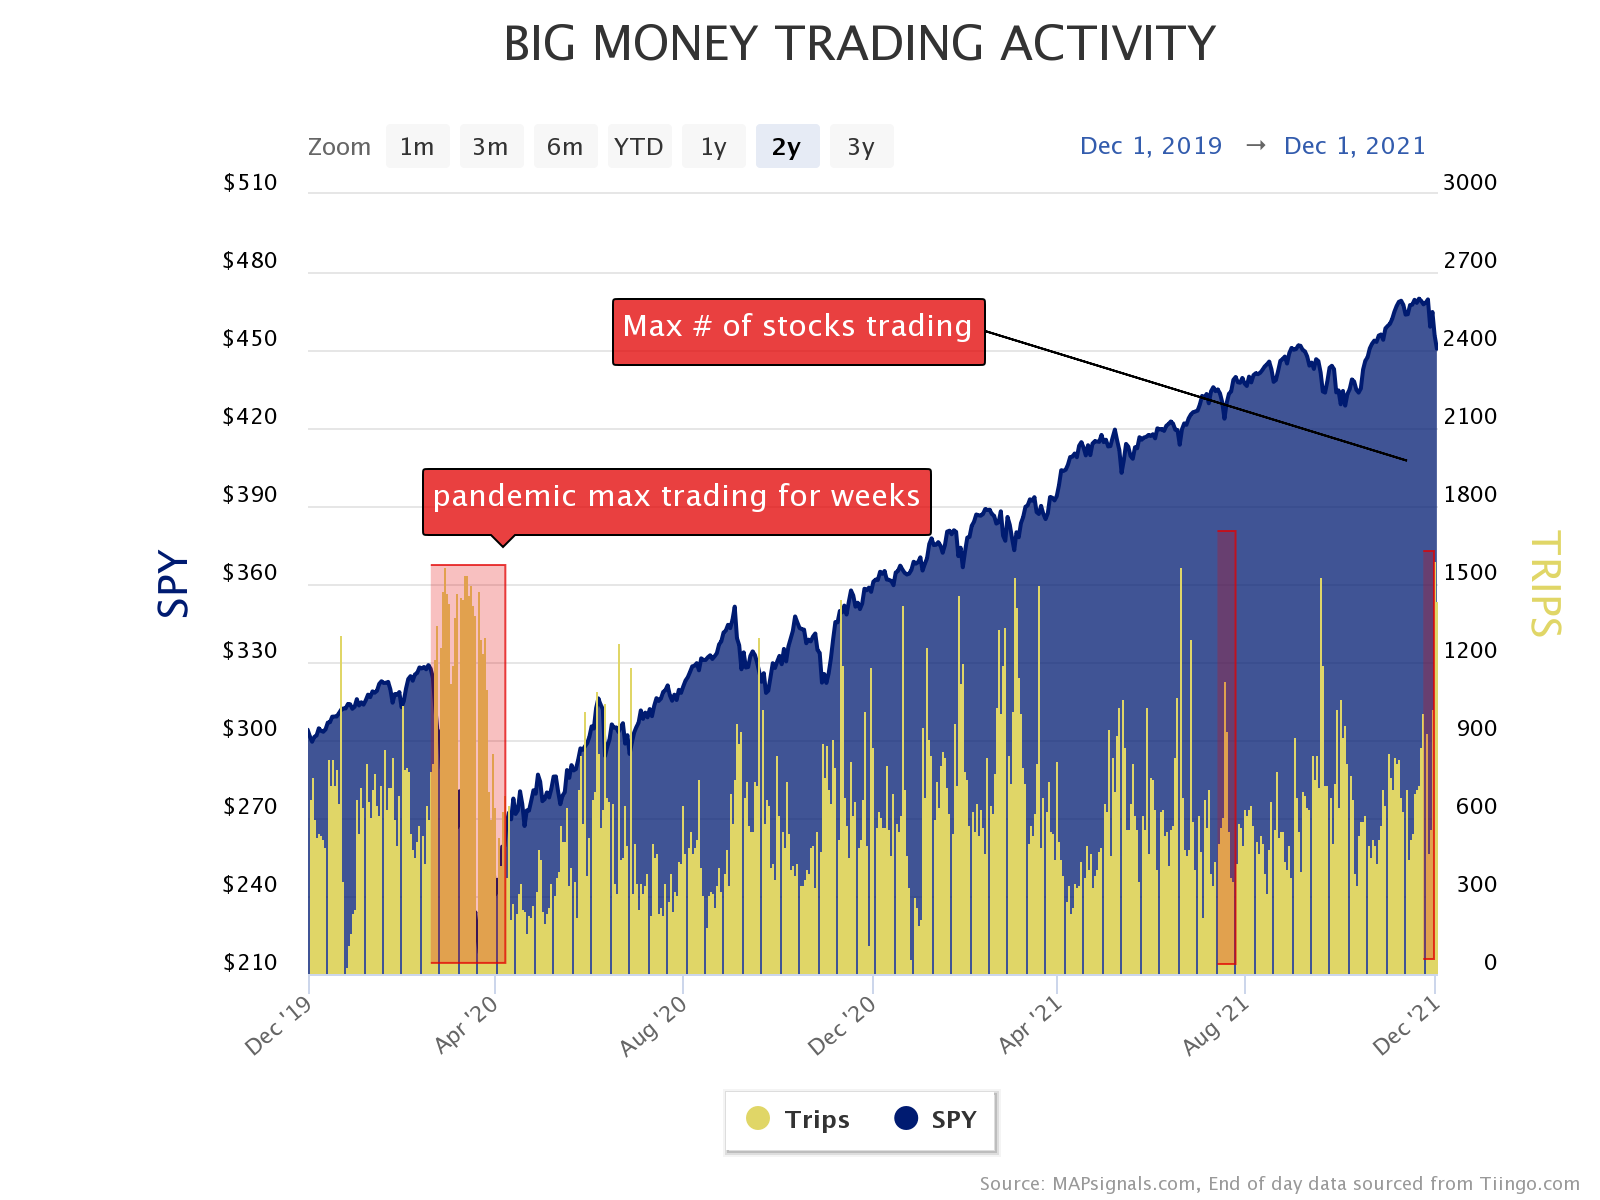
There is a monster wave of selling hitting stocks. This is why the Big Money Index is nosediving. And when trading action is high, alongside a nasty pullback – stock selling is off the charts.
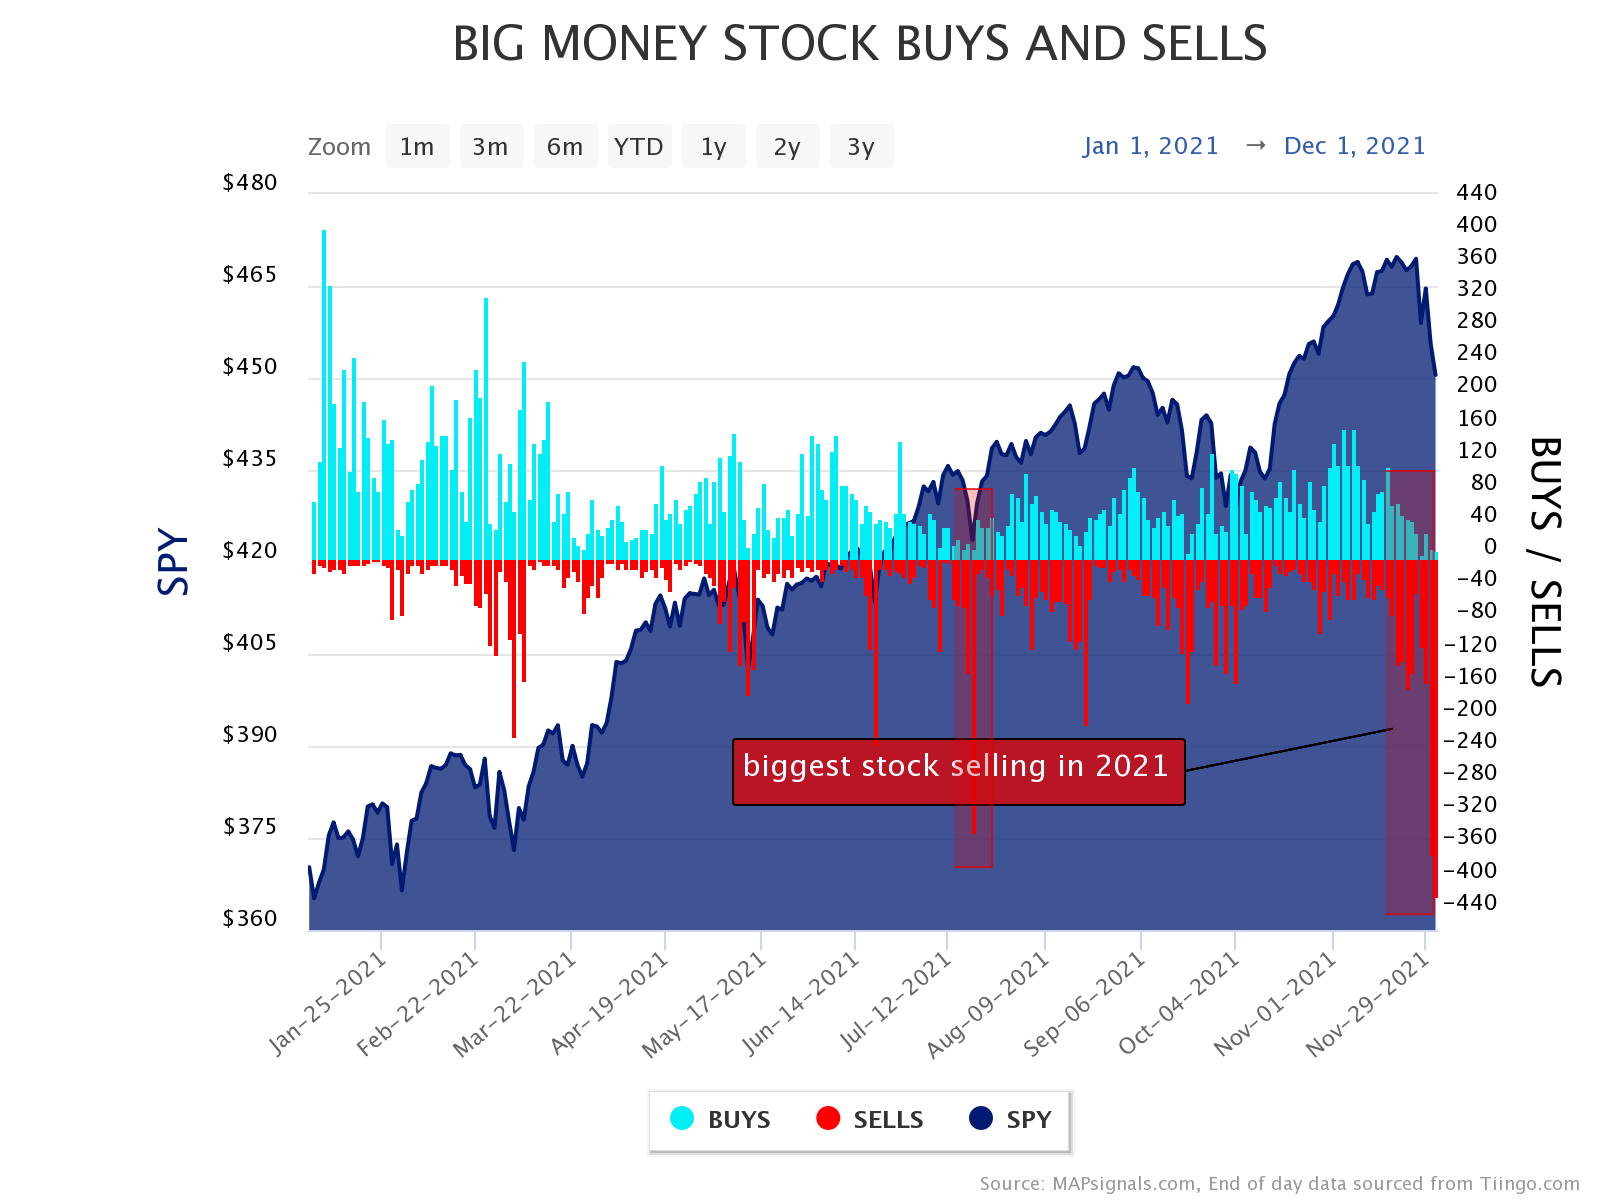
Tuesday and Wednesday saw the biggest selling in stocks since the pandemic low. Below is our Big Money Stock Buys and Sells chart. The red bars are sellers. Blue sticks are buyers.
This chart compares this week’s selling to July’s selloff. It’s more intense now vs. then:
In fact, it’s the most selling seen since the pandemic rout in March 2020. But, there’s no comparison today to what was seen then. Look:
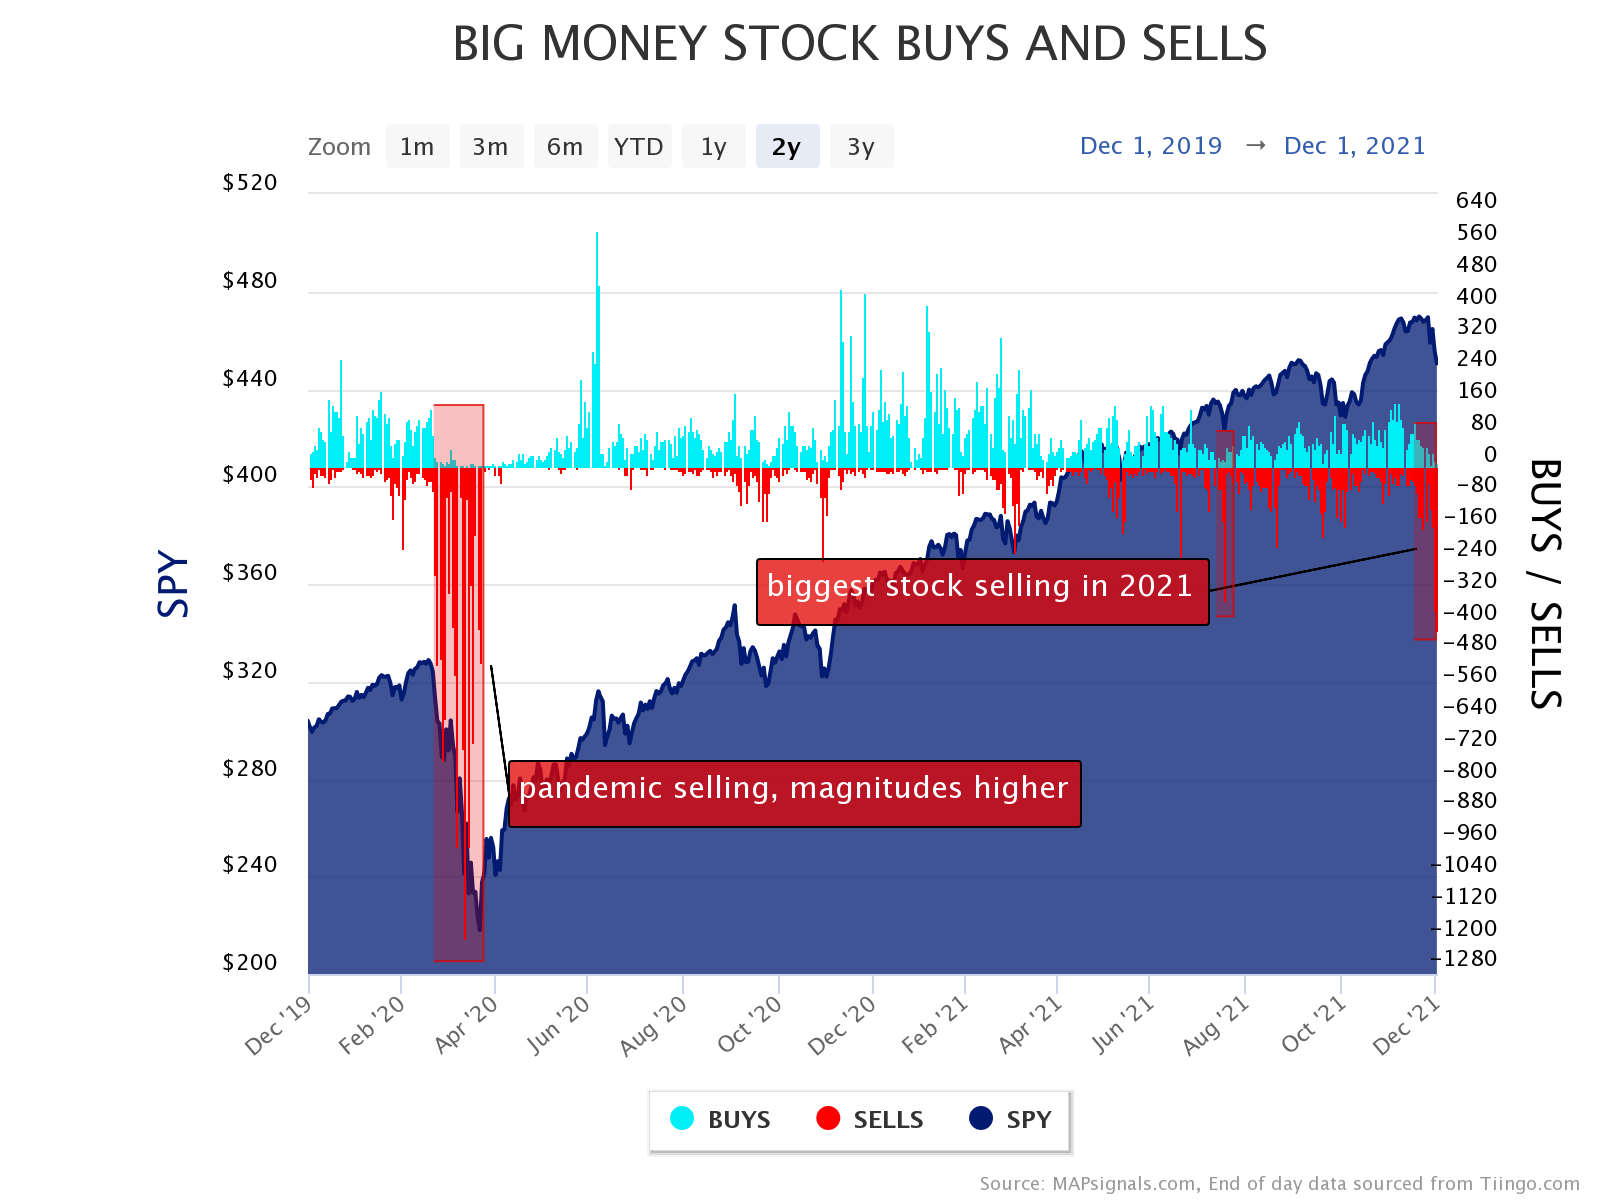
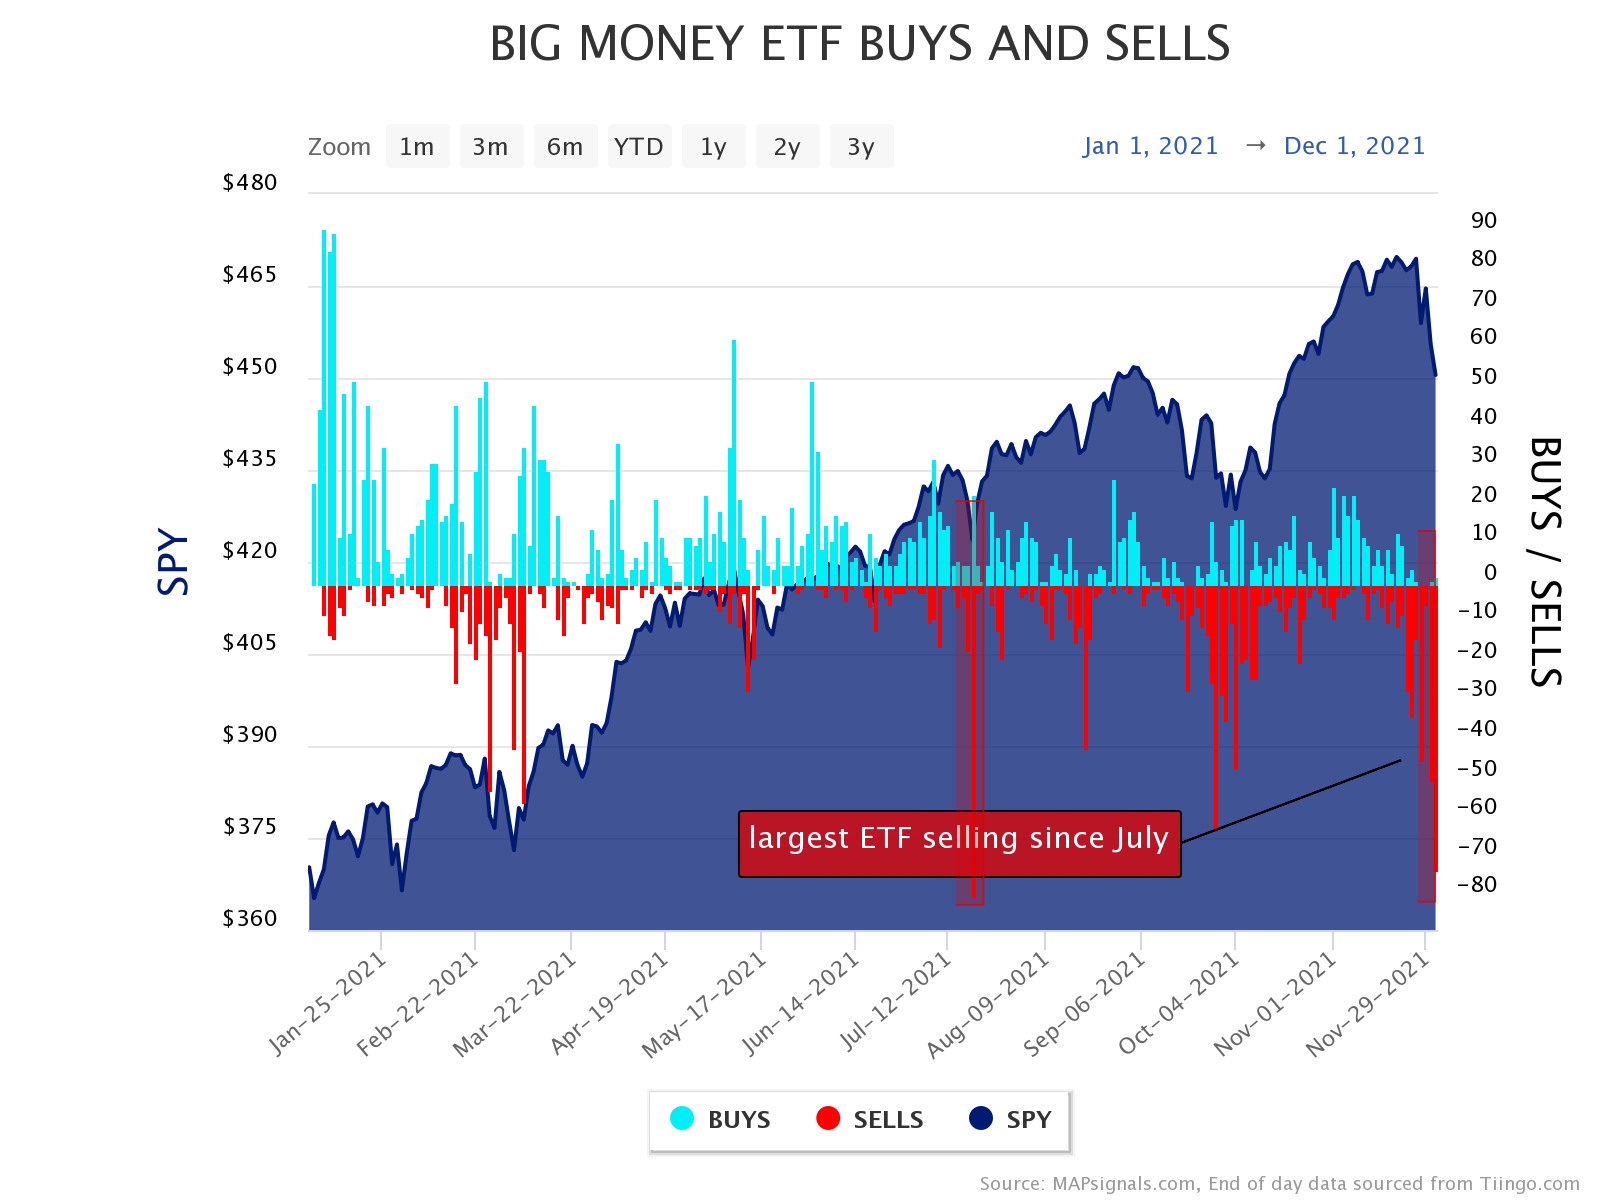
Now we know exactly why the Big Money Index is nosediving. Let’s now round this section out and look at ETFs.
Below shows how this week has the most ETF sell signals since July:
So, as you can see, it’s dire out there. Anyone long stocks is feeling the heat. And this is where my tone is about to change. The million-dollar question is “How do investors play the coming weeks?”
I’ll tell you.
How To Play The December 2021 Selloff
If you’re a diehard bull, you wait for rough patches to scoop stocks on sale. Now is no different. Fear is not a strategy.
Many stocks are oversold. Dipping toes on high-quality beat-up names is a great idea when your hold time is years. That’s what I’ll be doing in the coming days and weeks. Prior Big Money favorites can be found on our MAP 50 lists.
Pick your spots. I always advocate to buy quality stocks on dips. I’ll be practicing what I preach.
Be patient and proactive at the same time.
Finally, if you’re more of a trader, here’s my advice for you. Periods like now is when MAPsignals shines. Eventually selling will slow and stocks will rise like a phoenix from the ashes.
The Big Money Index hasn’t gone oversold since March 2020. That’s our strongest buy signal ever. I made a decision long ago to always buy when we reach the green zone. It’s a gift.
If our data continues to deteriorate at this rate, it’ll take 2 – 3 weeks to get there. Just in time for the Santa rally. And our present to you will be another list of stocks set to explode higher, like the ones we sent the last time we were oversold.
Let’s wrap this up.
Here’s the bottom line: The Big Money Index is nosediving. Selling in stocks is the highest it’s been since the pandemic. Long-term bulls should use this pullback to pick your spots. Many stocks are oversold.
If selling continues at this pace, look for our rare oversold signal to trigger in 2-3 weeks…just in time for the holidays.
BUT if our data signals slowing selling…the toe-dippers will get the glory.
Hang in there folks!
***Finally, check out our latest video: Best ETFs for December 2021. Jason always sees the glass half full and when it comes to outlier stocks, you should too!
Make sure to follow our YouTube channel here so you never miss any of our videos.