
Big Money Index Approaches Oversold
Stocks keep getting sold. Many companies are in a bear market.
As the Big Money Index approaches oversold levels, what does it mean for stocks going forward? I went back in our data to help answer that question.
Last week I gave the warning that buyers disappeared in our data. And after another week of signals rolled in, that theme hasn’t shifted.
And there’s the possibility that we’ll trigger oversold in the coming weeks. As terrible as that sounds at first glance, it’s actually our most bullish indicator.
Let me show you why.
Big Money Index Approaches Oversold
For most of 2022, the market has acted like a washing machine. One week, growth stocks get sold while defensive areas thrive. Another week that theme reverses, etc. It’s been challenging to spot long-lasting trends.
When there’s a tug-of-war under the market’s surface, the BMI becomes rangebound: unable to reach any extreme readings. But starting on April 21st, a new theme emerged. Buyers vanished, causing the Big Money Index to fall hard.
In 2 weeks, the BMI fell from 71% to 42%. That’s a violent move lower:
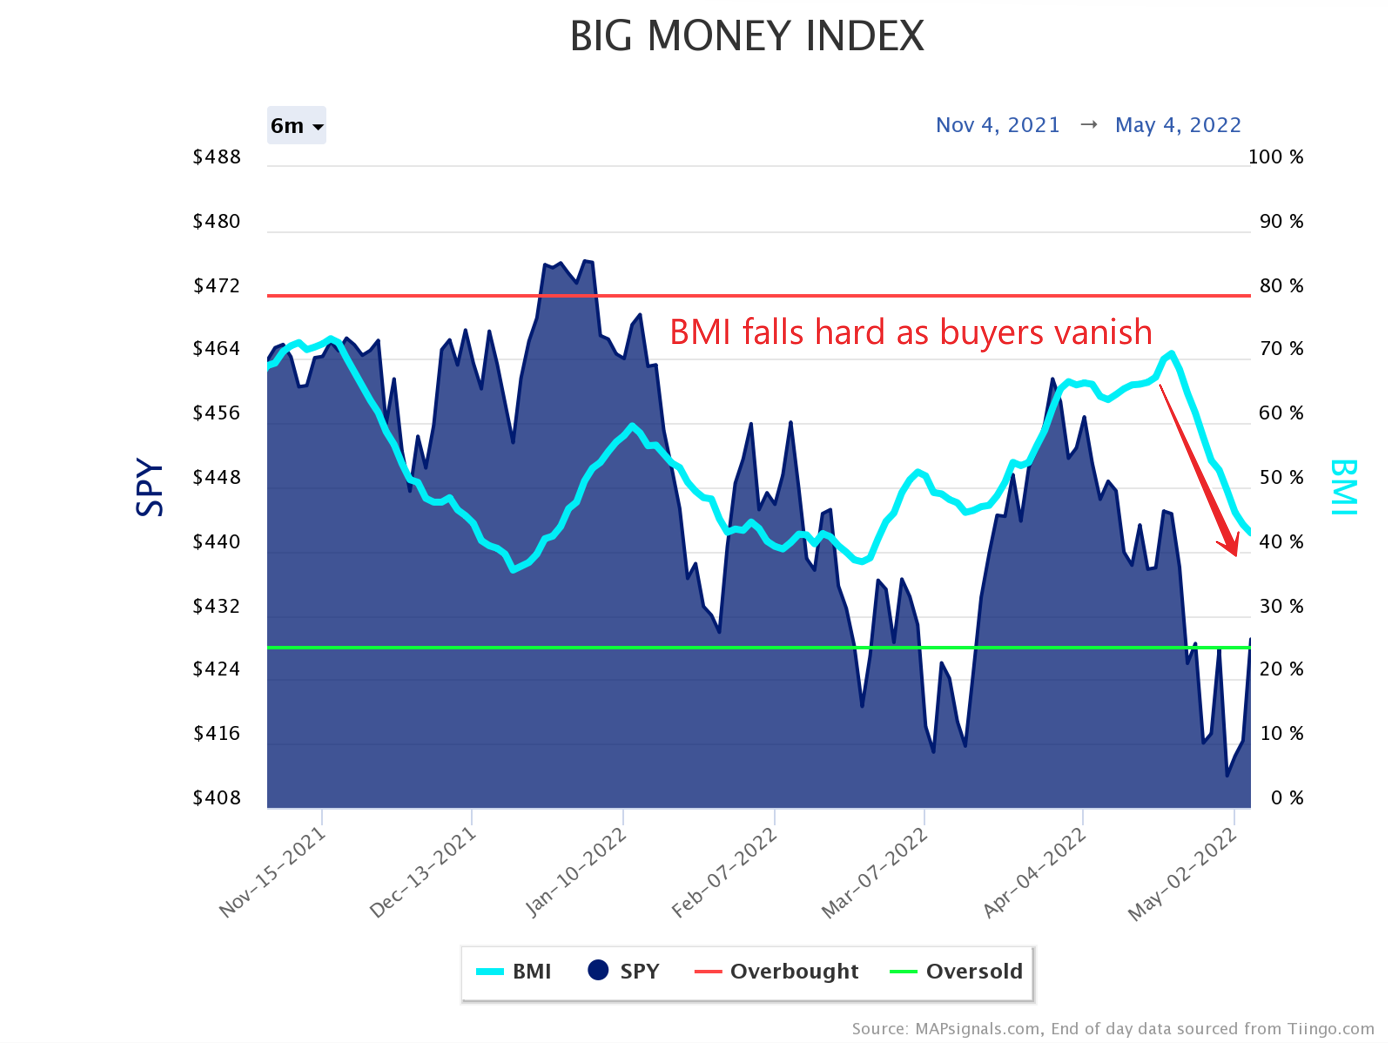
Above you can see how intense the fall has been. It’s simply due to near-zero leadership. Using Wall Street talk, we’re witnessing a “correlation of 1 market.” That simply means that stocks are acting similar, rather than rotational.
When most stocks are getting sold like now, correlation is high. Below you’ll observe this shift:
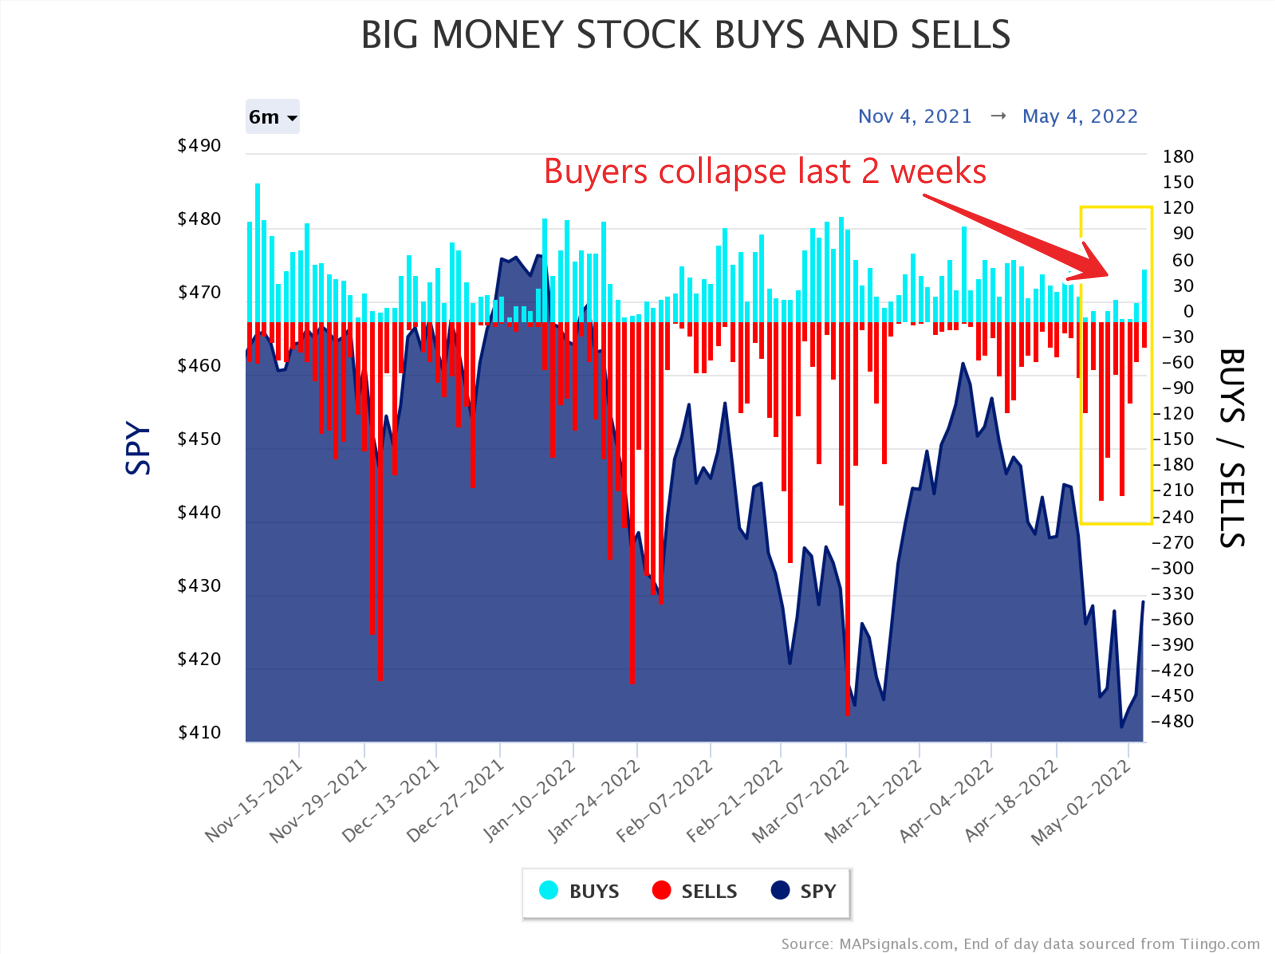
The lack of buyers is the simple reason the BMI is in free fall. The current reading is 42%. That means that the 25-day moving average of buys to sells represents 42% buyers and 58% sellers. To reach oversold, the ratio of buyers would need to fall to 25%.
At the current rate, it’ll take another 2-3 weeks of similar action to get there. Yep, a rough few weeks is the soonest we could reach the rare green zone.
If you’re curious what oversold triggers look like in recent history, check it out. I’ve noted the prior 6 instances when the BMI breached 25%. The green horizontal line represents extreme selling that rarely lasts.
The latest one was March 19th, 2020:
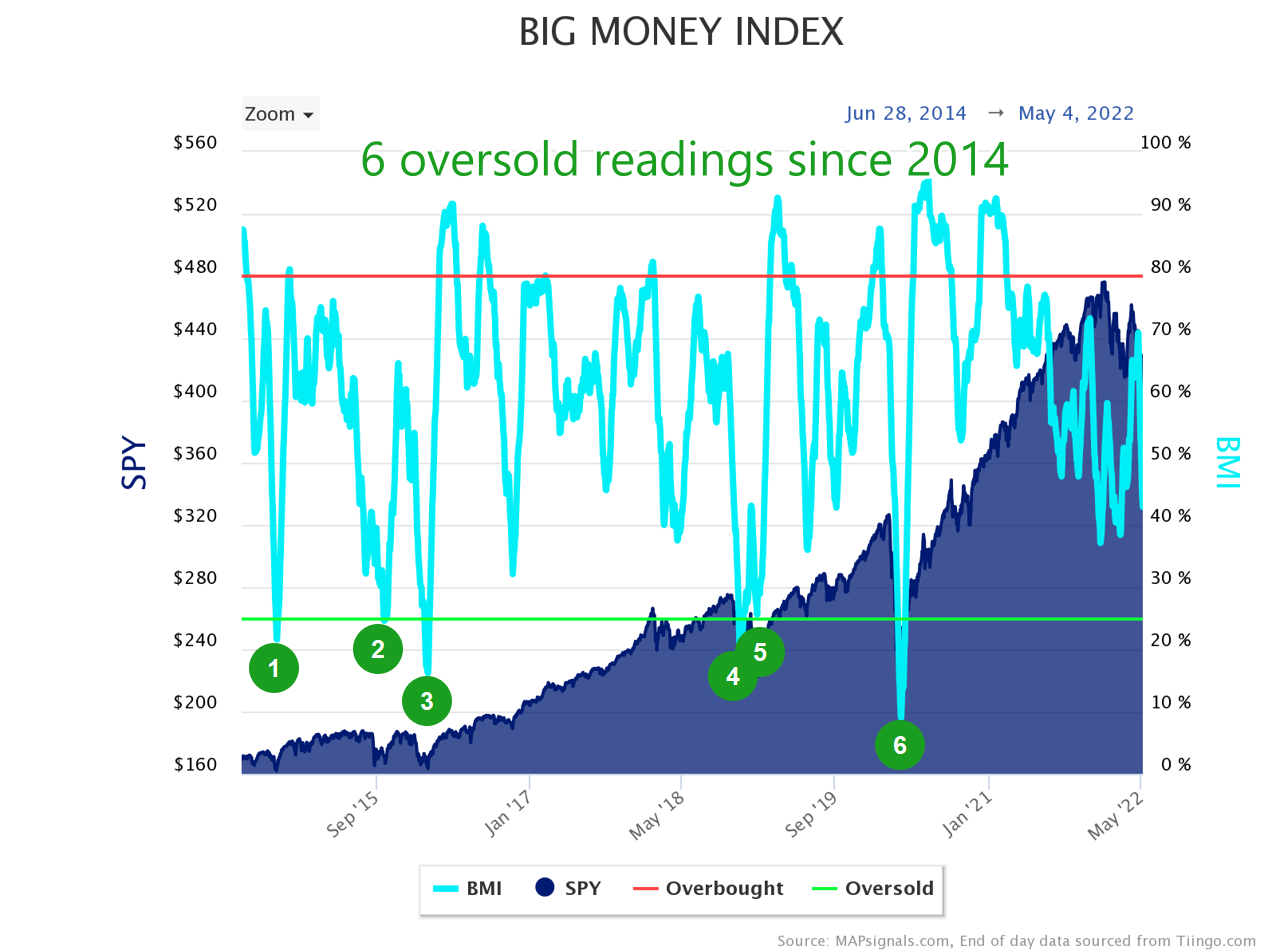
One look above and you should notice a few things. First, it’s a rare occurrence to hit oversold. Only the nastiest selloffs reach this ugly climax. The pandemic collapse 2 years ago gives you an idea of what it takes to get there.
Second, these epic pullbacks, while excruciating to sit through, tend to be amazing buy opportunities. Just using the ole eyeball test, the 6 green bubbles appear at or near lows in markets.
Third, typically an overbought reading happens soon after going oversold. Yep, stocks tend to rocket higher in a monster way.
I did a bit more digging to find out what we can expect as the Big Money Index approaches oversold levels. History shows it’s a good time to get the buy tickets out.
Let’s look at that now.
Historical Returns of an Oversold Big Money Index
I’ll level with you. Most know me as always being positive and bullish on stocks over the long-term. That’s because I’ve benefited personally in my own accounts. As I see it, owning great companies can multiply your wealth like few things on Earth.
But an oversold BMI has the power to turbocharge returns. They’re super rare, though. Since 1990, it’s happened only 20 times. Basically, they come around every 1.5 years on average.
Below I’ve outlined all instances. You’ll see the first day oversold triggered, how long it lasted, and the market trough afterwards. I’ve even included the periods that include recessions. Have a look:
(Click image to enlarge)
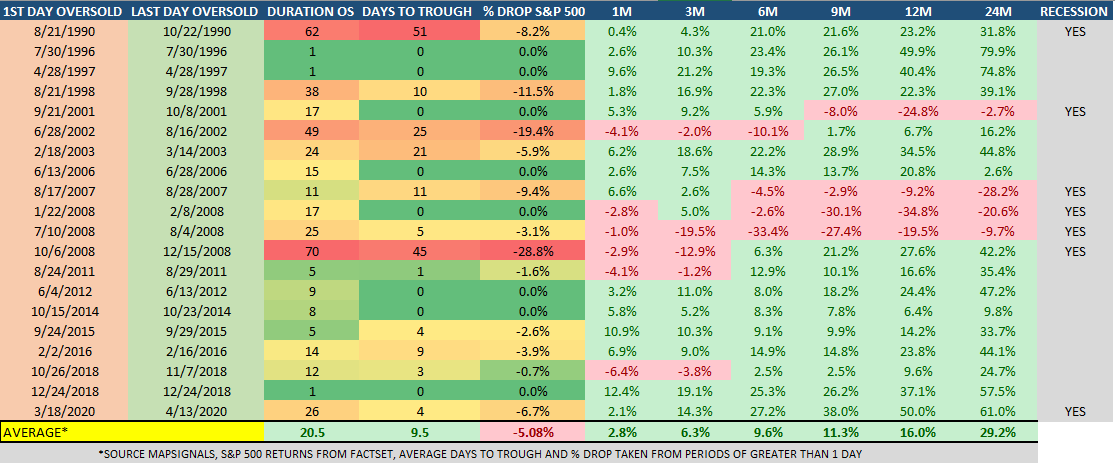
Now, that’s a lot of green! Out of 20 oversold periods, the average 6-month return for the S&P 500 is +9.6%. One year out the index climbs 16%. And 2-years out, it’s a blistering average gain of +29.2%!
Sure, there were a couple of very red periods like the Global Financial Crisis of 2008 and the 2001 pullback. But even with those results included, the potential rewards are off the charts.
Now look, I know the markets are tough right now. Plenty of my stocks are down, too. As I like to remind myself, “it happens.” But don’t give up. It won’t always be doldrums for stocks. I’m serious.
As the Big Money Index approaches oversold levels, view it as a massive long-term opportunity. As value investor Shelby Davis once said, “You make most of your money in a bear market; you just don’t realize it at the time.”
He’s right.
Let’s wrap up.
Here’s the bottom line: Buyers have been absent in our data for 2 weeks. The BMI is cratering. But as painful as selloffs are, they eventually pass. And in some rare instances, stock selling gets overdone.
As the Big Money Index approaches oversold conditions, focus on the opportunity. The average jump for the market 24 months later is nearly a 30% gain. That’s worth looking forward to.
I’m taking the time now and building a buy list. History shows it’s a smart bet.
If you’re looking to monitor the BMI the next few weeks, sign up for any subscription level here. All levels get access to our automated portal.