• Menu
  • Skip to right header navigation
  • Skip to main content
  • Skip to primary sidebar
  • Skip to footer

MAPsignals

We map big money.

  • Latest Insights
  • Power of MAP
    • MAP Products
    • MAP System
    • MAP White Papers
    • Videos & Interviews
  • Profit with MAP
  • About
    • About MAP
    • MAP Team
    • Authors
    • MAP System
    • MAP Products
    • Big Money Index
  • Members
    • Get Started With MAP
    • My MAP
    • Big Money Charts
    • MAP View
    • MAP View Options
    • MAP Top 20 Weekly
    • MAP 50
    • Member Updates
    • Platinum Updates
    • Members Only Posts
    • Performance
  • Portal

Big Money Index is Breaking Out

March 31, 2022 //  by Lucas Downey//  Leave a Comment

Focus on the bad news and you’ll find it.

Focus on the good news and you’ll see opportunity. The Big Money Index is breaking out.

Big Money Index is Breaking Out

There’s a lot of bad news out there. Literally every time I open social media, I’m bombarded with messages about how stocks are doomed. Yes, inflation is high and interest rates are climbing fast. I get it.

But, I’m an optimist. I choose to search for positive narratives. And as I’ll show you, there’s reason for hope.

You see, I’ve always found it to be more proactive following data rather than news, especially when it tells a different story than the headlines du jour.

Today, you’ll see a narrative of positivity. There’s a lot of buying going on. And hopefully, you’ll note the opportunity that I’m seeing.

Big Money Index is Breaking Out

Monster selloffs are often a fertile hunting ground for stock buyers. Just a few short weeks ago everything looked grim. The stock market selloff was off the charts.

My message then was to hang in there and not give up. Today we can see the Big Money Index not only took out it’s 2022 high, it’s at levels not seen since November:

Highest BMI since November | Big Money Index

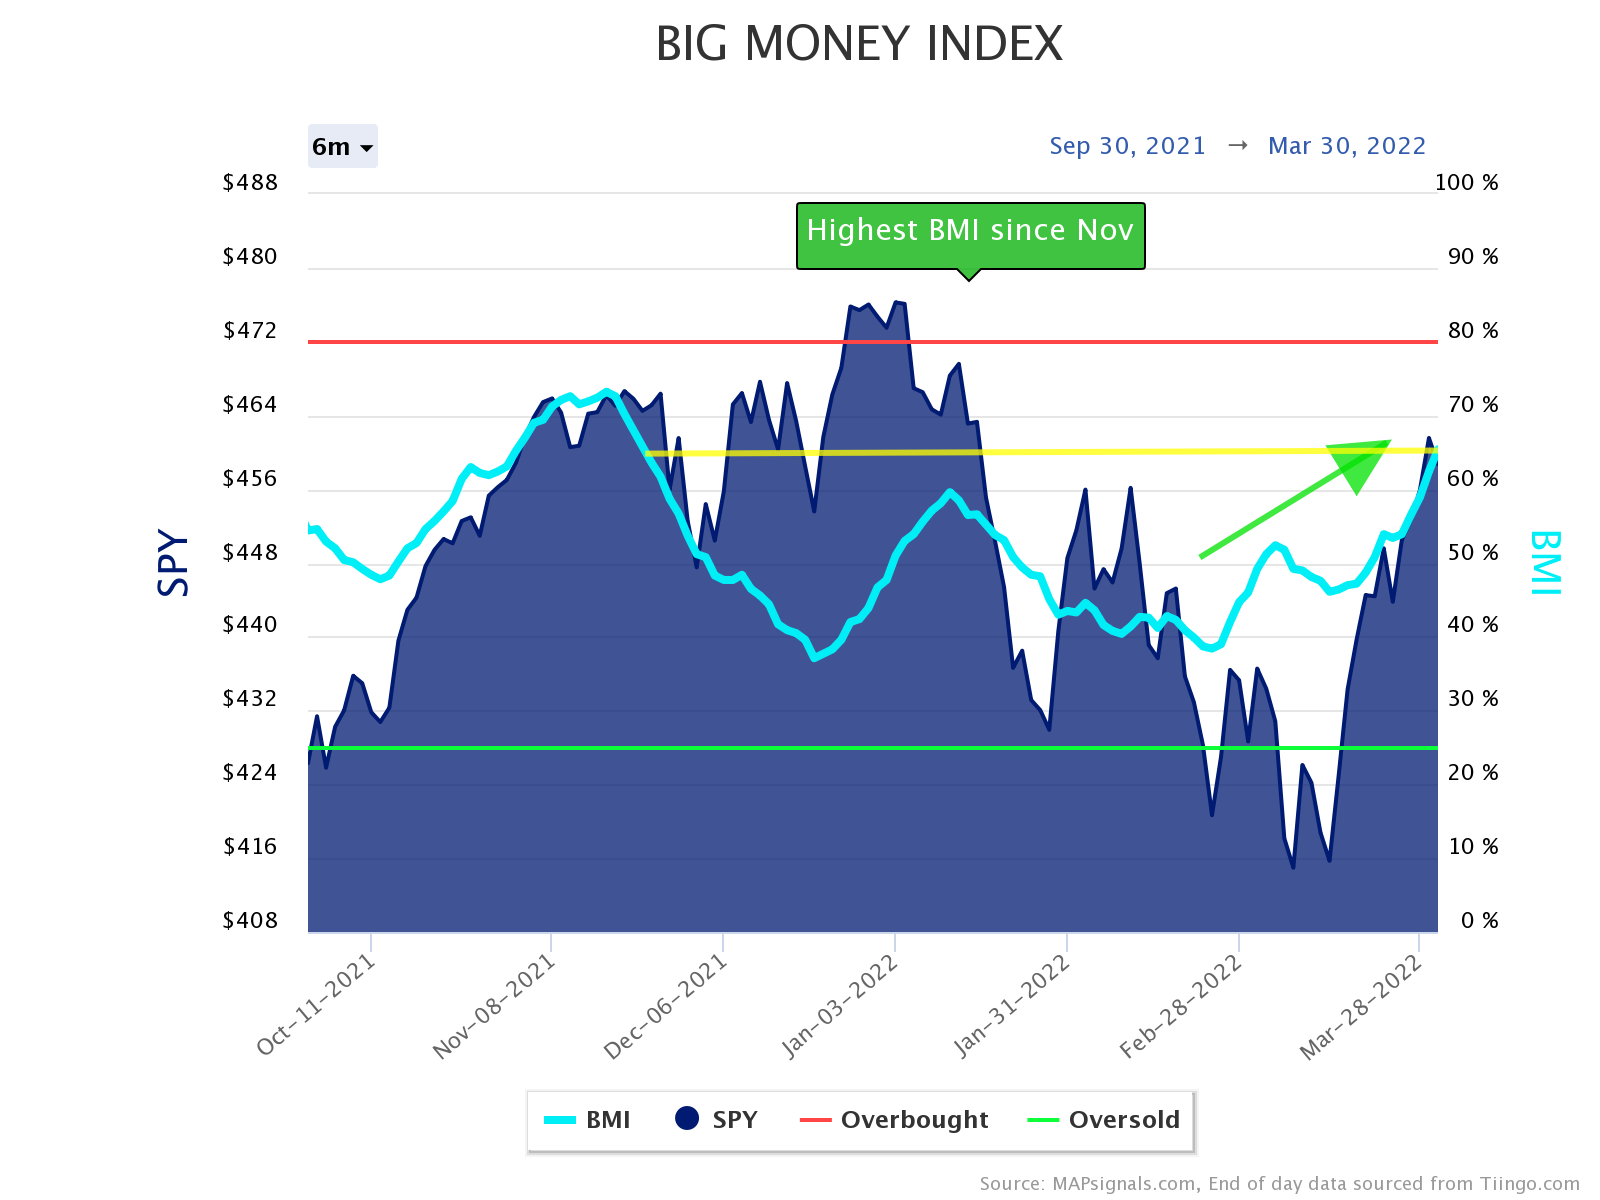
It just pierced 65% – a level last seen on November 22nd. And you may be curious what’s causing this huge ramp in the BMI. Well, take a look at how the immense selling has slowed.

big money stock buys and sells SPY

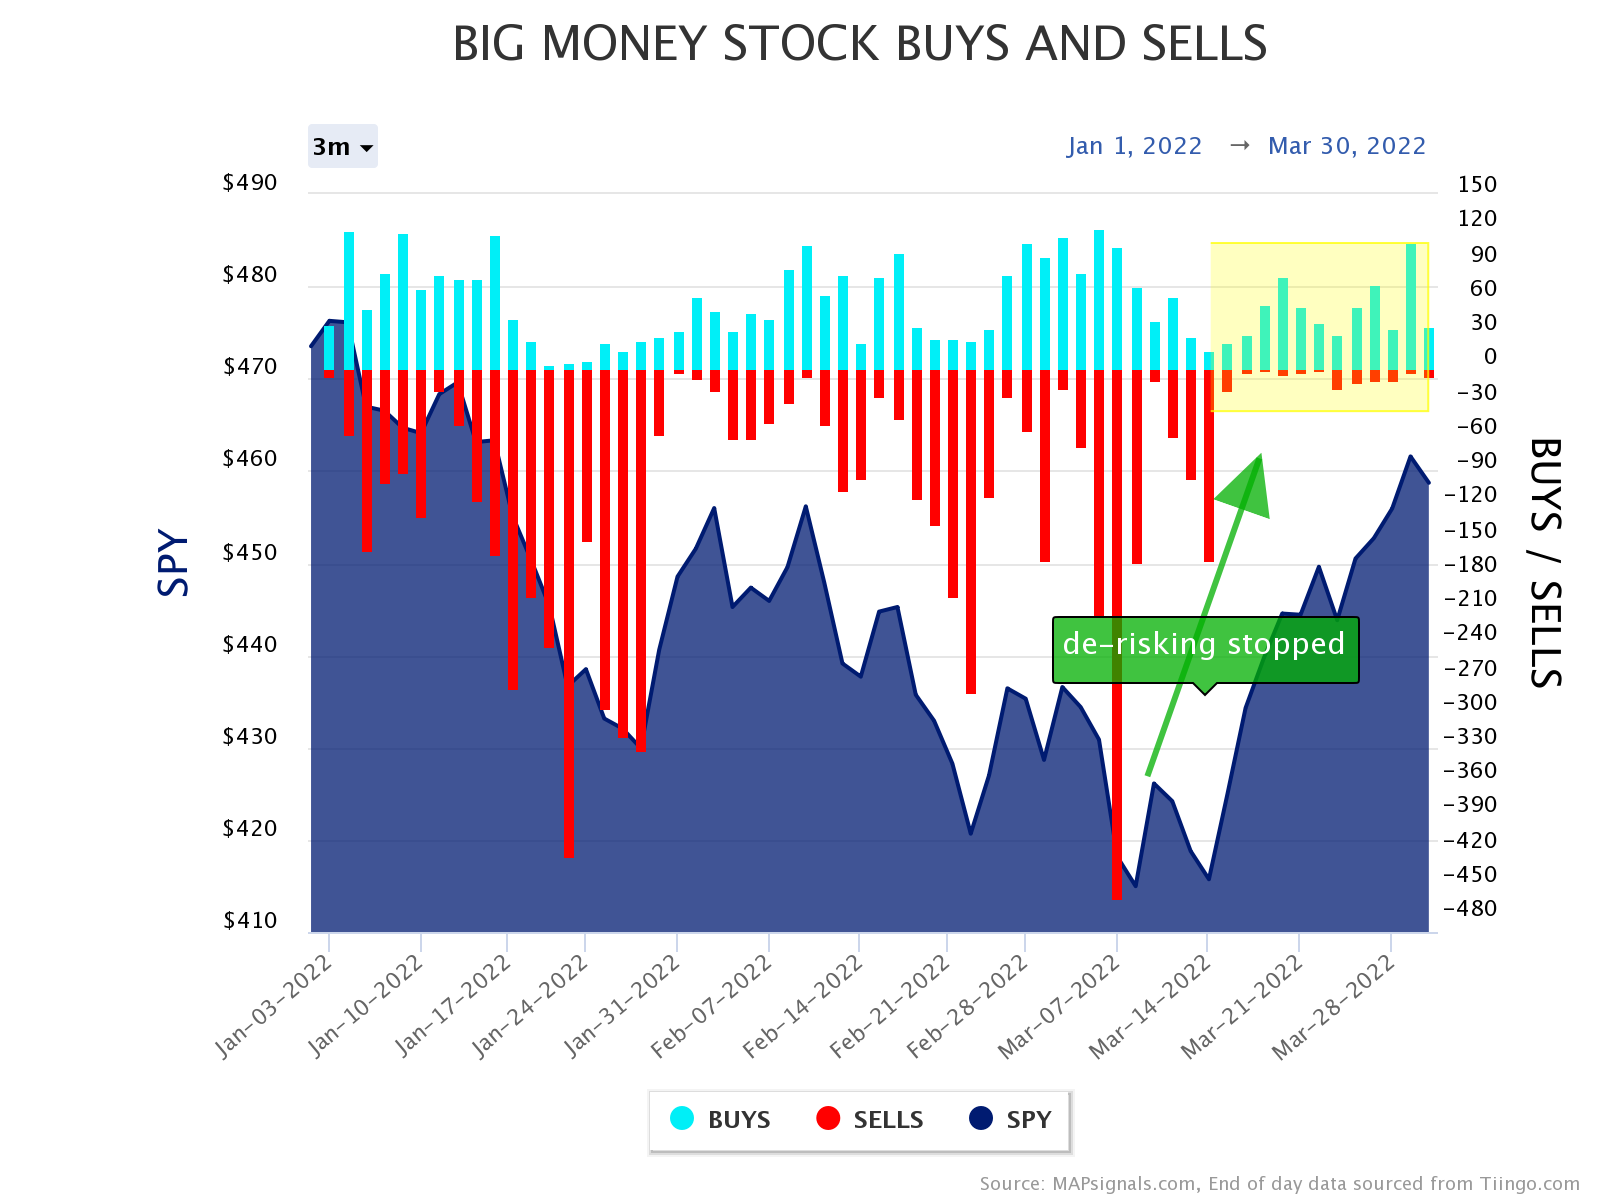
Selling effectively stopped. My educated guess is that forced selling and de-risking came to a halt. That of course, planted the seeds for stocks to bounce.

And what’s really cool about data, is you can witness shifts taking place in real time. For months, the buying that was pushing the BMI higher was cyclical in nature: Energy, Commodity, and Machinery stocks.

But this week is revealing a broadening of the rally. And this next chart surprised me when I opened the portal on Wednesday morning. Real Estate stocks saw 25% of their universe bought.

That’s massive:

real estate vs XLRE | Big Money Signals

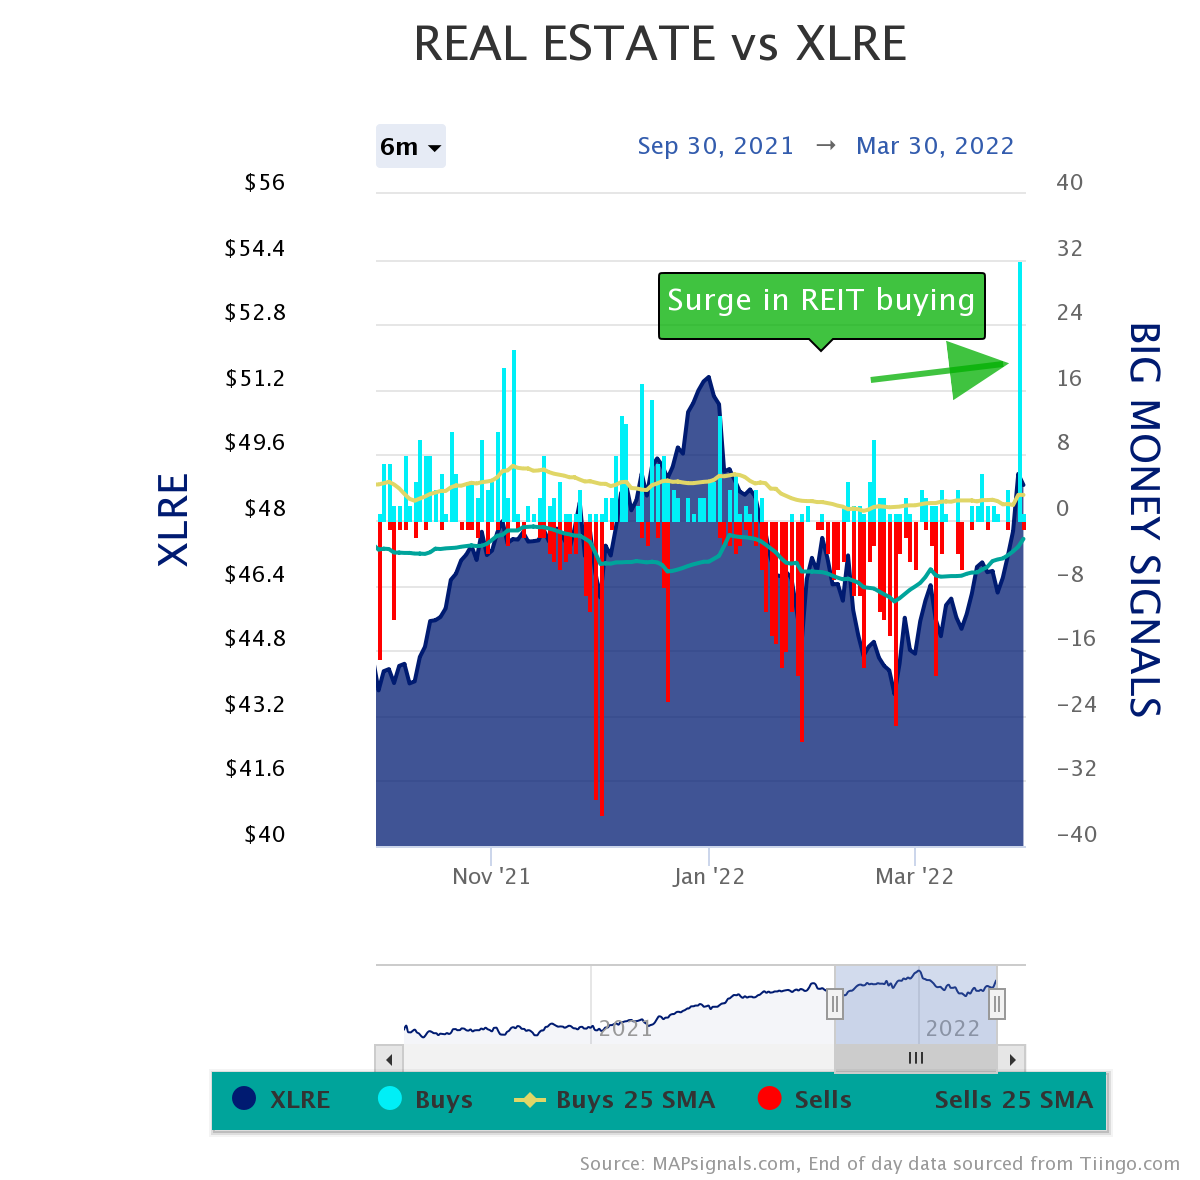
Out of nowhere, 32 Real Estate stocks saw wicked buying. In a high inflationary environment, Real Estate can be a great allocation due to appreciation of real assets. High yields are also attractive.

But there’s fresh buying happening in healthcare stocks as well.

health care vs XLV | Big Money Signals

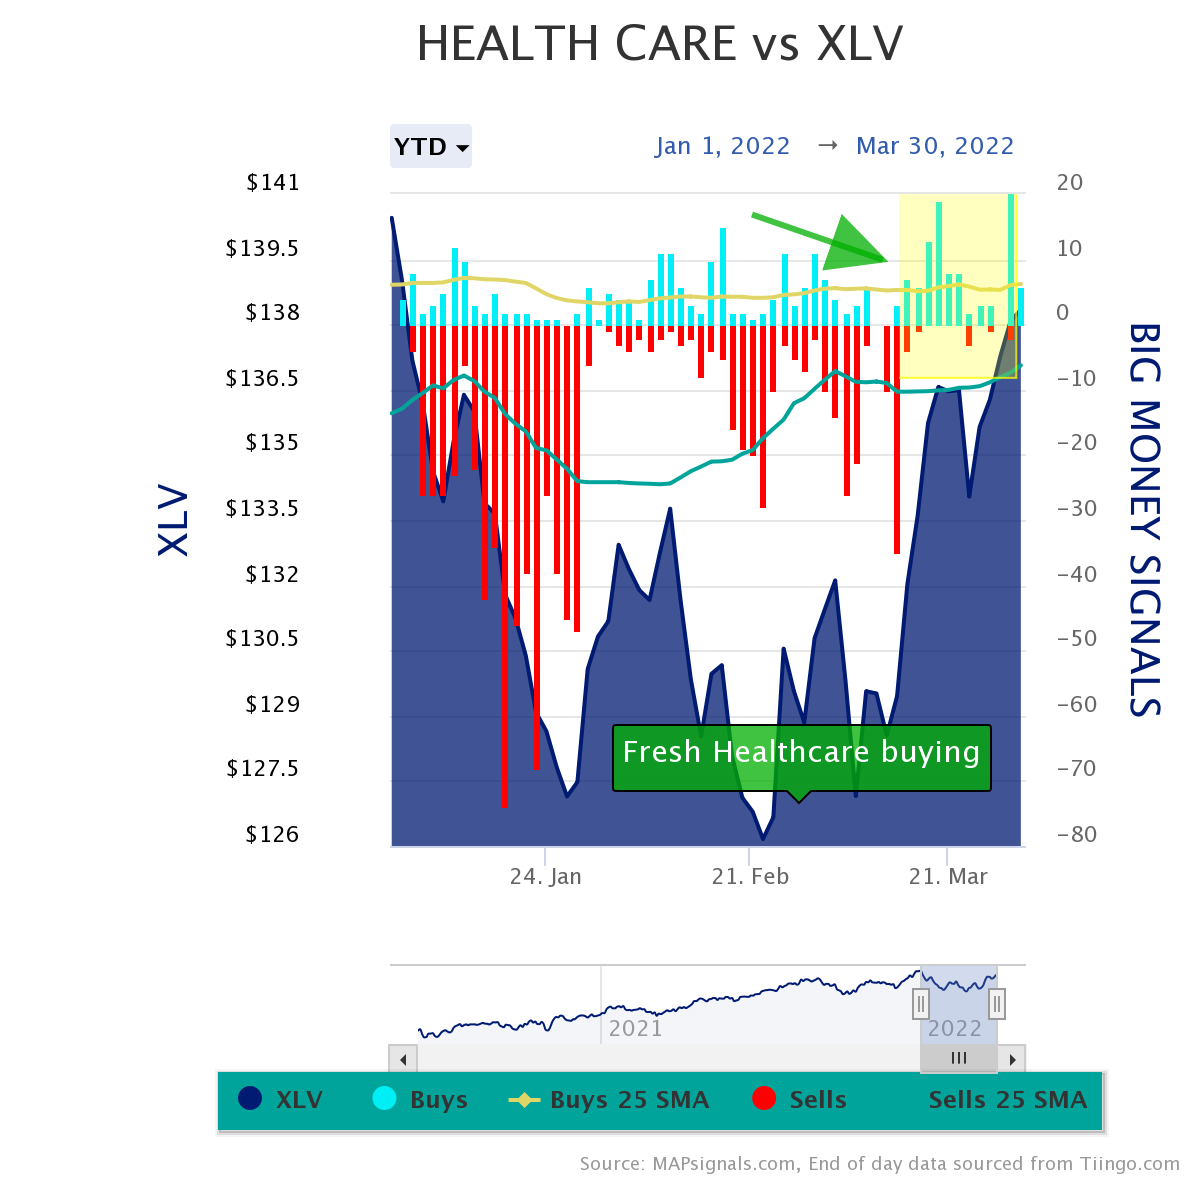
Big non-cyclical Pharma stocks are seeing the juice! This further shows a broadening out of buying in the market. That’s a welcome change if you ask me.

These fresh green signals are why the Big Money Index is breaking out. Get happy! Now, let’s look at 2 other positive signs in our data.

First, Technology as a sector is gaining ground. At the March 7th low, the Technology group was ranked 10th in terms of overall MAP Score. Today it’s moved to 8th:

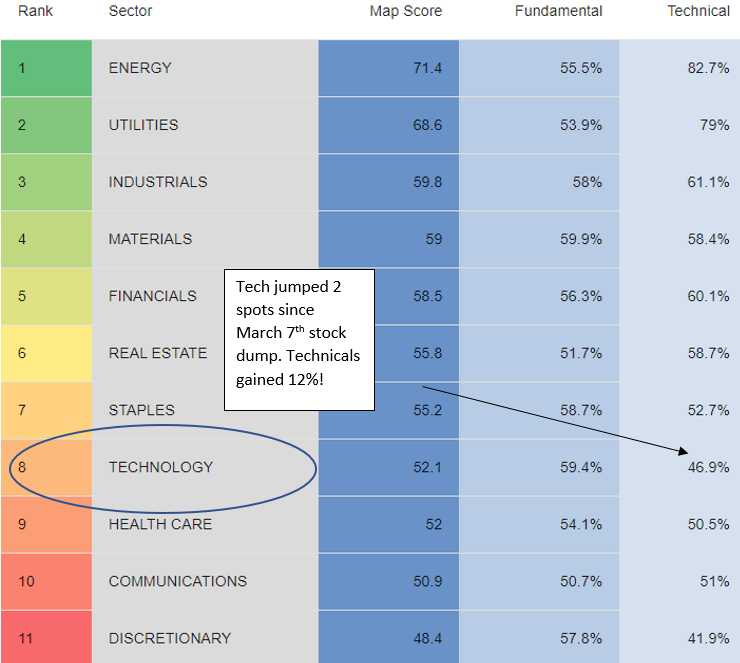
That jump was single handedly due to positive technical action. Again, positives are there for stocks if you want to see them.

And finally, there’s one other major datapoint that’s jumping out at me: outlier stocks are beginning to bounce.

That’s right, some of the best stocks in our data are getting love again. A great way to see that is from our monthly MAP 50 report. These are the 50 most frequent stocks found on our weekly Top 20 report. Look how March’s 50 stocks absolutely trounced the S&P 500 (SPY ETF):

MAP 50 March | Map Portfolio vs SPY

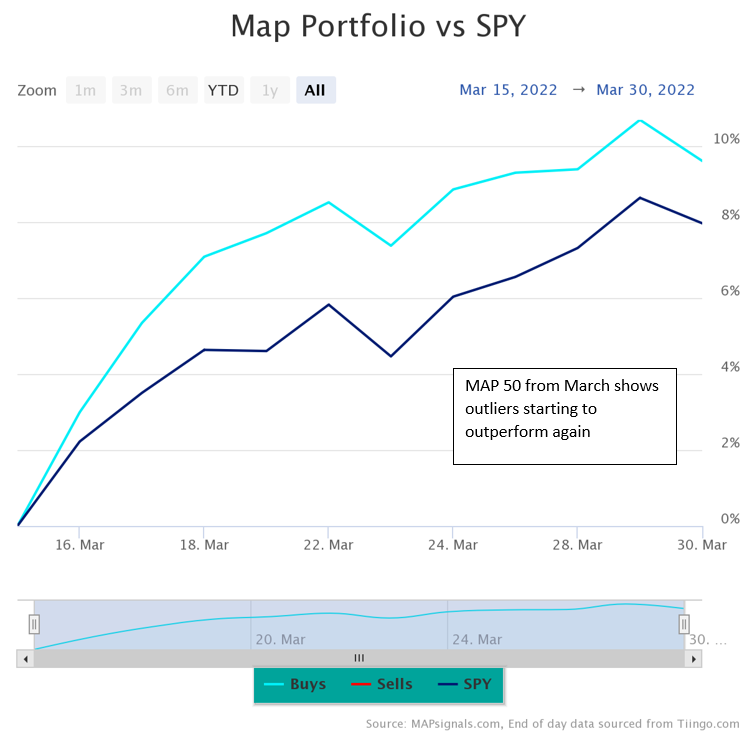
Many of these 50 stocks are technology names. After months of relentless selling in growth and tech, this is a welcome change. And it further explains why the Big Money Index is breaking out.

Let’s wrap up:

Here’s the bottom line: There are positive developments in the stock market. New groups are seeing fresh buying. Big Money data helps bring that information to you.

I see the beginnings of opportunity. What about you?

***As a reminder, Jason is giving a presentation on Tuesday, The Bear Market Guide to Picking Stocks. If you want to learn more about how we use MAPsignals data in a challenging market, tune in. It’s free!

And lastly, my latest video is out: Best Oversold Stocks To Buy for April 2022. I use our data to help find long-term opportunities.

Always remember that the process is more important than the picks.

Make sure to follow our YouTube channel here so you never miss any of our videos.

Also, you can find our other videos here.

Lucas Downey
Lucas Downey

Lucas is co-founder of MAPsignals. His full bio can be found here.
Prior to MAP, he was Head of ETF Sales at Cantor Fitzgerald & SVP of Derivatives at Jefferies, LLC.

Spread the word!

Category: All, Big Money Insights Weekly

Previous Post: «Best Oversold Stocks to Buy for April 2022 Best Oversold Stocks to Buy for April 2022
Next Post: Is Tech’s Rebound For Real Is Tech’s Rebound for Real?»

Reader Interactions

Leave a Reply Cancel reply

Your email address will not be published. Required fields are marked *

Primary Sidebar

Get Big Money Insights for FREE

Want to know where the Big Money is headed?

Just enter your email address below. You'll get our FREE NEWSLETTER sent directly to your inbox.

We call it Big Money Insights... It’s your weekly sneak peek at the powerful market-moving forces that are hidden from 99% of investors.

"*" indicates required fields

This field is for validation purposes and should be left unchanged.

Categories

  • All
  • Big Money Insights Weekly
  • Big Money Series
  • Macro Insights
  • MAP In The Media
  • Members Only
  • Performance
  • Podcast
  • Special Reports
  • Stocks
  • Videos & Interviews
  • White Papers

Archives

  • February 2023
  • January 2023
  • December 2022
  • November 2022
  • October 2022
  • September 2022
  • August 2022
  • July 2022
  • June 2022
  • May 2022
  • April 2022
  • March 2022
  • February 2022
  • January 2022
  • December 2021
  • November 2021
  • October 2021
  • September 2021
  • August 2021
  • July 2021
  • June 2021
  • May 2021
  • April 2021
  • March 2021
  • February 2021
  • January 2021
  • December 2020
  • November 2020
  • October 2020
  • September 2020
  • August 2020
  • July 2020
  • June 2020
  • May 2020
  • April 2020
  • March 2020
  • February 2020
  • January 2020
  • December 2019
  • November 2019
  • October 2019
  • September 2019
  • August 2019
  • July 2019
  • June 2019
  • May 2019
  • April 2019
  • March 2019
  • February 2019
  • January 2019
  • December 2018
  • November 2018
  • October 2018
  • September 2018
  • August 2018

Follow us on Twitter

MAPsignals Follow 1,434 1,061

MAPsignals is a data platform that tracks institutional money flows in stocks and ETFs. Sign up for free insights here: https://t.co/SaAVHjKC9J

mapsignals
mapsignals avatar; MAPsignals @mapsignals ·
54m 1621476848990359552

Pendulum has swung

Helene Meisler @hmeisler

Highest volume for the QQQs since 12/13

Reply on Twitter 1621476848990359552 Retweet on Twitter 1621476848990359552 0 Like on Twitter 1621476848990359552 0 Twitter 1621476848990359552
Load More...

Footer

© 2021 Mapsignals.com

  • Home
  • Contact & Disclaimer
  • Privacy Policy
  • Terms & Conditions
  • Opt-out preferences
  • FAQ

Copyright © 2023 · Mai Law Pro on Genesis Framework · WordPress · Log in

✕
What Happened to Risk Assets White Paper is Here

Get your copy here and take a journey through our thoughts on margin and leverage.

Enter your email address below and you'll get our FREE NEWSLETTER sent directly to your inbox. 

 We call it Big Money Insights... It’s your weekly sneak peek at the powerful market-moving forces that are hidden from 99% of investors.

MAPsignals
Manage Cookie Consent
We use cookies to optimize our website and our service.
Functional Always active
The technical storage or access is strictly necessary for the legitimate purpose of enabling the use of a specific service explicitly requested by the subscriber or user, or for the sole purpose of carrying out the transmission of a communication over an electronic communications network.
Preferences
The technical storage or access is necessary for the legitimate purpose of storing preferences that are not requested by the subscriber or user.
Statistics
The technical storage or access that is used exclusively for statistical purposes. The technical storage or access that is used exclusively for anonymous statistical purposes. Without a subpoena, voluntary compliance on the part of your Internet Service Provider, or additional records from a third party, information stored or retrieved for this purpose alone cannot usually be used to identify you.
Marketing
The technical storage or access is required to create user profiles to send advertising, or to track the user on a website or across several websites for similar marketing purposes.
Manage options Manage services Manage vendors Read more about these purposes
View preferences
{title} {title} {title}