
Big Money Index Is Falling Fast
Sometimes money gushes into stocks: other times capital rushes out.
Right now, the Big Money Index is falling fast, signaling that sellers are rapidly increasing.

We’ll say it again, get ready for summer volatility. These hot summer months usually bring whippy action for stocks. July and August are notorious for stock volumes to dry up. That’s because pro traders are more focused on vacations rather than their portfolios.
Low liquidity environments, like now, are a playground for high-frequency traders to take advantage of. They pounce when retail traders get spooked and rush for the exits: Using market orders (we don’t recommend) sends stocks spiraling lower.
Needless to say, many stocks are breaking down and the Big Money Index is falling fast. Based on our data, only a handful of stocks are keeping the major indexes afloat (i.e. S&P 500, NASDAQ, & DJIA): mostly mega-cap tech.
Contrast that with selling in small-caps, discretionary, and financial names. It’s another nasty rotation going on.
When breadth is light, odds are that the BMI has further to fall. And that typically means more pressure on stocks.
But don’t freak out! This is typical summer action. Having an gameplan is critical to success. There’ll likely be great deals on stocks in the days and weeks ahead…more on that in a bit.
Now, let’s take a look under the hood of the market.
Big Money Index Is Falling Fast
Each morning we scan our data. It’s our morning newspaper. We’re on the lookout for trends.
Last week we noted how sellers were increasing, pressuring the Big Money Index.
That theme has intensified to say the least: The Big Money Index is falling fast:
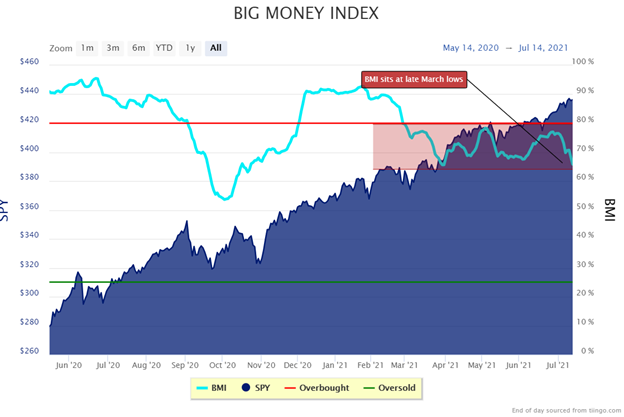
Above, I’ve outlined what’s important: the BMI is now at levels not seen since late March. And for the BMI to fall this fast, there must be a notable pickup in selling…and there is.
Let’s take a look at the daily action in stocks. These are the signals that make up the BMI. When buying slows and selling grows, it’s like watching the waves push and pull in the ocean.
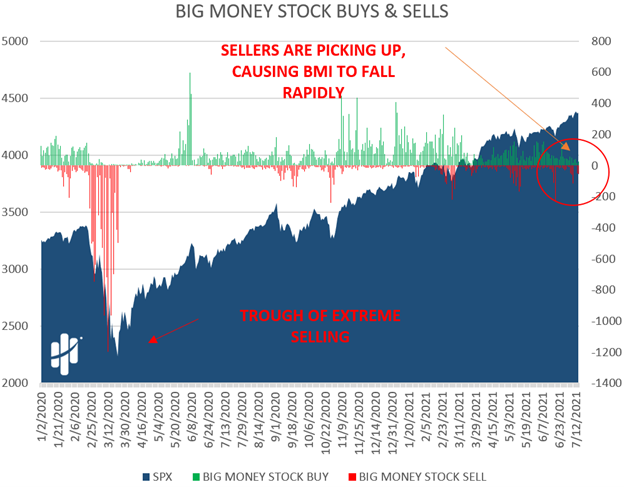
And there is a major tug right now. Below is our Big Money Stock Buys & Sells chart. Circled off to the right is what’s important: Sellers continue to gain as buyers dry up:
A zoom-in helps to really see it:
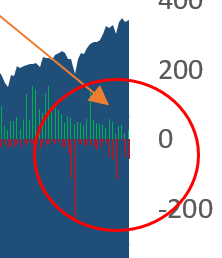
But again, this is the reason the Big Money Index is falling fast. The rate of change in buying versus selling is what’s important. Looking above you can see the green bars are getting shorter and the red bars are gaining.
The tides of Big Money are changing. These same patterns can be seen in ETFs too.

What’s interesting about ETFs is they’re baskets of stocks, making it easy to see rotations. For 2 weeks now there’s been buying in a few mega-cap tech funds and bonds, while small-caps, international, banks, and airlines catch sellers.
Talk about a big fat rotation! More and more stocks are getting sold compared to those getting bought. That’s why the Big Money Index is falling fast. It’s highly sensitive to the rate of change in buys vs. sells…i.e. shifts in momentum.
This brings me to my final charts. A great way to see shifts in buying and selling momentum, is to look at our Big Money Sector Indexes. Many sectors will share the same patterns, but have a look at the Discretionary group.
The below chart measures the rate of buying in Discretionary stocks. If the green line is gaining, buying is accelerating. If it’s falling, like now, buying is decelerating:
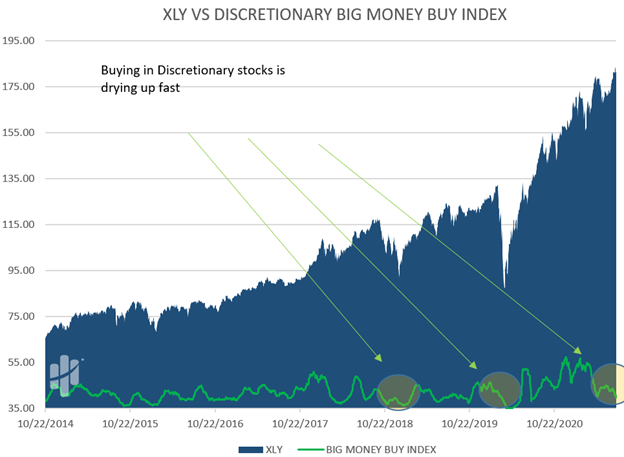
Clearly buyers are drying up fast.
Now look at the rate of change of selling in the Discretionary space. When the red line increases, selling is gaining rapidly. And typically, you see the sector fall soon after:
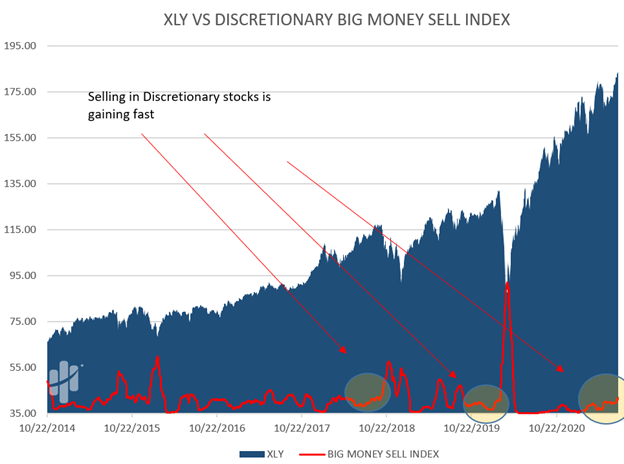
Circled off to the right is what’s important. Sellers are piling on quickly.
I’m showing you these last charts to drive home why the Big Money Index is falling fast.
So, let’s wrap this all up.
Here’s the bottom line: Summer is proving once again that choppy waters are here. Stock sellers are taking charge, putting a ton of pressure on the BMI.
So, what’s our game plan?
We’ll be monitoring the BMI daily, looking for any positive developments. Selloffs have not lasted long recently. So, we suggest pulling that dusty buy list out of the drawer…have it ready.
We’re in a long-term bull market. We believe the “buy the dip” crew is still alive and well.
Take the time now and build your wish list. Low liquidity environments can send stocks to attractive levels.
If we get a big nasty down day, like the 3-4% kind…we’ll likely do some shopping. We always do!
Lastly, if you’re looking for a great potential shopping list, subscribers can check out yesterday’s July MAP 50 list. It’s full of our Big Money favorites…the outliers!
Hang in there, folks! This too shall pass.
Finally, check out our latest video, Best Growth Stocks for August 2021. Luke dives into 5 stocks on his radar.