
Brace for Impact
Capitulation is getting closer.
That spells more trouble for stocks.
It’s time to brace for impact.
Look, fear is high right now. Interest rates are surging to levels not seen in over a decade. Pundits proclaim that the end of days is nigh.
But here’s the deal. These scare tactics are devices to paralyze you from making good investing choices. It’s all a sideshow that’s as old as time.
High emotions breed discomfort and worries…leading to indecision. Don’t fall for the tricks.
Rather, rely on data.
I’ll be frank. I believe more pain is ahead for stocks. That’s the near-term setup. Based on history, we could reach oversold conditions within weeks.
For the prepared, it’ll be a momentous buying opportunity.
Big Money Index Signals Capitulation is Near
Stocks follow the supply and demand curve. If you recall in econ 101, this curve plots the relationship between how much product is available to the crowd and how much they want to buy it.
This is exactly how the stock market works.
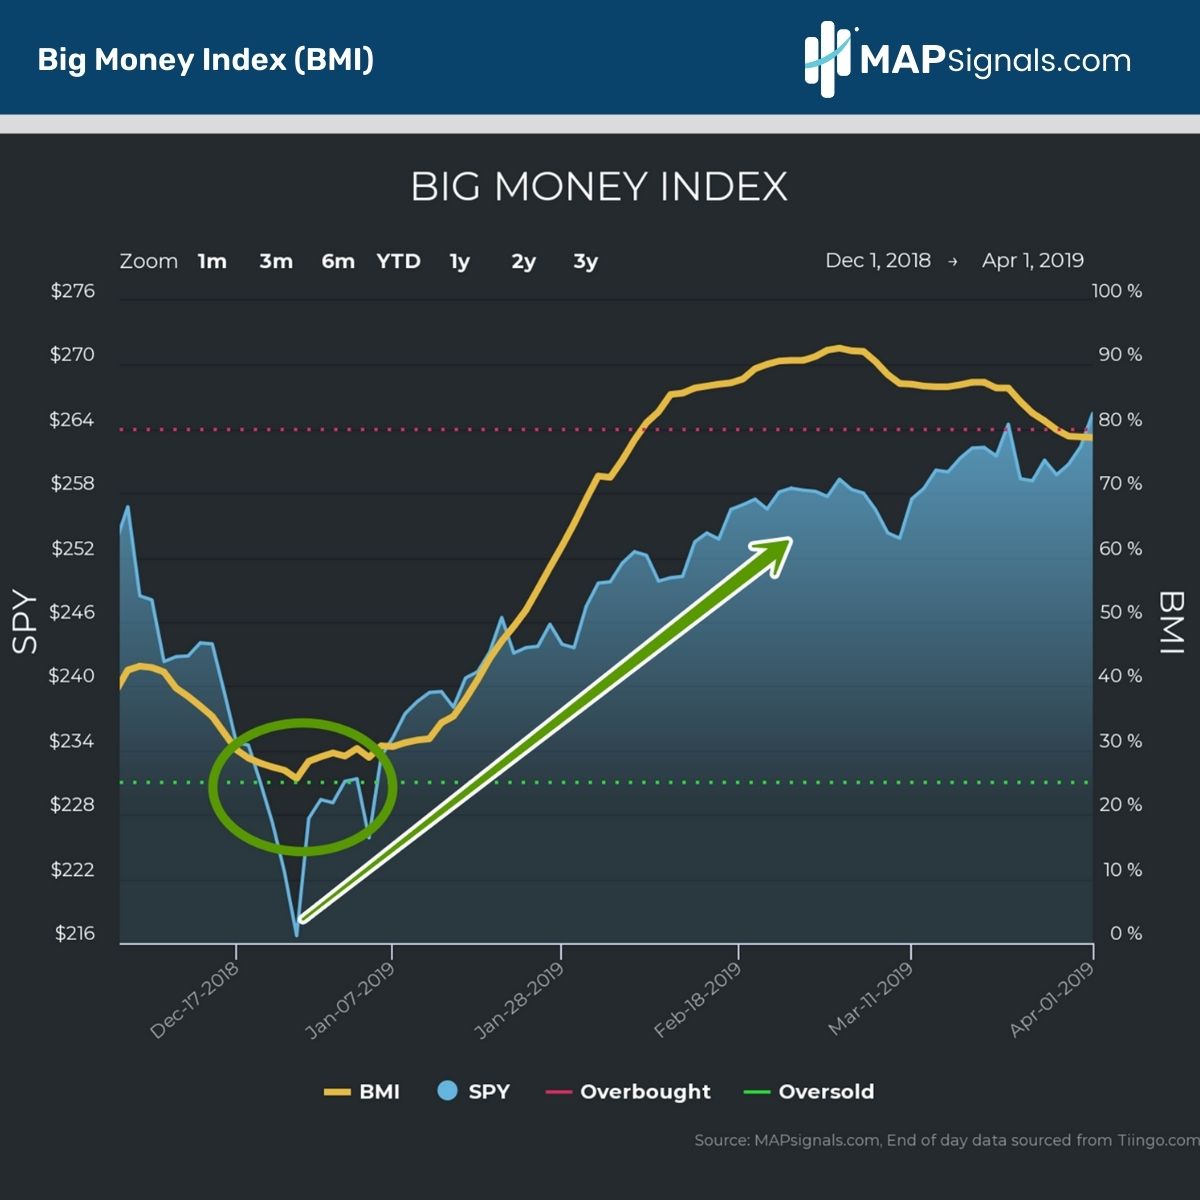
Since late July, supply has overwhelmed demand as detailed by the freefalling Big Money Index (BMI). This is the market’s North Star. Where it travels, stocks follow.
The warning signs were there. An overbought BMI coupled with seasonal weakness had us prepare for a summertime pullback on July 27th (right red circle).
Since then, demand for stocks has ground to a halt:
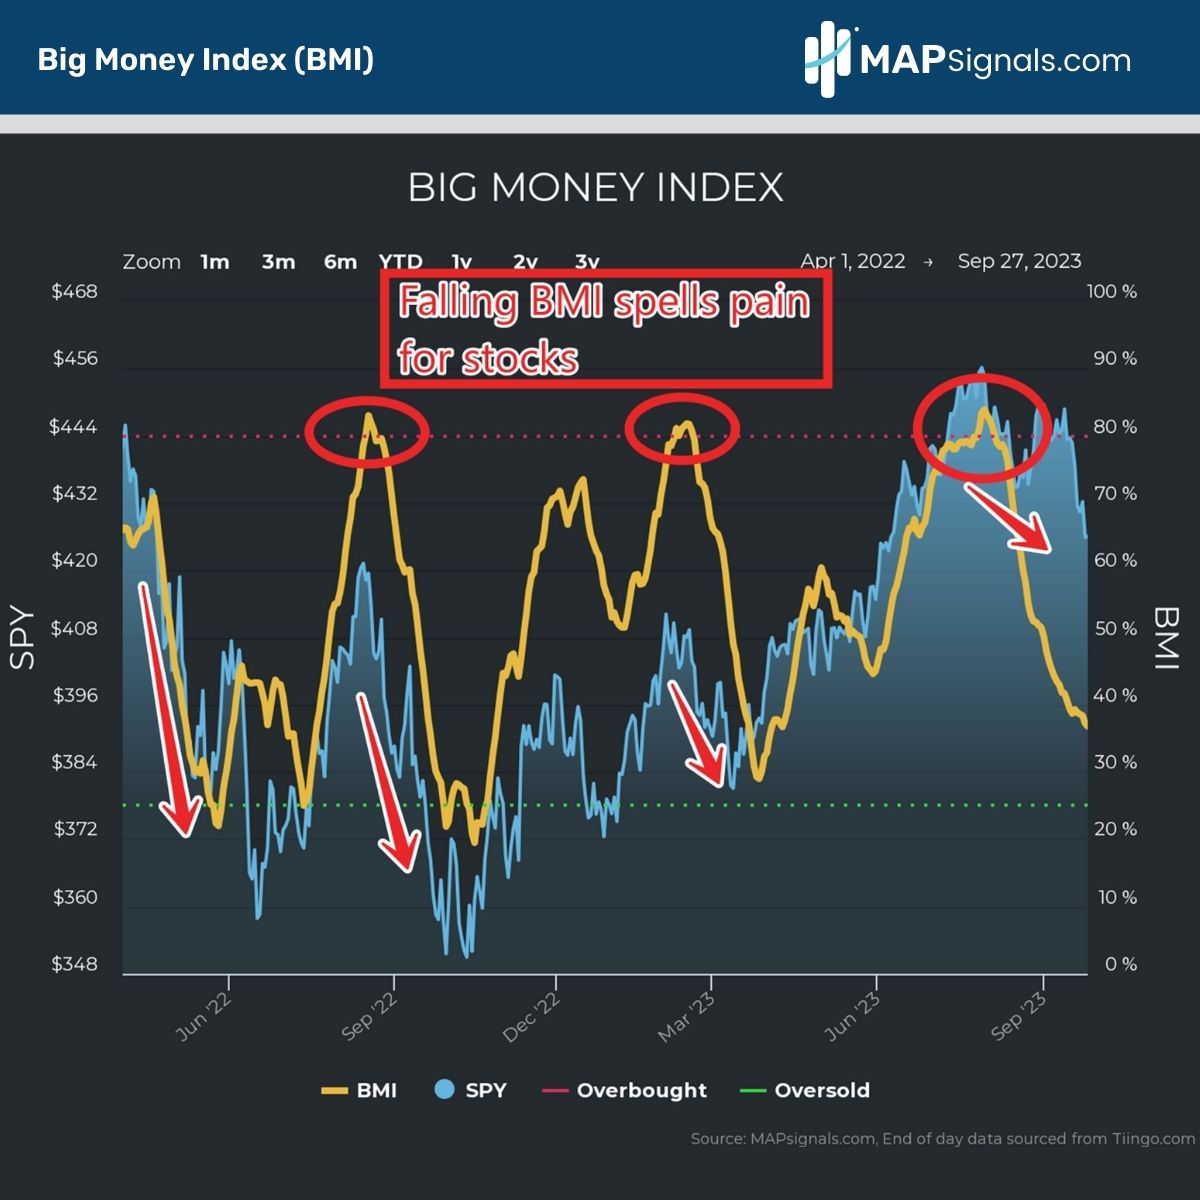
As of this morning, the BMI has fallen to 37%. A dramatic fall from 82% to 37% in two months’ time indicates there’s a ton of selling going on.
There is.
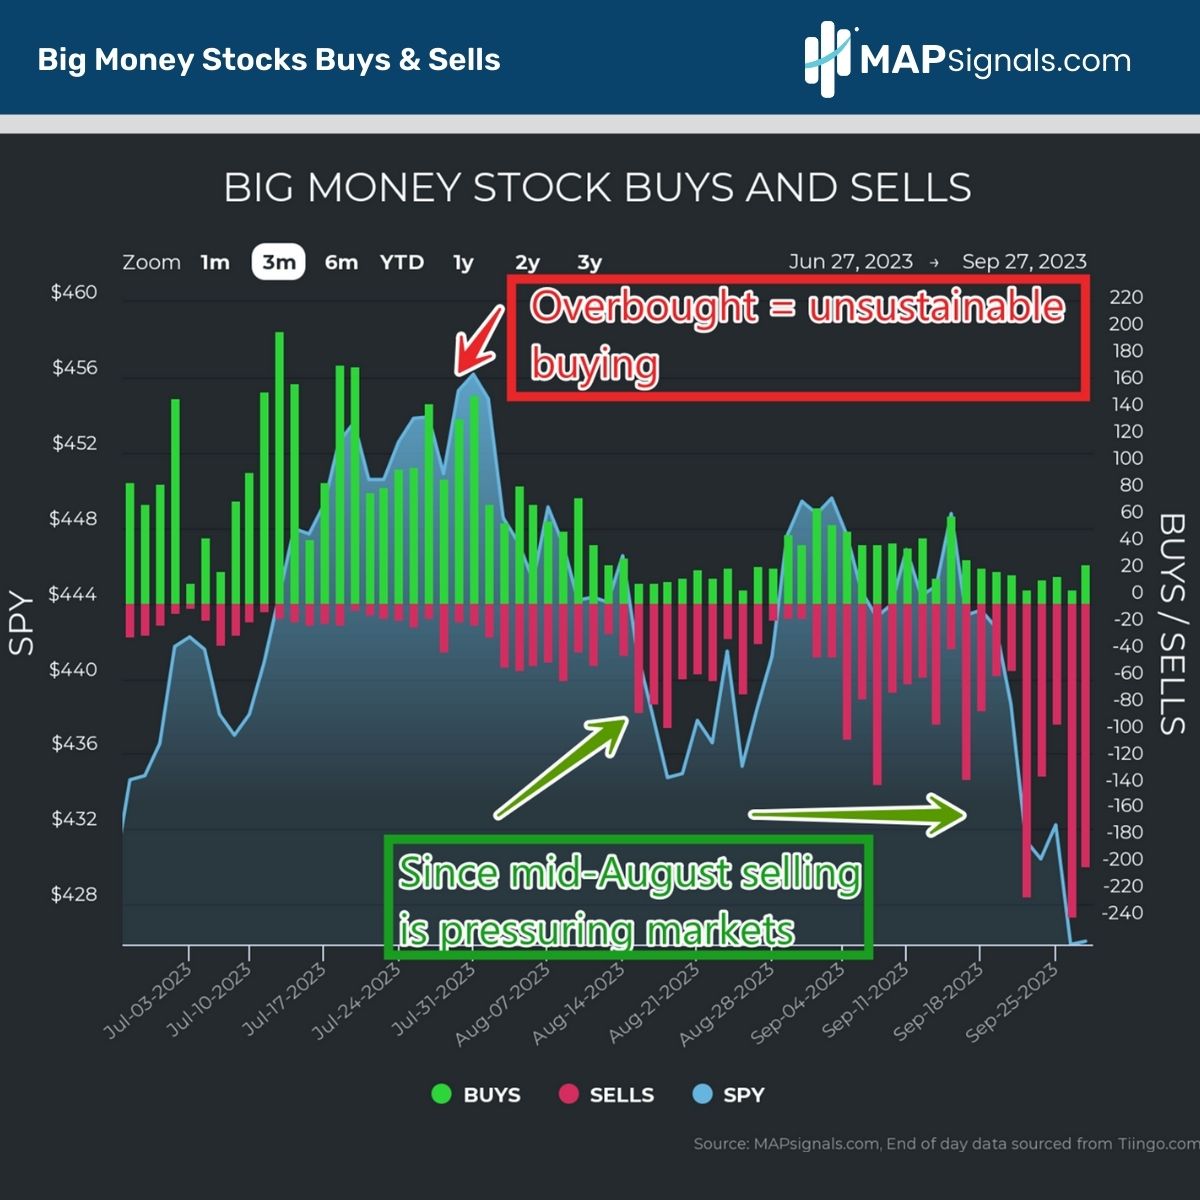
One look at the daily count of stocks getting sold and bought tells the story. Buyers are effectively non-existent.
Since August 14th, 978 stocks were bought while 2,459 equities were sold. That puts 7 out of 10 stocks on the sale block:
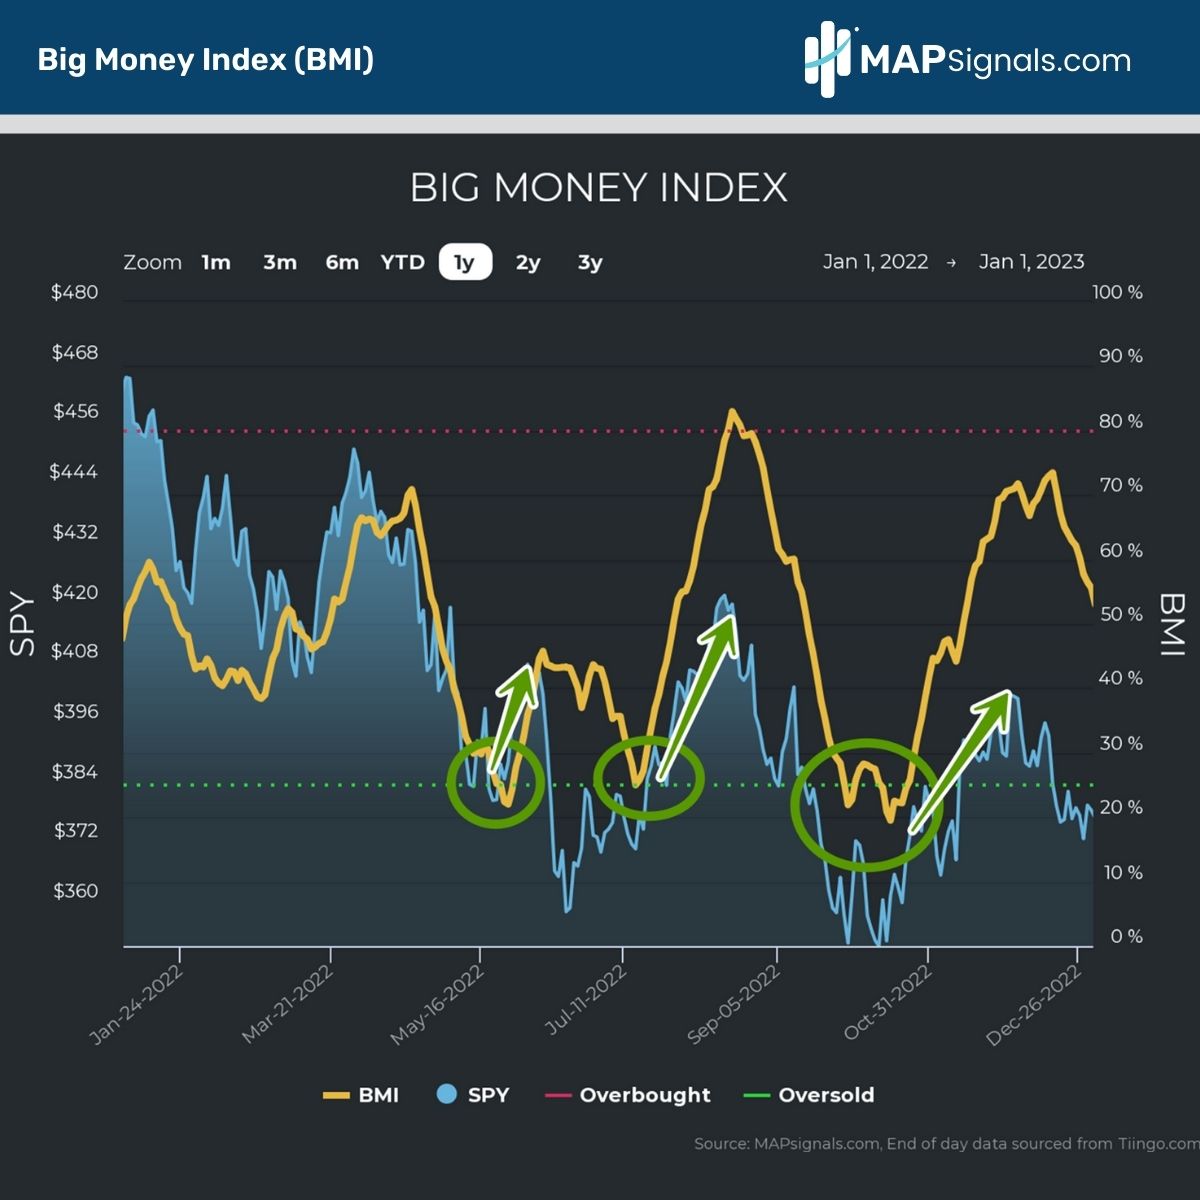
This is the type of action that can push us oversold. Only in the market’s darkest hour will we reach the green zone…when all hope is lost.
2022 had 4 instances. We were vocal to start buying stocks. Pundits told you the world was doomed.
It wasn’t.
Extreme oversold readings are incredibly bullish:
If the trusty BMI helped us navigate last year. What about the pandemic? In January of 2020 we told folks to brace for impact.
When the BMI falls from overbought in a straight line, that’s the canary in the coal mine.
But our song was one of hope. We prepared people for an amazing buying opportunity. We sent the marines on March 19th, 2020, as the green light flashed:
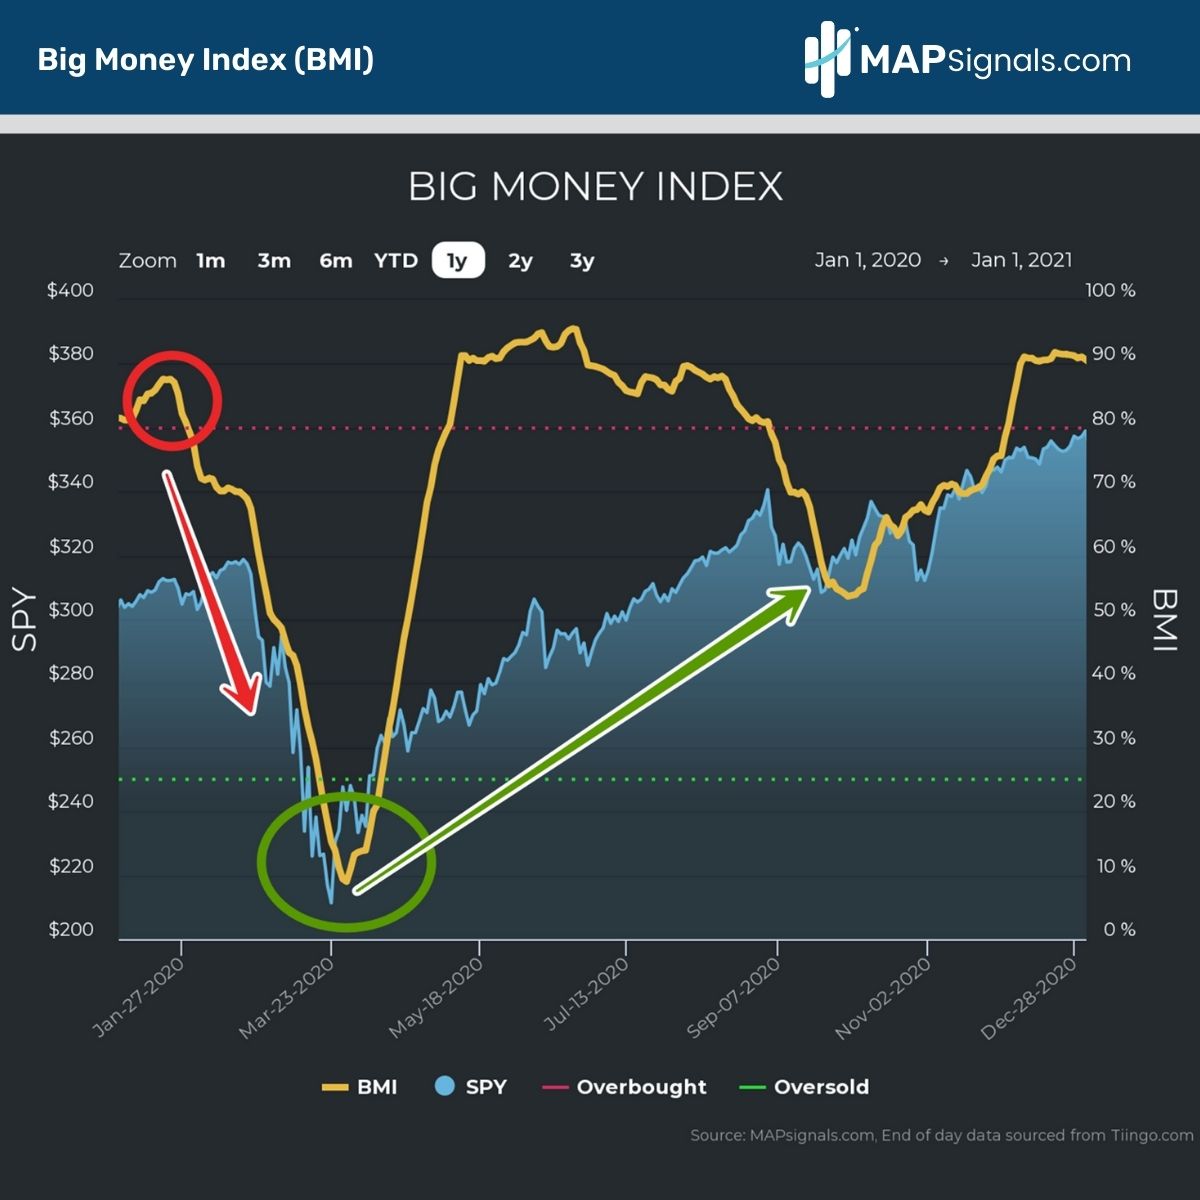
The crowd hated that bullish call. Looking back, it was one of the boldest calls we’ve ever had. Yes, the BMI navigated a once in a generation pandemic!
Let’s do one more for good measure. Prior to the pandemic, the same setup hit on Christmas Eve of 2018.
Stock market Christmas came right on time. Look how the oversold reading (green circle) ignited a ferocious rally:
With historical evidence on our side, let’s prepare you for what’s likely ahead.
Brace for Impact – Get Ready to Buy Stocks
At this stage, I’m inclined to believe we’ll reach oversold conditions. Markets are facing plenty of headwinds:
- Rising oil prices
- Rising interest rates
- Potential government shutdown
The list never stops. These are exactly the moments to brace for impact.
By my calculation, we could reach oversold in as early as 2 weeks. If that’s the case, we’ll be in full-on risk-off mode.
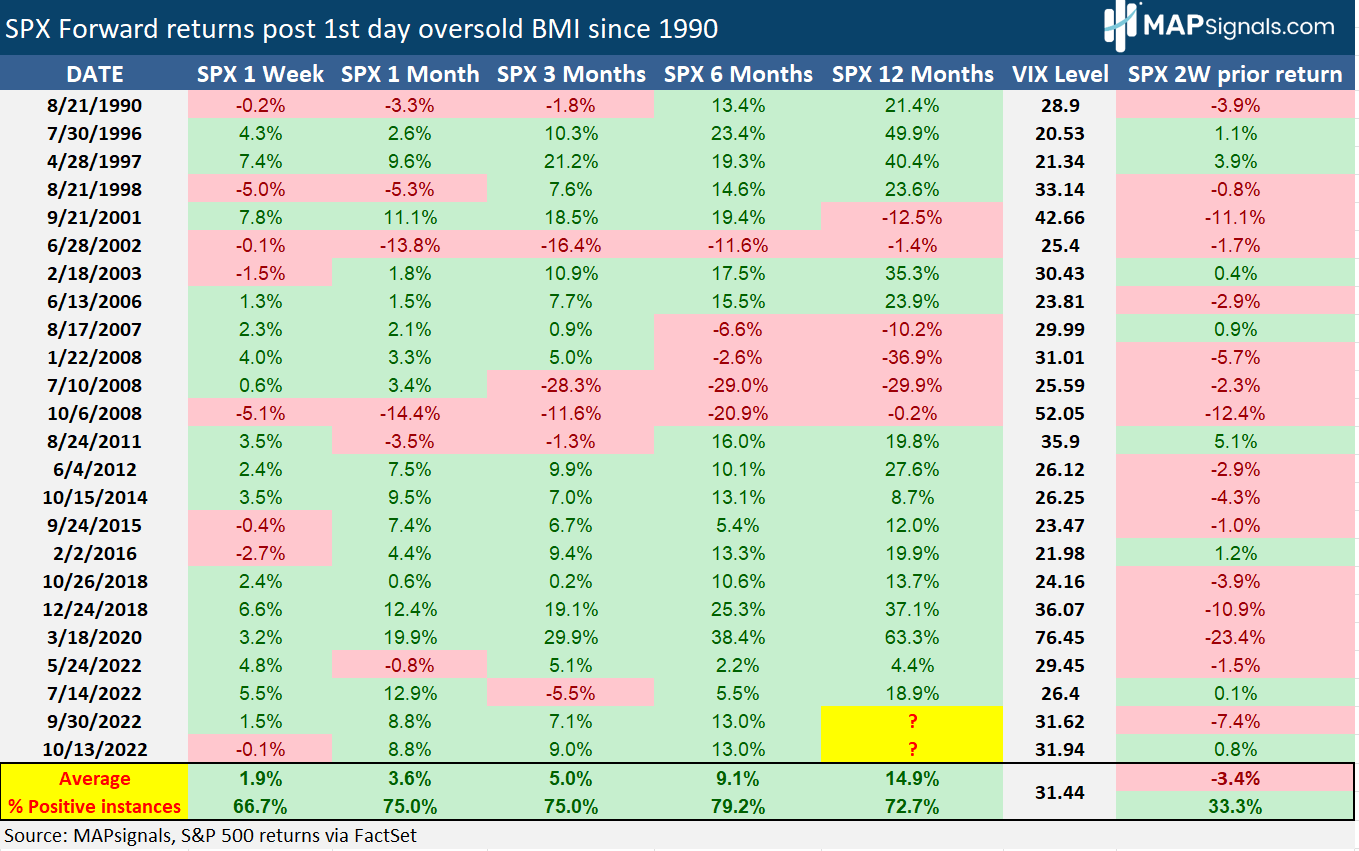
I put together a study detailing all prior oversold periods going back to 1990. It’s an incredibly bullish signal that’s only triggered 24 times.
That said, the 2-week period leading into the green zone is fraught with downside as the S&P 500 tends to fall 3.4%. Add to it, the average VIX reading on the first day of oversold is 31.44 – magnitudes higher than today’s reading of 18.19.
With the S&P 500 at 4,274, a 3.4% pullback pegs the index at 4129:
Yes, it’s prudent to brace for impact. BUT don’t sit idly. The real story is what’s ahead once the green light flashes.
The average gain for the S&P 500 a week after an oversold BMI is a stunning 1.9%.
A month later it’s up 3.6%.
12-months later it jumps nearly 15%.
The juice will be well worth the squeeze! You can only imagine what outlier stocks will do in that environment…rocket launch time!
Let’s wrap up.
Here’s the bottom line: Markets remain under pressure. It’s very possible we’ll reach oversold conditions if interest rates keep climbing.
History says stocks will be in for pain if so.
Brace for impact.
But for those who study history, once we reach oversold, you’ll be staring at one of the best buying opportunities you’ll ever get.
Can you navigate markets without a MAP? Probably.
I just can’t recommend it.
If you manage money OR are like me and take investing seriously, get started with a MAPsignals PRO subscription.
Don’t follow the media. Follow the Big Money with MAPsignals.