
Extreme Oversold Readings
When’s the best time to buy stocks?
Likely, it’s when no one wants them. That’s where we are now. Our data points to extreme oversold readings.
Let’s just get September over with. Four weeks ago, I wrote how you should prepare for September volatility. I expected red, but certainly not to this degree.
Month-to-date the S&P 500 has turned in a miserable performance of -7.8%. That’s the worst September return since 2008, when stocks slid 9.1%. Brutal.
The macro landscape has investors worried: rising interest rates, ramping inflation, souring earnings expectations, etc. No doubt, it’s hard to find a positive narrative in the headlines.
So, is all hope lost? NO.
As I’ll show you, we’re witnessing complete capitulation in our data. That means we’re seeing extreme action that typically bodes well for stocks in the weeks and months ahead.
Today I’ll walk you through some eye-popping charts and show you why extreme oversold readings usually preface a relief rally.
Extreme Oversold Readings
If you want the temperature of the market, study big volume trends. The Big Money Index gauges big investors’ appetite for stocks. Currently, no one’s interested in taking a bite out of public equities.
In rare cases, the BMI reaches extreme areas where selling is epic and unsustainable. We are days away from that point. Right now, it’s sitting at 28%, just a tad above the oversold threshold of 25%:
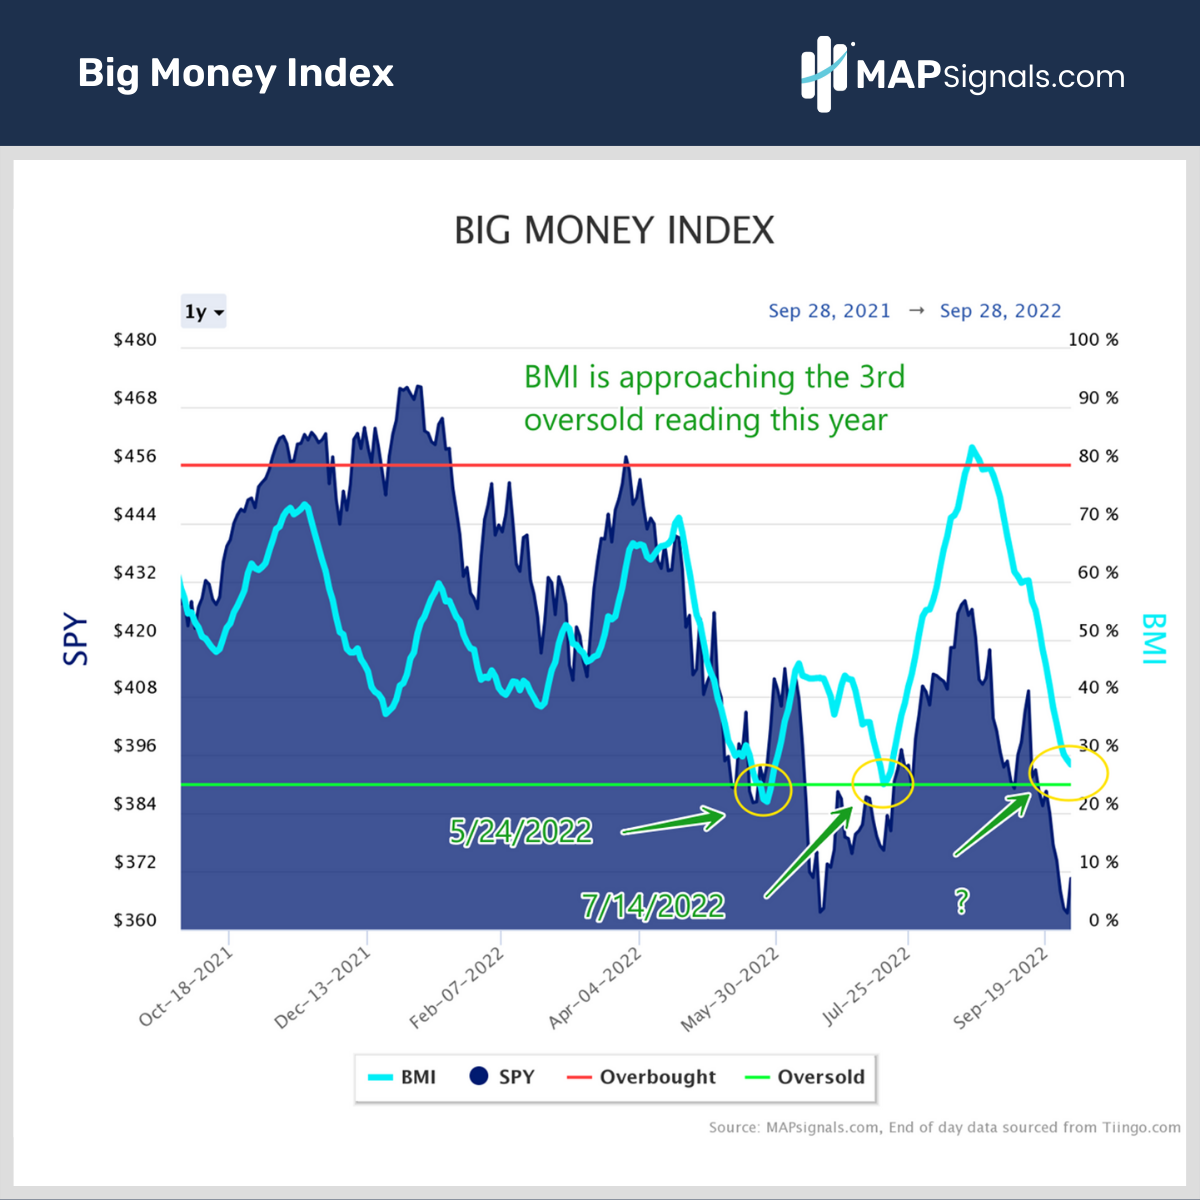
What’s incredible is if we cross the green line to the downside again, it’ll be the 3rd oversold instance this year. The only other year where that happened was 2008. Indeed, we’re experiencing a year of extreme oversold readings.
But let’s keep going. If you’re waiting for capitulation to signal a near-term bottom, it’s here. We’re clocking some of the largest selling all year.
Below is the Big Money Stock Buys and Sells chart. I’ve highlighted areas of capitulation days. We’ve had 8 the past year, with 2 over the past week:
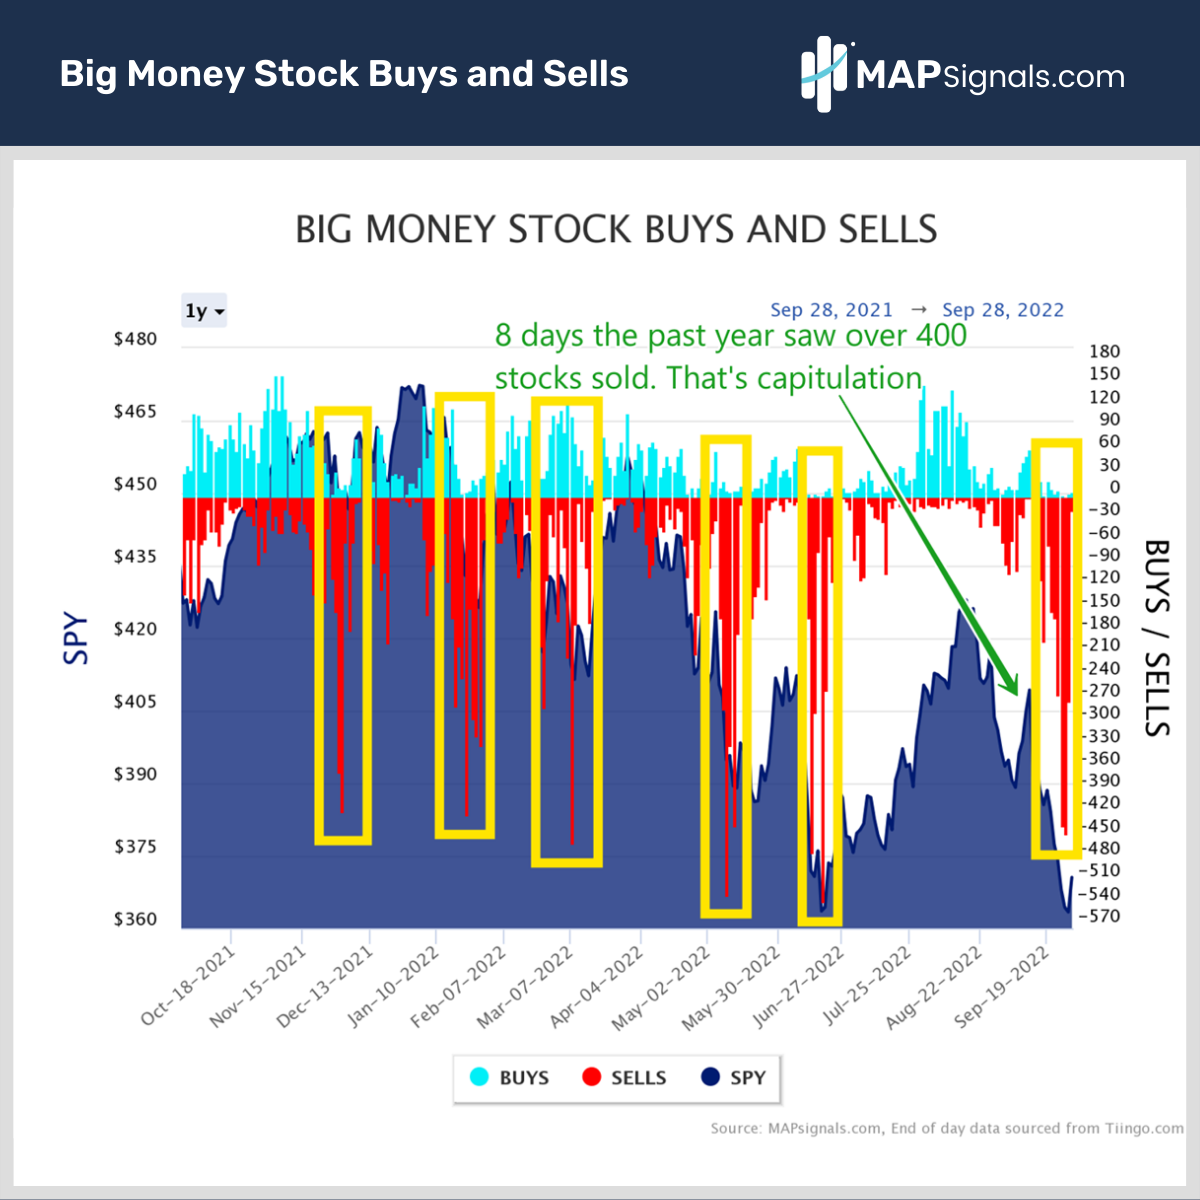
When we note over 400 stocks sold in a day, that’s extreme. It indicates that roughly 30% (1400 institutional names) of our stock universe was dumped… again, very risk-off action.
We see the same with ETFs, too:
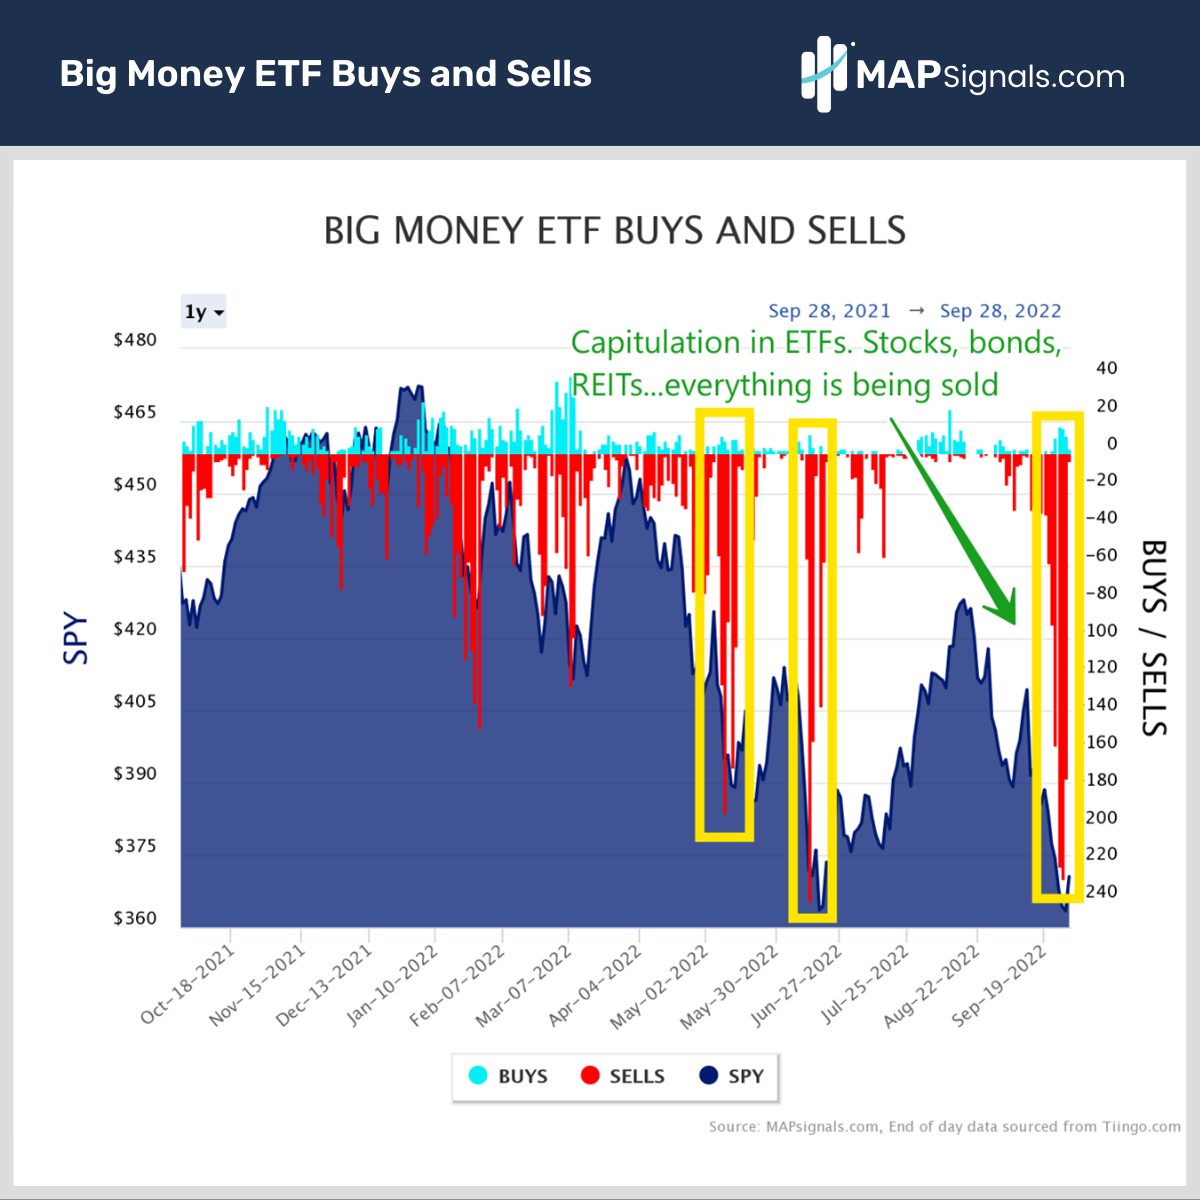
Equity funds, REIT funds, and bond funds are all getting dumped. It’s been a one-way train lower.
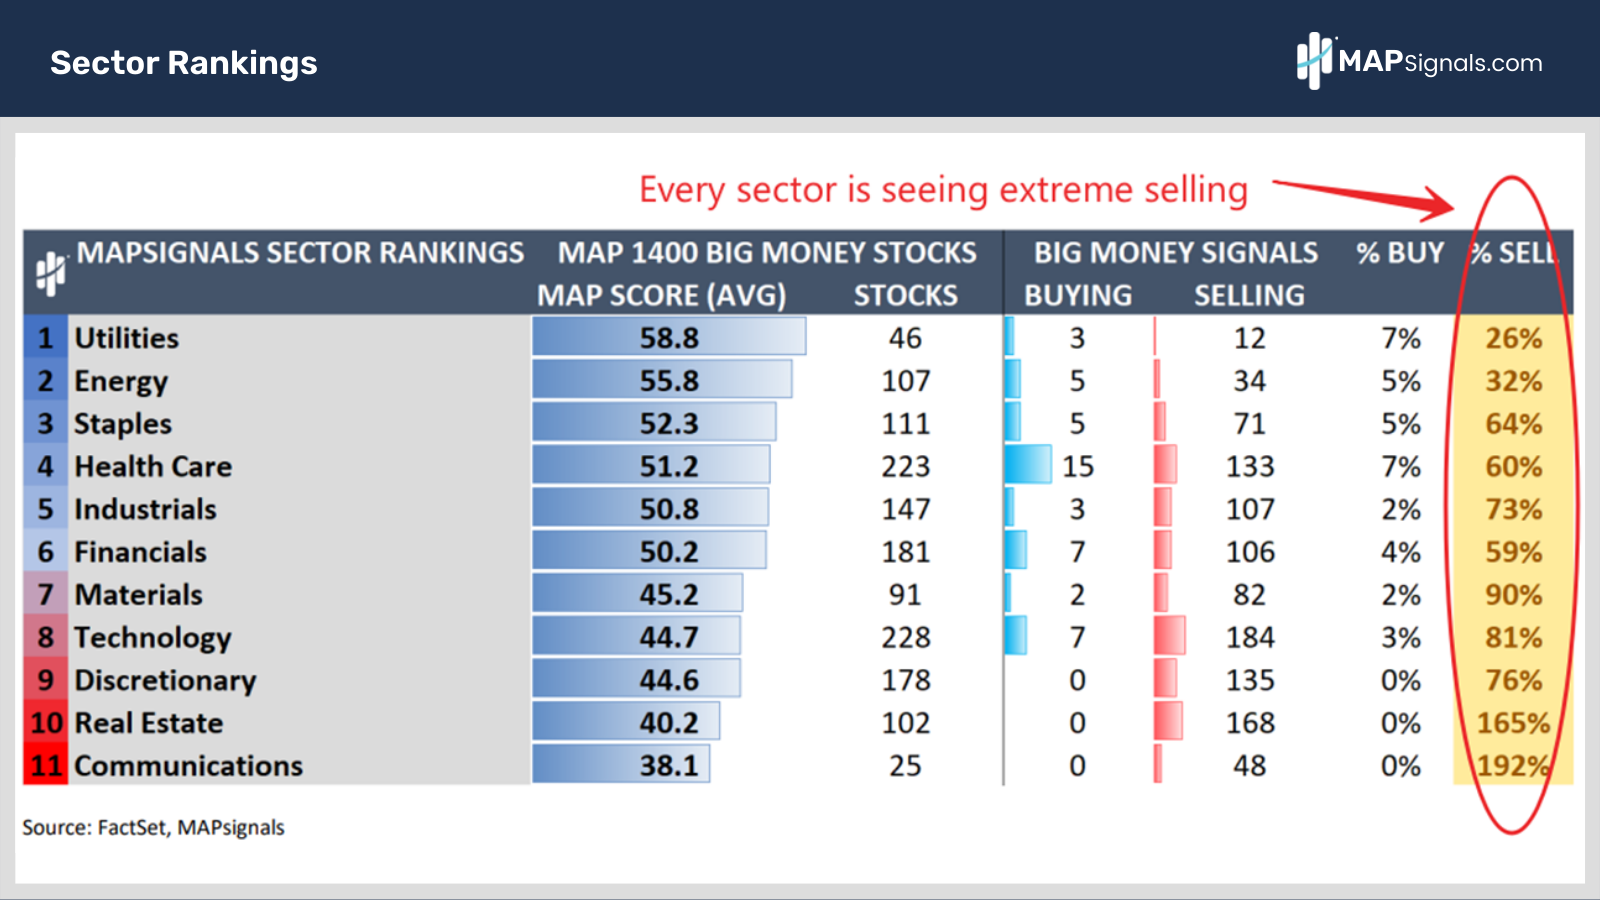
And if you’re curious about sectors – yes, they’re all under pressure, too. A great way to see that is via the below chart from our MAP View report on Sunday for subscribers.
Off to the right details the percentage of stocks sold last week by sector. Any group above 25% gets highlighted.
All sectors were flashing big selling during last week’s rout:
So, with all of this destruction, I’ll ask the question I asked earlier: When’s the best time to buy stocks? Typically, it’s when the crowd is uninterested. Let me show you why.
We are quickly approaching oversold on the Big Money Index. That’s a rare point. We’ve only hit 25% on the BMI 22 times since 1990.
Here are the forward returns for all oversold readings.
From left to right you’ll see the first and last day of an oversold reading, then the days of duration. The forward returns are the S&P 500 1-month through 2 years post the first day of oversold:
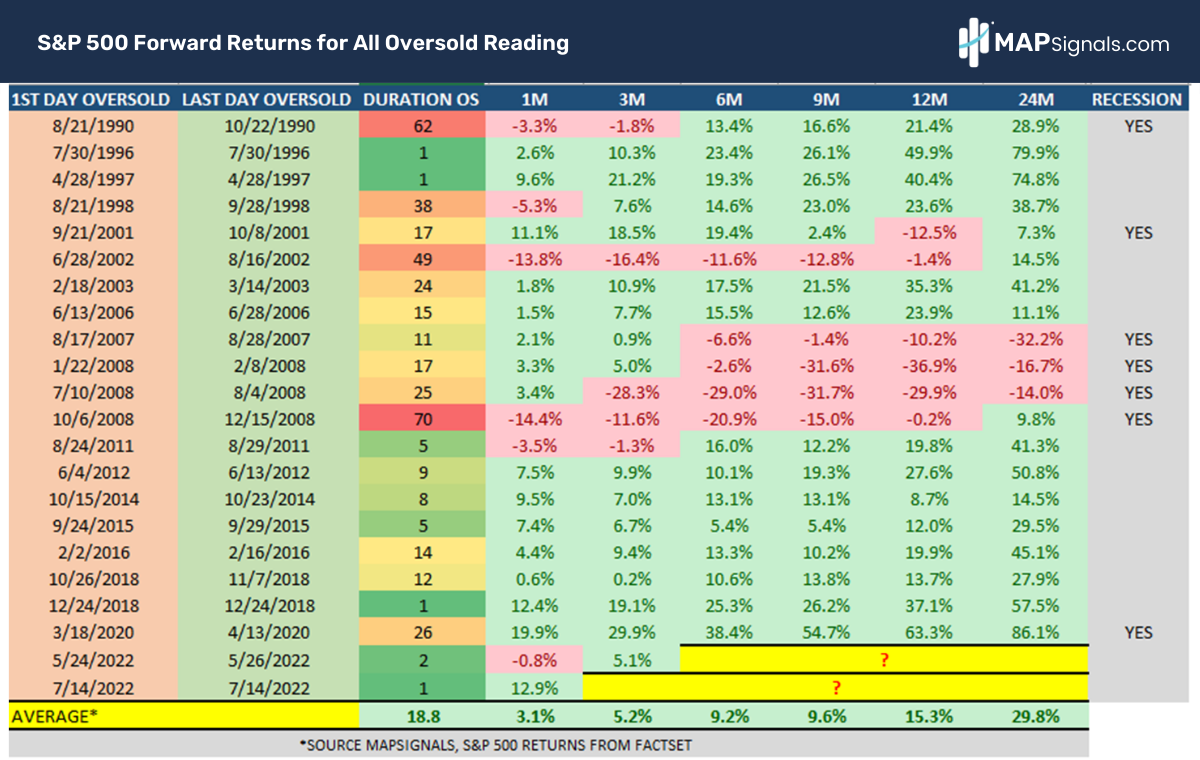
That’s a lot of green! Notice the average forward return is positive in all instances listed. The average gain a year later is +29.8%.
The only period with negative returns, a year later, was in 2008.
Given we’re approaching this green zone for the 3rd time this year, my bet is it’s worth it to start nibbling at stocks… especially if you have many years ahead of you until retirement.
Over the long run, going against the crowd is likely a good idea.
Let’s wrap up.
Here’s the bottom line: Markets are under a lot of pressure. We’re noting extreme oversold readings in stocks and ETFs. Soon, our Big Money Index will likely reach oversold.
These moments tend to be great buying opportunities. Stocks are up double digits on average a year and 2 years out.
And add to it we’re in the midst of a midterm election year. Our recent midterm study found that there are strong seasonal patterns for stocks in the months of October and November, with gains of 2.5% and 2.4% respectively for the S&P 500.
The setup certainly favors a relief rally soon.
We’ll be putting out a list of stocks to our subscribers, highlighting where we see opportunity once we reach oversold. If you’re looking to kick your investing up a notch, get started with a MAPsignals subscription today!
Hang in there folks!