
Brace For More Stock Market Volatility
When you stare at data every day, trends become easier to spot. Right now, one trend is certain: uncertainty.
Now, a week after we said stocks are heading lower, markets have whipped around. For now, the data says, brace for more stock market volatility.
So, what’s up with stocks? We notice two themes right now.
On the surface, Big Money data suggests stocks will continue to be volatile in the days ahead. All that means is there’s a tug-of-war for leadership going on under-the-surface. Until that new leadership solidifies, markets should bounce around a bit.
There are however positive signs for recently beaten-down high-quality growth stocks. Many of them aren’t breaking down like the prior few weeks. That leads us to believe most of the selling in the space might be behind us. That means there’s opportunity.
So how do we navigate the weeks ahead?
New investors might want to grab some antacid. Seasoned investors should pick their spots. We’re doing the latter at MAPSignals because we know that eventually all storms pass.
And when they do, juicy outlier stocks will bounce quickly. But for now, we’re prepared to brace for more stock market volatility.
Let’s look at the data landscape.
Big Money Index Brace For More Stock Market Volatility
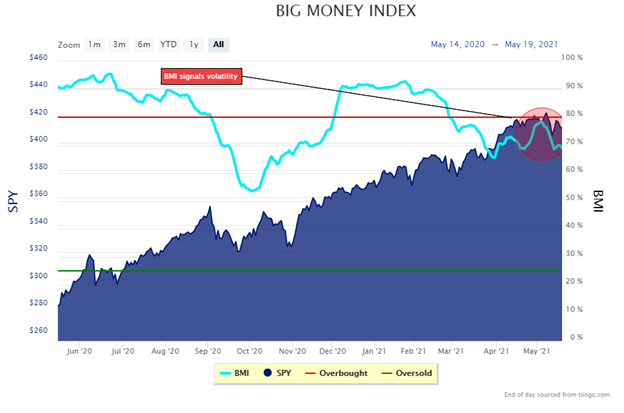
To know the overall trend of the market, we consult the Big Money Index.
It’s great at signaling big investor trends …and also what’s ahead for the stock market.
It’s important to remind you that this indicator tends to lead the market. If it’s range-bound and choppy, to us that means to brace for more stock market volatility:
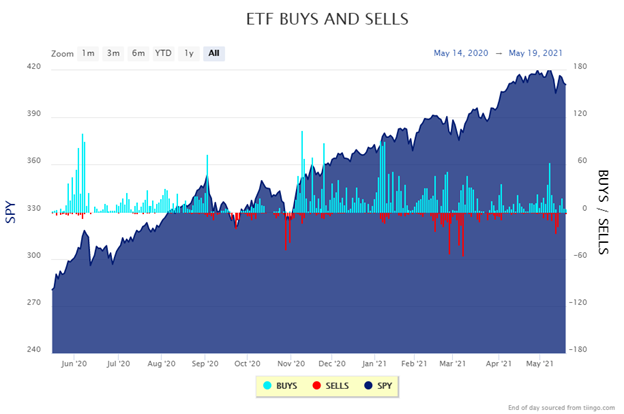
One look at daily stock buys and sells helps zero-in on themes. Clearly, waters are choppy out there.
The Big Money Stock Buys & Sells chart tells us what’s going on each day. These are the daily signals of individual stocks that make up the BMI.
Recently, things have been quiet:
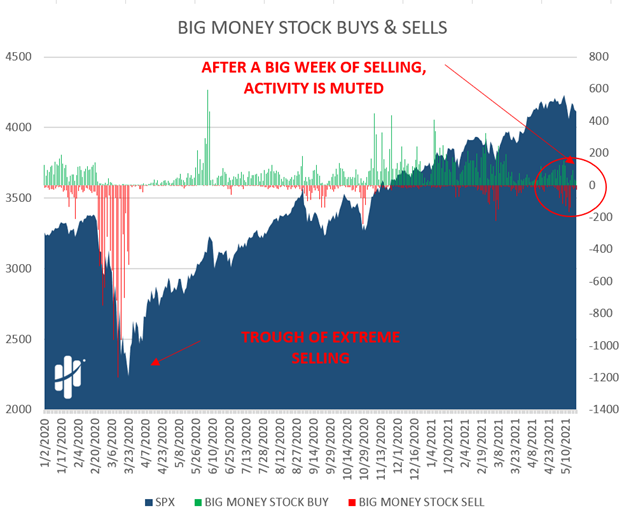
Why so quiet? Because selling in Technology stocks has finally been slowing.
After we zoom-in, we can see the red bars are getting smaller:
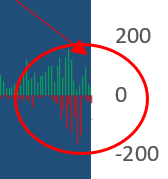
Green bars have also gotten smaller, but keep in mind how the BMI is constructed. Its movements are pegged more towards selling because it’s a ratio of buying over selling. When there’s only buying (even if small) you get a high BMI. Whereas any selling dilutes it…
This quieter action is what’s keeping the BMI rangebound.
The same quiet action can be seen in ETFs too. Last week’s selling marked lows for the market- at least for now…
So, that was the bad news. Here’s some good news…
Selling In Growth Stocks Has Slowed
Last Friday was a big rally for Tech stocks. The NASDAQ 100 (QQQ ETF) ripped 2.21% higher that day.
Over the weekend we looked over our data and found signs pointing to near-future green shoots for growth stocks. Friday’s rally showed that many recent market pain points (tech & growth) were likely seeing some buy action.
Why do we think that?
We looked at stocks trading on big volumes. These are stocks in the middle of a trading range, which means they aren’t high enough to make a buy signal or low enough to make a sell signal.
That usually means buyers and sellers are moving shares around as they get positioned but haven’t yet pushed them to a breakout or breakdown. But, when we looked at the stocks that rose on Friday with huge volumes, many stocks were getting bought under the surface.
To us, this indicated both short covering & real buying.
And get this – 25% of them had excellent sales and earnings growth. The breakdown looks like this:
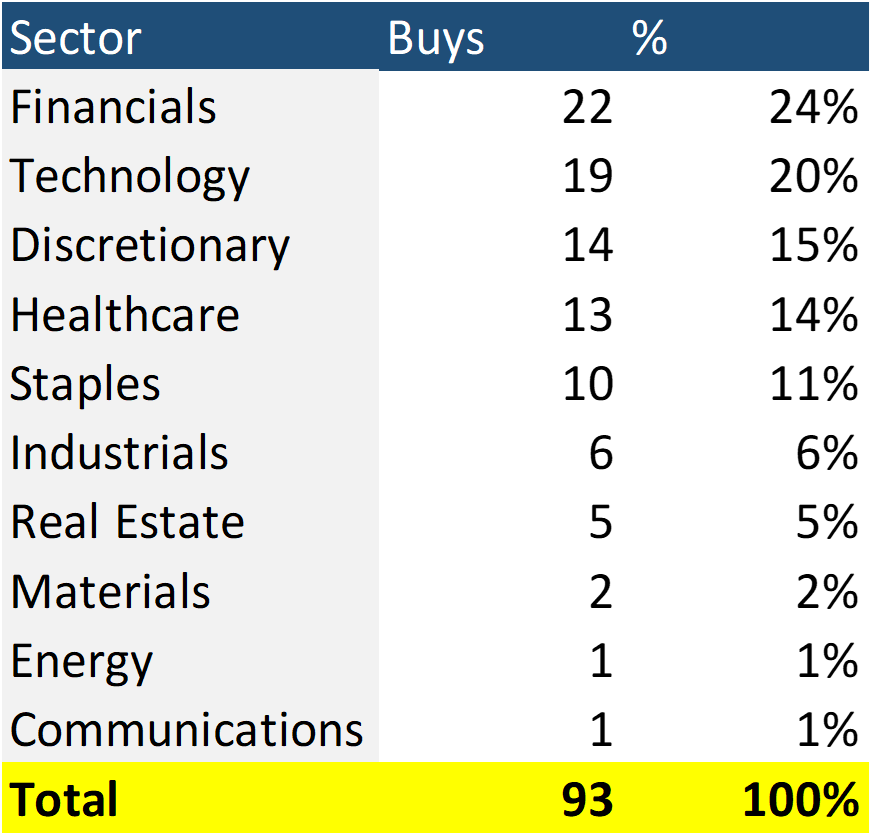
Why am I telling you this? Because to us, that means we might see sproutlings of growth buying in the coming days. The green shoots may come soon for growth stocks. To us, it’s where opportunity is.
We’ve all seen many high-quality growth stocks recently punished into oblivion. A great example would be the ARK Innovation ETF (ARKK), which holds mainly high-growth names. It’s down -17.29% YTD.
Ugly as it may be, that’s exactly the type of area we’ve been picking our buy spots in. So, while the overall market bobs and weaves, just know it isn’t all death out there.
Let’s wrap this up.
Here’s the bottom line: Brace for more stock market volatility. Expect big up and big down moves, and don’t be surprised to get them in the same day!
Be attentive to choppy waters, but keep your eye on the prize. Many prior-prized stocks are flirting with or are at oversold levels. Pick your spots. That’s how we’re doing it because outliers continue to outperform over the long term.
Everything goes through resets occasionally.
We believe most of the pain is behind us… with the NASDAQ down 8% from all-time highs peak to trough, we wouldn’t keep your bear suit on too tight.
And you can hear Jason and Luke discuss all of this in our latest podcast, Are Growth Stocks Ready To Bounce?
Lastly, if you’re looking for some growth stocks on our radar today, check out our latest Best Growth Stocks video for June here: