Stocks Are Heading Lower
Someone once told me something I’ll never forget: “Just come out and say it.”
So, here it goes: “stocks are heading lower.”
Do I think the world is ending? NO.
Do I think stocks will be cheaper near-term? YES.
Here’s why:
Every morning I study our data, looking for stories. It’s my version of a newspaper.
I start asking myself questions like: “what’s really going on?” or “is there a shift?” “What’s coming for stocks?”
Every so often a shift begins that says stocks are heading south. Recent action is such a shift.
There’s no other way to put it. Brace for more volatility.
That statement may scare some people. But, to us at MAPsignals, this will be another great opportunity to scoop discounted stocks. That’s how we’ve done it for years. That’s how we’ve won big. So, that’s how we’ll do it in the coming weeks.
Let’s look over the data.
Big Money Index Says Stocks Are Heading Lower
We need to start from the top. Where is the Big Money going?
Last week’s post, Big Money Index Signals Red, was the beginning of a big rotation in stocks. We mentioned how the Big Money Index was approaching a red light.
We didn’t expect there to be an investing bonus level like we’ve enjoyed in the past. Since that post, the BMI has deteriorated further:
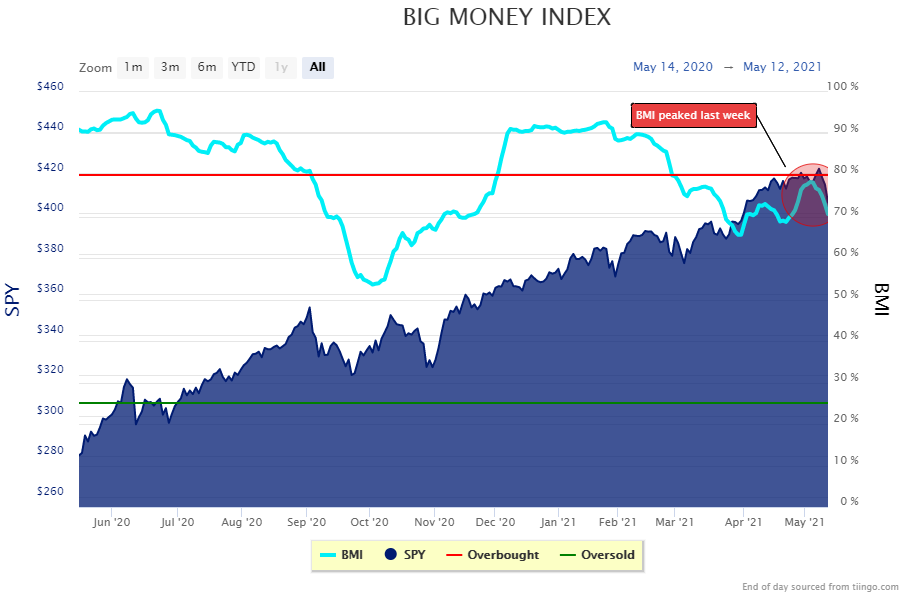
If the Big Money Index could talk it would say: “stocks are heading lower.” (MAPsignals subscribers can follow the BMI in real-time here)
There’s plenty more happening so let’s continue…
Stock & ETF Volumes Are Exploding
Daily volumes help tell the real story with stocks. And volumes are ramping while prices are falling, signaling de-risking.
Below is our Daily Big Money Volumes chart. Those big bars circled to the right show big trading activity according to MAPsignals. We measure it by looking for unusually large volumes to simplify. We can see that stocks and ETFs are seeing a lot of increased trading.
Tuesday & Wednesday (yesterday) saw a massive uptick in trading:
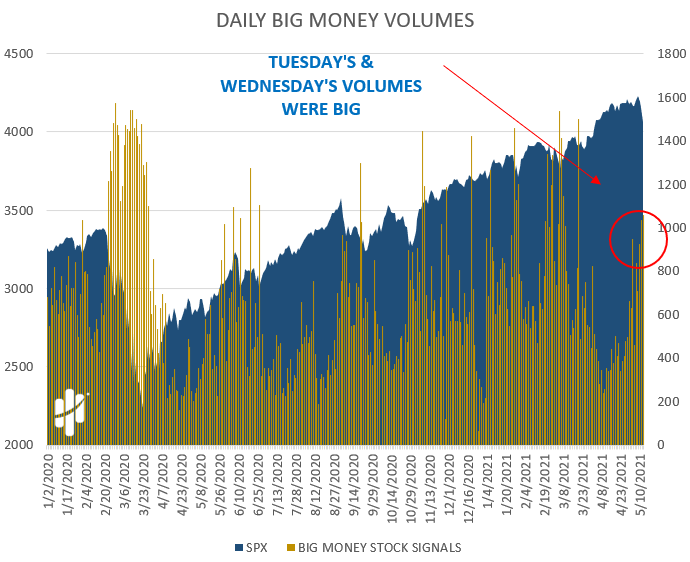
In short- the BMI is falling while stock volumes are exploding. This is another datapoint saying, stocks are heading lower.
Why so? Because when volumes inflate, trends tend to reveal themselves. Recent action simply states that sellers are here. Let’s look.
Below is the Big Money Stock Buys & Sells chart. It plots the daily total of buys and sells in stocks. If selling increases, it will weigh down the BMI.
Yesterday was the single largest day of selling since March 4th:
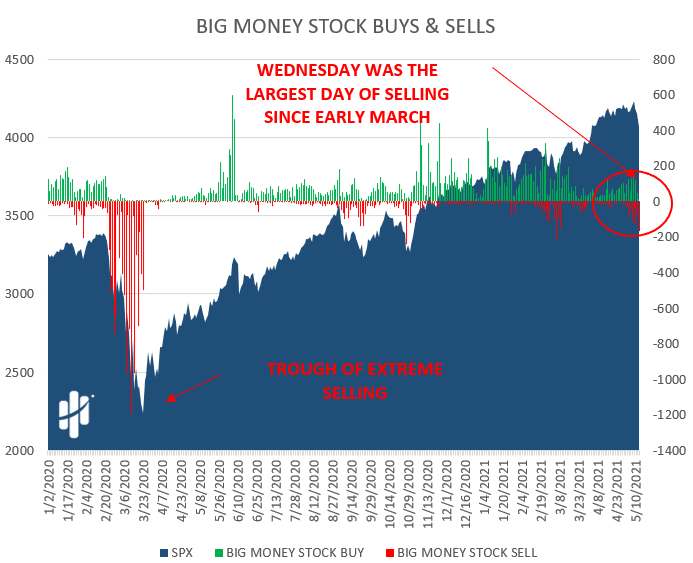
Also, note how buyers were absent yesterday, too:
When the buyers vanish, it’s another tell that stocks will head lower.
What about ETFs? Is there a story there?
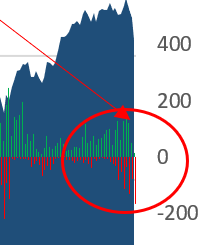
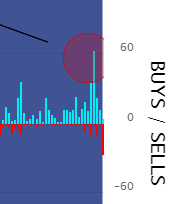
This is where it gets really interesting. Last Friday signaled a bearish data point. There were a lot of ETF buyers. Ironically, that usually signals a near-term peak for stocks.
Check it out:
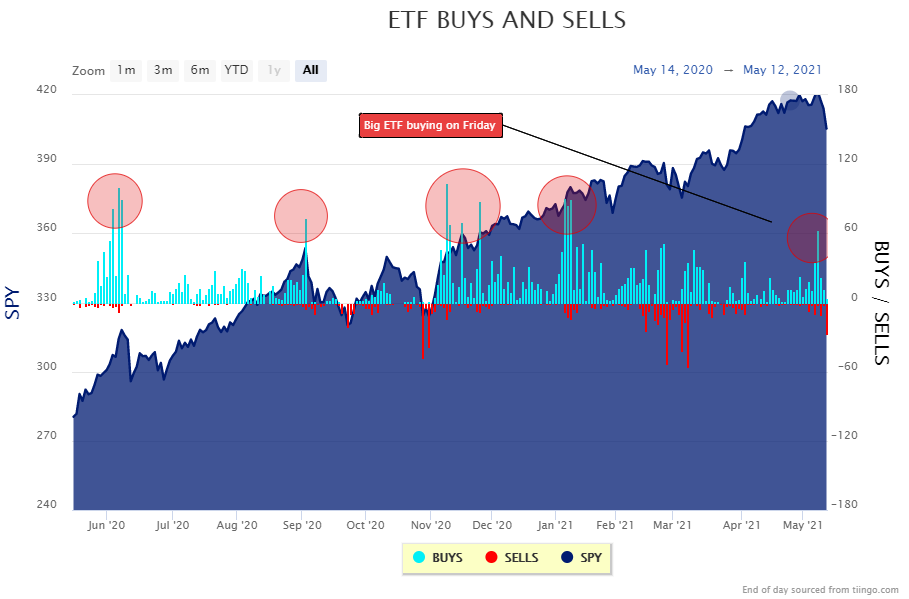
Also notice yesterday’s big red stick:
(this auto-updated chart is available to subscribers here)
I hate to be the bearer of bad news ladies and gentleman, but everything in our data points one direction: lower.
Strap on the helmets. It’s going to be bumpy. That means prepare for up days and down days.
Let’s wrap this all up.
Here’s the bottom line: Stocks are heading lower. This is not the time to freak out and become a sad bear. Nope. It’s natural, needed, and helps refresh the market like the forest floor after a fire.
Be a happy bear. See opportunity like us. Get a game plan.
If selling keeps rising while the BMI keeps falling, that’s going to present a great opportunity to opportunistic buyers. At MAPsignals, we buy outlier stocks on sale. Because, that’s what happy bears do.
MAPsignals is my morning paper with the headline: “Stocks are heading lower.”
The weather section says a storm is likely here. Sellers are whipping up volatility like a nasty thunderstorm.
But the calm after is usually lovely and when things blossom again.
Smart bears ride out the rough winter, slumbering in the safety of a cave. We’re building our buy list now as we hibernate. We use big pullback days as areas to add to great stocks.
We’ll look to resources like the MAP 50 (new one coming out Saturday!) and our weekly MAP 20 reports.
To be clear- we don’t see a bear market, we see a much-needed correction. This is a good time to trim up the fat and sit tight.
But don’t sleep too long.
Eventually Spring season comes. And outlier stocks, like grounded birds, will fly high again.
***ALSO, Luke and Jason will be presenting for the Moneyshow June 11th & 12th in Orlando. The duo will be doing what they do best: Following the Big Money to find outlier stocks.
The best opportunities come when stocks are heading lower!
Come meet them in person! Click the image below to sign-up!