
Coins In The Machine
Back in the ‘80s, arcades were practically a kid’s life. Jean pockets were stretched to the max from being filled with quarters.
Even now as a grown man, it’s hard to fight the urge to plop coins in the machine when I pass one.
One game especially used to catch my eye: for a tiny admission fee, I could get a rush of excitement.

Remember the crane game? The promise of grabbing that prize was irresistible.
And there was always that one kid who somehow always won! I knew one back in my day. She had the right system.
She’d walk up and put her coins in the machine. Then she went to work… she’d shift the joystick moving the claw above the best prize. She’d slowly guide it a tad left…now a pinch to the right. Then… she’d barely nudge it forward…jiggle jiggle. And when she’d look from the front and side with one eye on the dwindling clock, she’d pound the button!
With a release from on high, the claw dove into the cage. A huge smile grew from ear to ear as it came back up with the stuffed animal of choice. Winner, winner- chicken dinner! She had done it again like she somehow always could before!
The game still exists only with much better prizes, and much bigger prices! You can even find PlayStation games in the case!
I was always only interested in the best prize out of the bunch. I didn’t want furry stuffed bears. I’ve always felt: go big or go home.
This is the MAPsignals approach to stocks: find the best and leave the rest We cast a huge net, analyze the entire stock landscape and laser in on only the best companies. That’s how we generate our popular Top 20 list. Each time we do, it’s our way of putting coins in the machine.
Our system was programmed specifically to find the best stocks out there. We tell people: we find the juice.
Grabbing an outlier stock and holding it for years can have a similar effect as the claw-game win. It’s all about winning and having that prize. But how do we win over and over like Betty Sue?
The key is to consistently play a game with positive edge. That’s how we win! And the best part? We get to play this game every single week! We have an endless supply of coins…
Let’s go over how the MAPsignals crane game works.
MAP View Stocks Coins In The Machine
There are seemingly endless ways investors can squeeze juice from the market. Some follow news. We follow Big Money.
We automated a stock-picking system to be like a market arcade game. Only we rigged it to have the odds heavily in our favor: at least that’s been the case over 30 years of live and back-tested data.
We trained our system to spot prized stocks and zero-in on them early. Weekly, our model spits out 20 of the highest quality stocks seeing Big Money buying activity. We hand-pick one from the list to become our weekly Map View stock. Let’s see our stock claw game track record since March 23rd, 2015.
We calculated the performance of each stock adjusted for splits and dividends as if it was purchased on the report date and held until 1/12/2021 close.
Please note: 20 stocks generated no values for returns due to either corporate actions or other various reasons. We manually updated them as of when they ceased trading…we did the same for SPY to keep the study as honest as possible.
Here are the following results:
- Total weekly single stock picks = 273
- +82.59% vs. +52.22% for SPY (S&P 500 ETF)
- MAPsignals outperformance = +58.14%
- 81.3% of picks are positive
(*** performance returns may or may not be possible to replicate! Performance source: FactSet)
That demonstrates a game with positive edge. We also know that as juice!
For us, it pays to keep playing a game where the odds are stacked in our favor. All you need is more than 50% edge. We found much higher than that- so we’ll keep putting our coins in the machine.
This is the precise process that found SolarEdge Technologies, Inc (SEDG) on 4/13/17 which is up +2084% since:
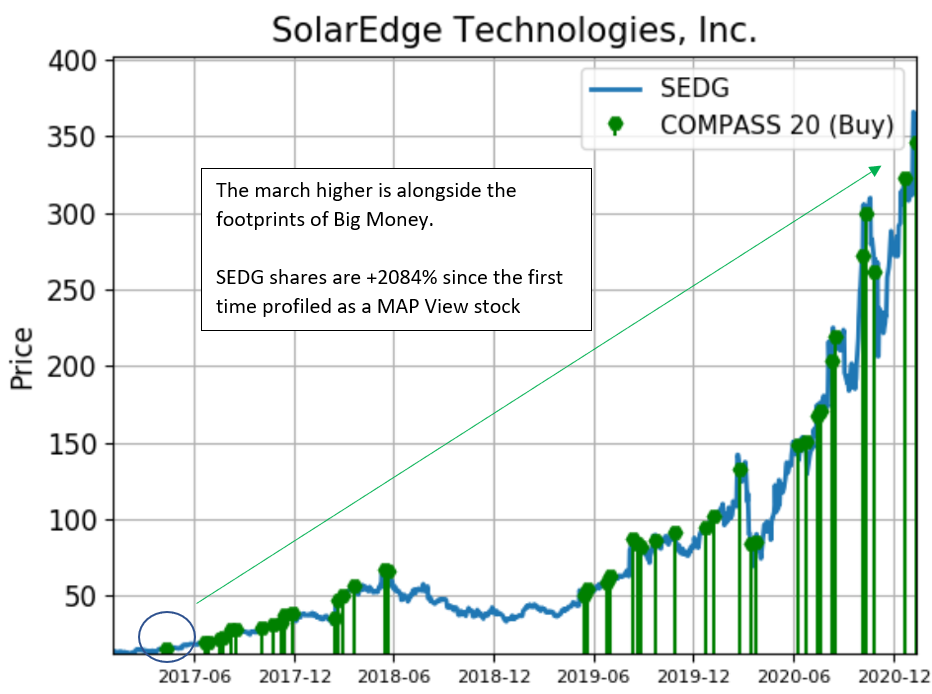
Source: MAPsignals, End of day data sourced from Tiingo.com
Now, let’s look at the performance of all Top 20 stocks through the years.
MAP Top 20 Stocks Claw Game
Our machine picks 20 stocks a week. That can get overwhelming for some. I mean, which one do you pick? It’s the same stare you got as a kid cashing in tickets for prizes. “What can I get for 850 tickets?”
Well, we went back to July 2014 when MAPsignals officially opened its doors.
Like the study above, many stocks returned no performance values. We will try and manually update them in the future. But for this study we will exclude them because there are so many.
Here’s what we found for the thousands of picks in the bunch:
- Total Top 20 stock picks = 6205 (655 tickers excluded from 6860)
- +95% vs. +64% for SPY (S&P 500 ETF)
- MAP outperformance = +48.43%
- 62% of picks are positive
(*** performance returns may or may not be possible to replicate! Performance source: FactSet)
I’ll say it again…positive edge = mega-juice!
Are you curious on the best performing name? I was…
It may come as no surprise, but NVIDIA is our top outlier. It made its first Top 20 appearance on 2/17/15. It’s ripped +2405% since!
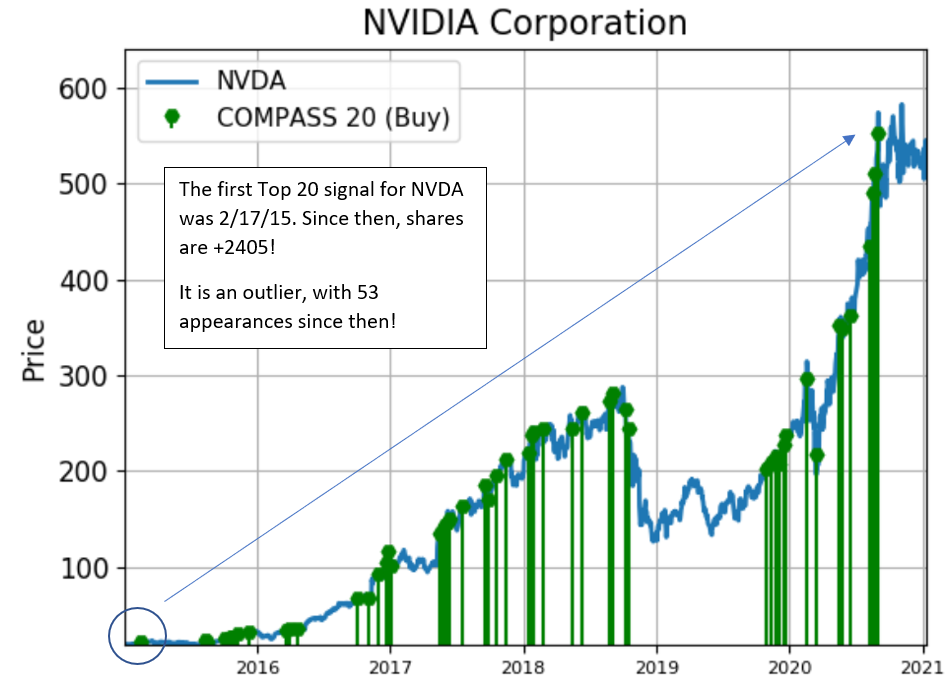
Source: MAPsignals, End of day data sourced from Tiingo.com
Was that a mic-drop? Or a crane drop?
It doesn’t matter because here’s the bottom line: when life shows you a game rigged to the upside, you keep playing. We created our own claw game for stocks heavily rigged in our favor.
That’s why we try to never sell stocks. Our TAGU mantra still stands: They all go up.
Obviously not all of our stocks win huge, or even win at all for that matter. We lose like everyone else. But here’s the key: it only takes a few prized outliers to transform a portfolio.
And a great time to find them is when markets pullback. Now, regular readers know that our data suggests lower stock prices are coming soon. If you missed it, we discuss this in our post “Are We There Yet.”
Also, we chatted on this very topic in our podcast from last week, How To Handle Market Exuberance.
But don’t fear the reaper, because when stocks go on sale, it’s a good thing. It’s similar to when they refill the crane game to the top with new and possibly even better toys. That’s the best time to play!
We decided long ago to spend all of our time playing the most fun game we could find. It helps when history suggests that the system tilts the odds in our favor. So, these days, we are constantly putting coins in the machine. And that’s how we win.
Like an arcade game, investing is not about winning every spin. It’s about finding the game you can win, and exploiting an edge over time.
Handfuls of coins can stretch your pockets. It’s worth it if you come home with a big prize. The MAPsignals claw game has endless coins. And the only stretching we look to do is have outlier stocks stretch our portfolios…
Grab some coins and remember above all… have fun!