
Deja Vu All Over Again
Baseball hall-of-famer Yogi Berra had a way with words. One great “Yogi-ism” was when he said: “it’s like déjà vu all over again.”
We’ve all had that moment like we’ve experienced the exact thing before.
In the movie “The Matrix”, déjà vu was a signal that something changed and the bad guys were about to show up. It was a signal; a glitch.
No one knows how or why it happens. Some believe déjà vu is stress triggered. Or maybe it stems from sleep deprivation. Some get spooky and think it’s paranormal. Others get out-there and even attribute it to a parallel universe!
Whatever déjà vu is, it can seem like a glitch or malfunction.
I don’t know about you, but when looking at markets, especially when they are cranky, I can get déjà vu all over again.
When markets get volatile but data gets quiet in times like now, it brings reminders of amazing buying opportunities for pummeled stocks.
Join me in some déjà vu all over again. Let’s start by looking at some Big Money data…
Big Money Index Déjà Vu All Over Again
Market activity is very light, meaning volumes have been low, leadership is thin, and signal counts have dropped.
Only a handful of stocks are breaking out with Big Money buying. That, coupled with even a little selling causes the BMI to weaken:
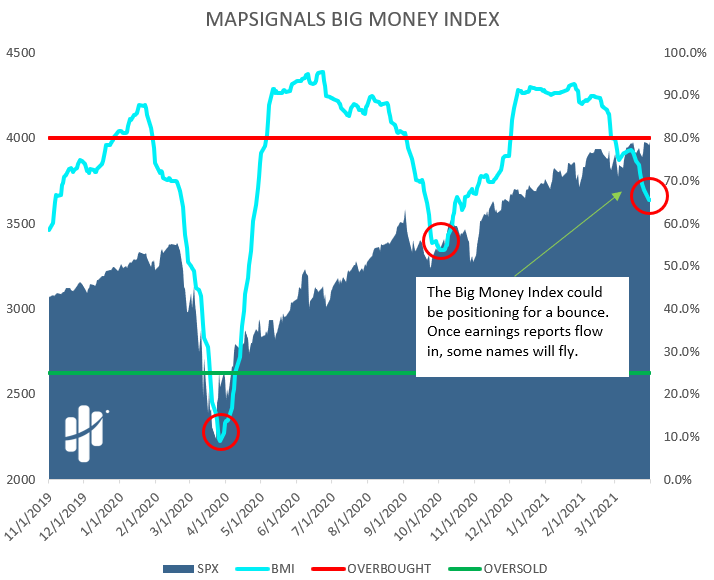
You can clearly see above that the BMI has been much softer for weeks now.
In fact, the BMI is at levels not seen since October. That’s when we dealt with issues like COVID fears, election jitters, and stimulus… to name just a few. But hidden in that noise was a powerful signal.
Even in that unprecedented time was a déjà vu all over again. But it wasn’t some “feeling”… the data said so.
Back then, we compared it to a harvest moon: where clarity appears during the night. Out of nowhere, the buyers quietly showed up and illuminated the market from darkness.
Recent Big Money data looks like it might bring an eerily similar setup. Meaning: a similar signal on the horizon wouldn’t surprise us. We can see that potential on a plain old chart: Market dips are getting more and more shallow.
Stocks Have Been Quiet For Weeks
Stocks are flopping around like fish. One day traders hate growth and love “reopen” stocks.., Then the next, they sell those and buy growth. And dividend stocks are flying high.
The disjointed market is a mixed signal looking week after week. But, taking a step back we realize that a new earnings season is about to start. Then a clear pattern emerges.
Buyers usually show up once earnings reports start trickling in. And this earnings season should bring monstrous year-over-year comparisons. Below you can see what I mean.
This is cool: In the Big Money Stock Buys & Sells chart below, I’ve circled each new quarter beginning. One thing that should immediately jump out is that markets tend to be quiet between earnings season. Then juice happens:

While it’s only a years’ worth of data, it certainly makes sense from a data standpoint. There are huge winners during earnings season. Memories of stock profits will return to investors… déjà vu all over again.
And we always get déjà vu all over again in outliers…
Looking For Deals On Outlier Stocks
When stocks pullback, uninformed investors can get bummed out. Because when market stress hits, it’s hard to be positive and find a reason to own them.
Investors start second guessing themselves. They listen to stories of growth slowing, loss of competitive ground, or heaven forbid: a prominent bank downgrade! Déjà vu.
But when you know what the déjà vu means, like in The Matrix, you know what to do.
Look at the following charts of 2 outlier stocks from our research. You can see a pattern: Outliers don’t really care about quiet periods, elections, trade wars, downgrades, or anything. Outliers are outliers.
They generally have somewhere to go, and that’s up. Below we see charts of MAPsignals favorites Adobe, Inc. (ADBE) and Veeva Systems, Inc. (VEEV).
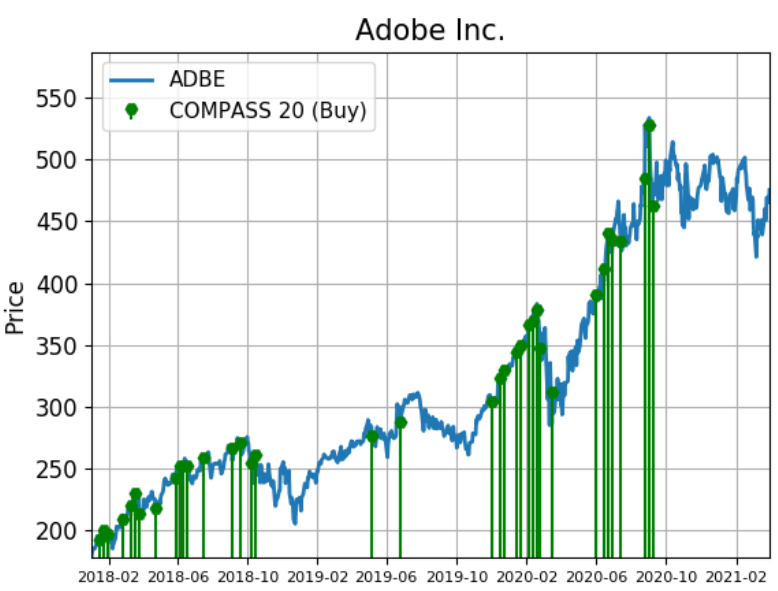
Source: MAPsignals, End of day data sourced from tiingo.com
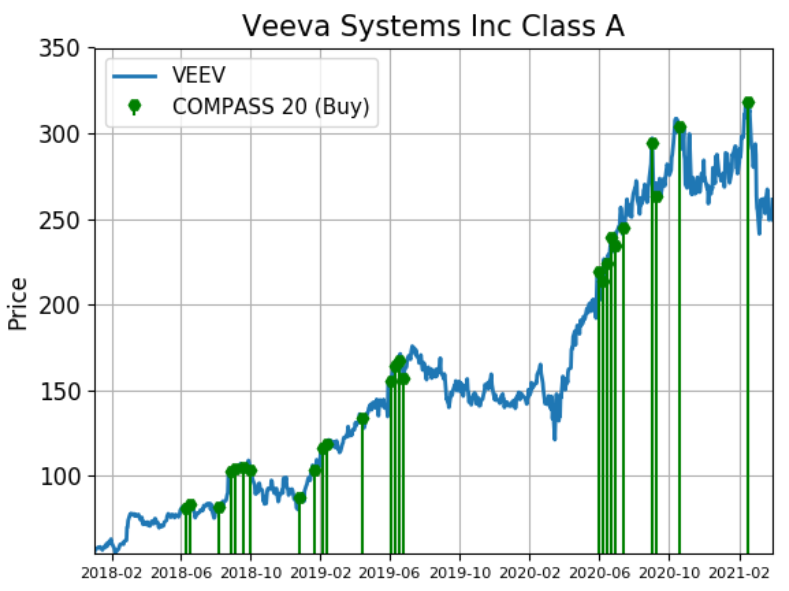
Source: MAPsignals, End of day data sourced from tiingo.com
Notice they do take breaks, but the trend is clear. When Big Money buys the best stocks, they tend to become outliers. And outliers tend to act independent of markets over the long run.
That’s why they can bring spectacular returns over time. Because they don’t care about the noise.
At MAPsignals when we look at these outlier charts over and over, we get déjà vu all over again…
So, let’s tie this all together.
Here’s the bottom line: We suggest you start preparing now for earnings season upside. History says to start getting bullish. Use periods like now to go shopping for amazing stocks taking a break during a lull.
MAPsignals subscribers: consider revisiting the MAP 50 and our platinum video update from March 19th.
As we head into a new quarter for markets, don’t be caught off-guard when the rally finally comes. Take the time now and get those buy tickets out.
Outliers rarely stay down for long.
Yogi put is simply: It’s déjà vu all over again. He also said: you can observe a lot by watching…
For even more in-depth discussion on recent market events: Check out our latest podcast, Archegos Liquidation & Memories from the GFC, to hear Jason and Luke chat. In it, they go over the recent hedge fund liquidation in detail and how it brought deja vu all over again of handing liquidations during the Global Financial Crisis.
And also know that we are doing 2 monthly videos on our YouTube channel: Best Growth Stocks & Best Dividend Stocks. After doing them in text format for years, the time has come to do it live. Check them out to learn more about our process and why quality always wins over the long-term.