• Menu
  • Skip to right header navigation
  • Skip to main content
  • Skip to primary sidebar
  • Skip to footer

MAPsignals

We map big money.

  • Latest Insights
  • Power of MAP
    • MAP Products
    • MAP System
    • MAP White Papers
    • Videos & Interviews
  • Profit with MAP
  • About
    • About MAP
    • MAP Team
    • Authors
    • MAP System
    • MAP Products
    • Big Money Index
  • Members
    • Get Started With MAP
    • My MAP
    • Big Money Charts
    • MAP View
    • MAP View Options
    • MAP Top 20 Weekly
    • MAP 50
    • Member Updates
    • Platinum Updates
    • Members Only Posts
    • Performance
  • Portal

Harvest Moon

October 8, 2020 //  by Lucas Downey//  3 Comments

The harvest moon is the final full moon before the season changes.

It’s the point where the moon is the closest to the Earth – making it appear big and bright.

harvest moon

We had one last week on October 1st. I went outside with the family and pulled up a chair. The glow allowed for great vision. I was imagining the harvests from years past, when such a night made gathering crops that much easier.

You can bet that farmers from centuries ago would plan for these events. Knowledge was passed down from generation to generation about what’s coming next…a new season of change.

Stocks also have periodic shifts. At MAPsignals, our data can signal changes and pivots. And while some shifts in our data can be hugely epic like a harvest moon (like in March), there are other times when subtle indicators predict a new stock market attitude.

That’s what’s been happening recently.

The Big Money looks to be changing seasons.

Big Money Index Prepares For North

Over the past week and a half, our data has indicated a slowing of selling. Last week we pointed out how Big Money selling was slowing in our post, Evergreen Trees. When sellers become fewer, the buyers can show up.

I’ll get to that in the next section, but first let’s see where the Big Money Index stands:

big money index

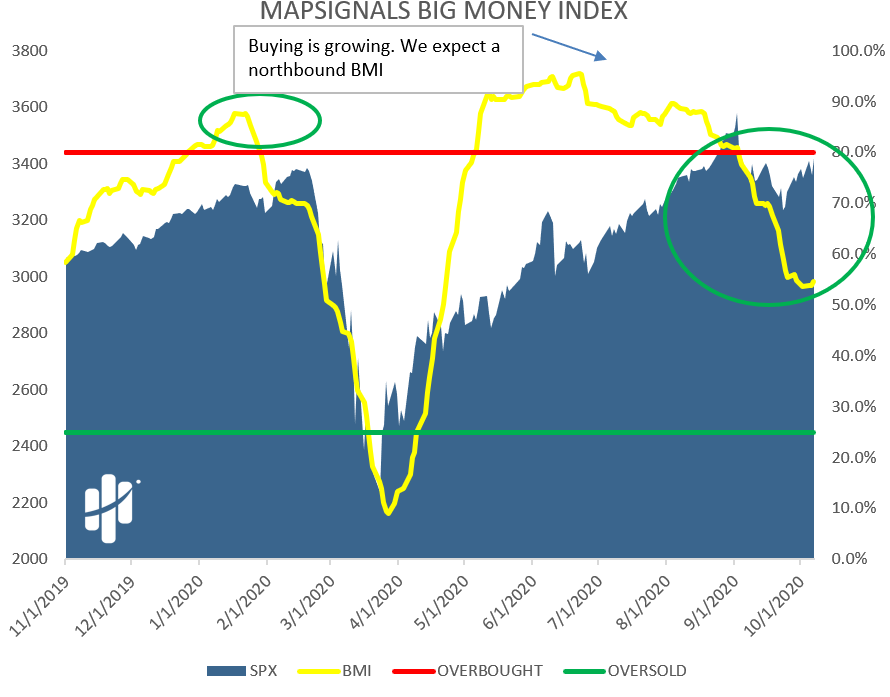
Off to the right you can see that the index is flatlining. Buyers are slowly overpowering sellers. When that happens, the BMI rises. And that paints a picture of higher prices ahead for markets.

But what other clues do we see that support a changing tide for stocks?

Big Money Buyers Grab Stocks During Harvest Moon

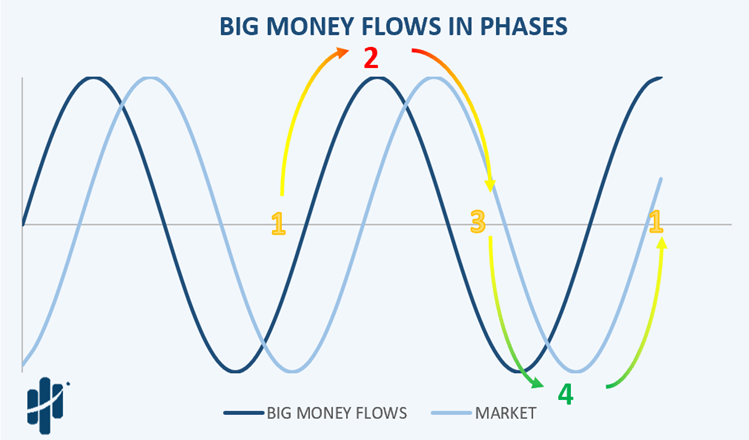
Rarely is a trend made or changed in a day. Usually it’s a process.

It goes like this: Supply overwhelms demand, then supply slows, then demand takes over. Once demand is in charge, look out above! Here’s a visual:

big money flows in phases

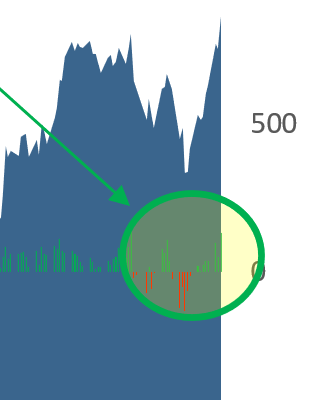
But check out the daily Big Money Stock Signals. This morning showed juicy buyers.

Green bars mean buyers won the day and red means sellers did:

big money stock signals

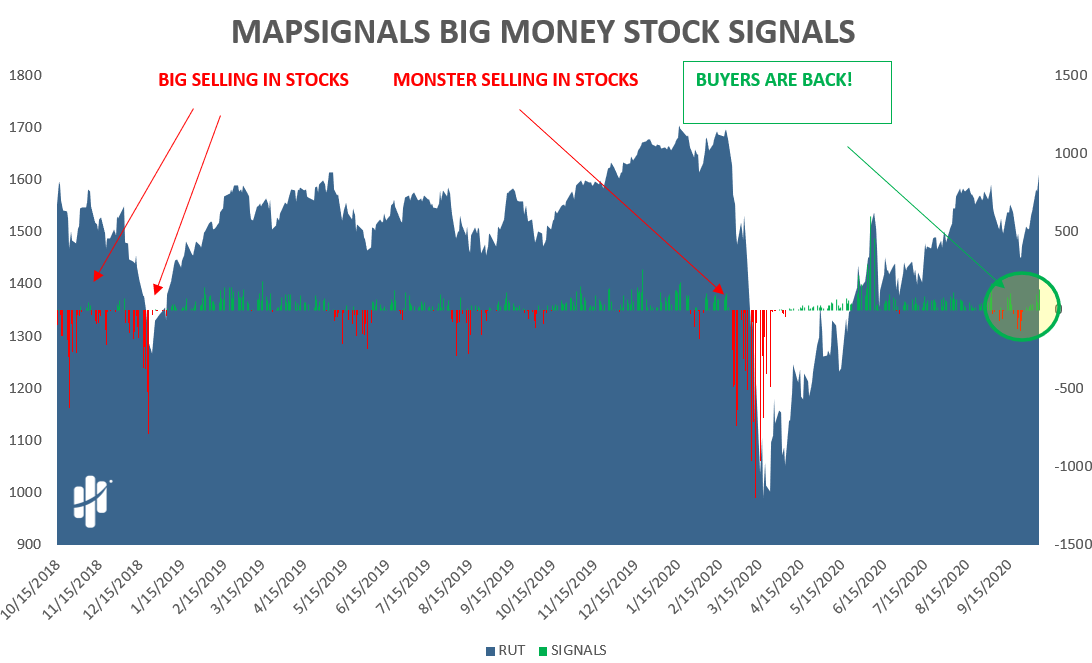
Let’s go ahead and zoom in on the right. The green is fresh money ripping stocks higher. It’s also known as juice.

The red bars didn’t last long…those were the weak hands from 3 weeks ago.

big money stock signals zoom

The red bars are the Tech wreck that most people will forget in the coming weeks. We believed most of that “noise” was from day-traders learning the ropes…ie getting margin calls. Dip buyers came and saved the day.

Looking at it from this angle, it’s suggesting a changing season…maybe it’s the harvest moon signal. We delve into this recent data shift in our podcast from Tuesday.

Follow us on Spotify!

SpotifySpotify

So, where do we go from here?

Signals are saying that stocks are getting bought up. And that’s all we need to know from a data standpoint. Negative news is shrugged off within 2 days in this market. That’s telling us that great stocks are the place to be.

MAPsignals finds the great ones.

The bottom line is this: an election year tends to bring a lot of volatility. The last few weeks are proof of that. We’ve been saying to not get too bearish…buy the dip is alive and well.

Market headlines can leave investors scratching their head. We suggest you don’t do that.

What goes on under the surface of the market oftentimes shines through all of that cloudiness.

JUST A HEADS UP – we received a lot of great feedback on the podcast from yesterday. We will be answering many of those questions in a future episode.

Don’t be shy – leave us a comment or reach out with thoughts you may have.

Lucas Downey
Lucas Downey

Lucas is co-founder of MAPsignals. His full bio can be found here.
Prior to MAP, he was Head of ETF Sales at Cantor Fitzgerald & SVP of Derivatives at Jefferies, LLC.

Spread the word!

Category: All, Big Money Insights Weekly

Previous Post: «big money podcast Big Money Podcast Ep. 1 10-6-2020
Next Post: Know Yourself – Big Money Podcast Ep. 2 »

Reader Interactions

Comments

  1. Rising Star

    October 8, 2020 at 10:43 am

    Is it time to jump in to buy or do you think we should wait until close to Election Day?

    Reply
    • MAPsignals Staff

      October 8, 2020 at 12:26 pm

      Hey Rising Star –

      There will likely be more volatility up until election day. Earnings season has started, too.

      We can’t give personalized advice.

      That being said, we’ll be keeping our eyes peeled for the outliers seeing the big money.

      Reply
    • Peter

      October 9, 2020 at 8:06 am

      Election means certainty, doesn`t matter much who wins !
      There are a big Corona-Winners out there, I did buy the dips
      since 1987 and done very well so far !

      Reply

Leave a Reply Cancel reply

Your email address will not be published. Required fields are marked *

Primary Sidebar

Get Big Money Insights for FREE

Want to know where the Big Money is headed?

Just enter your email address below. You'll get our FREE NEWSLETTER sent directly to your inbox.

We call it Big Money Insights... It’s your weekly sneak peek at the powerful market-moving forces that are hidden from 99% of investors.

"*" indicates required fields

This field is for validation purposes and should be left unchanged.

Categories

  • All
  • Big Money Insights Weekly
  • Big Money Series
  • Macro Insights
  • MAP In The Media
  • Members Only
  • Performance
  • Podcast
  • Special Reports
  • Stocks
  • Videos & Interviews
  • White Papers

Archives

  • February 2023
  • January 2023
  • December 2022
  • November 2022
  • October 2022
  • September 2022
  • August 2022
  • July 2022
  • June 2022
  • May 2022
  • April 2022
  • March 2022
  • February 2022
  • January 2022
  • December 2021
  • November 2021
  • October 2021
  • September 2021
  • August 2021
  • July 2021
  • June 2021
  • May 2021
  • April 2021
  • March 2021
  • February 2021
  • January 2021
  • December 2020
  • November 2020
  • October 2020
  • September 2020
  • August 2020
  • July 2020
  • June 2020
  • May 2020
  • April 2020
  • March 2020
  • February 2020
  • January 2020
  • December 2019
  • November 2019
  • October 2019
  • September 2019
  • August 2019
  • July 2019
  • June 2019
  • May 2019
  • April 2019
  • March 2019
  • February 2019
  • January 2019
  • December 2018
  • November 2018
  • October 2018
  • September 2018
  • August 2018

Follow us on Twitter

MAPsignals Follow 1,434 1,061

MAPsignals is a data platform that tracks institutional money flows in stocks and ETFs. Sign up for free insights here: https://t.co/SaAVHjKC9J

mapsignals
mapsignals avatar; MAPsignals @mapsignals ·
47m 1621476848990359552

Pendulum has swung

Helene Meisler @hmeisler

Highest volume for the QQQs since 12/13

Reply on Twitter 1621476848990359552 Retweet on Twitter 1621476848990359552 0 Like on Twitter 1621476848990359552 0 Twitter 1621476848990359552
Load More...

Footer

© 2021 Mapsignals.com

  • Home
  • Contact & Disclaimer
  • Privacy Policy
  • Terms & Conditions
  • Opt-out preferences
  • FAQ

Copyright © 2023 · Mai Law Pro on Genesis Framework · WordPress · Log in

✕
What Happened to Risk Assets White Paper is Here

Get your copy here and take a journey through our thoughts on margin and leverage.

Enter your email address below and you'll get our FREE NEWSLETTER sent directly to your inbox. 

 We call it Big Money Insights... It’s your weekly sneak peek at the powerful market-moving forces that are hidden from 99% of investors.

MAPsignals
Manage Cookie Consent
We use cookies to optimize our website and our service.
Functional Always active
The technical storage or access is strictly necessary for the legitimate purpose of enabling the use of a specific service explicitly requested by the subscriber or user, or for the sole purpose of carrying out the transmission of a communication over an electronic communications network.
Preferences
The technical storage or access is necessary for the legitimate purpose of storing preferences that are not requested by the subscriber or user.
Statistics
The technical storage or access that is used exclusively for statistical purposes. The technical storage or access that is used exclusively for anonymous statistical purposes. Without a subpoena, voluntary compliance on the part of your Internet Service Provider, or additional records from a third party, information stored or retrieved for this purpose alone cannot usually be used to identify you.
Marketing
The technical storage or access is required to create user profiles to send advertising, or to track the user on a website or across several websites for similar marketing purposes.
Manage options Manage services Manage vendors Read more about these purposes
View preferences
{title} {title} {title}