
Don’t Fear an Overbought Market
Stocks are off to a strong start in 2023. The S&P 500 has jumped 8% YTD, mainly powered by growth-heavy groups like Technology and Discretionary.
The ongoing surge in stocks has pushed our Big Money Index into overbought territory, which could worry some investors. But today’s message is simple: Don’t fear an overbought market.
Look, investors have enough to worry about these days: potential recession, high interest rates, slower growth, and more. A market in the red zone will be one less item to stress on.
Today I’ll show you where our data stands and more importantly where we’re likely headed. I’ll demystify the historical trend of an overbought BMI, and show you why you need not fret.
Let’s get to it!
Don’t Fear an Overbought Market
Overbought markets are defined as excessive buying. Compared to 2022’s downdraft, this year certainly fits that case. Last week our data triggered our first overbought signal since August.
To reach an overbought signal there needs to be plentiful inflows in stocks. There has been, which you can see with the Big Money Index chart below.
I’ve highlighted the latest red zone appearance off to the upper right:
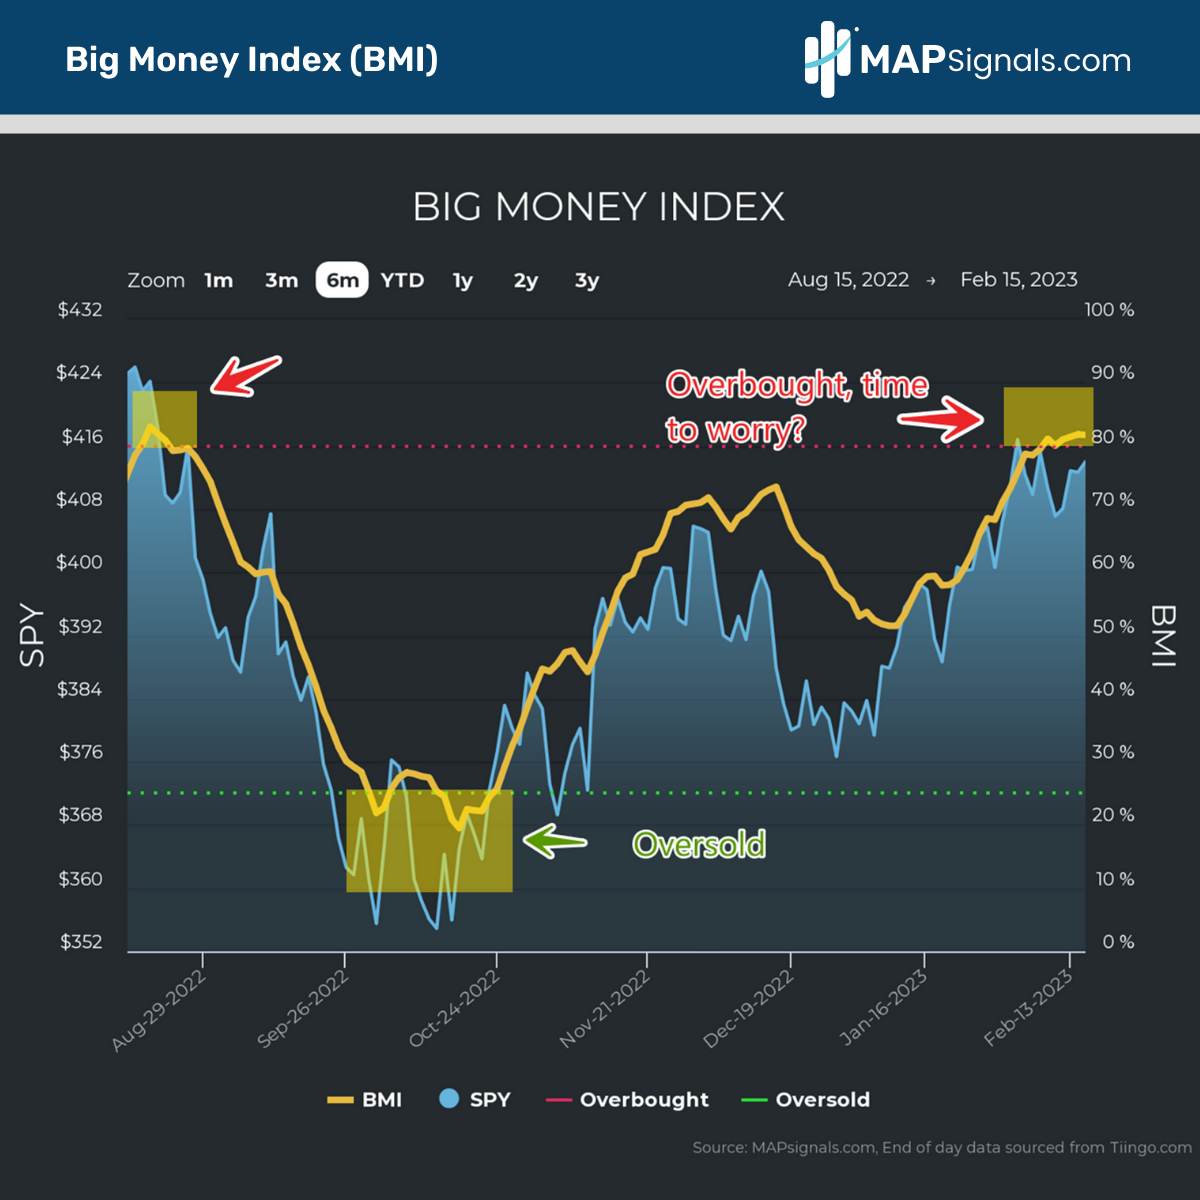
The BMI is our top-level indicator of the overall health of buying and selling. When inflows outstrip outflows, the BMI trends higher. Here’s a glimpse at the relentless inflows in 2023.
YTD buys have accounted for 85% of our signals:
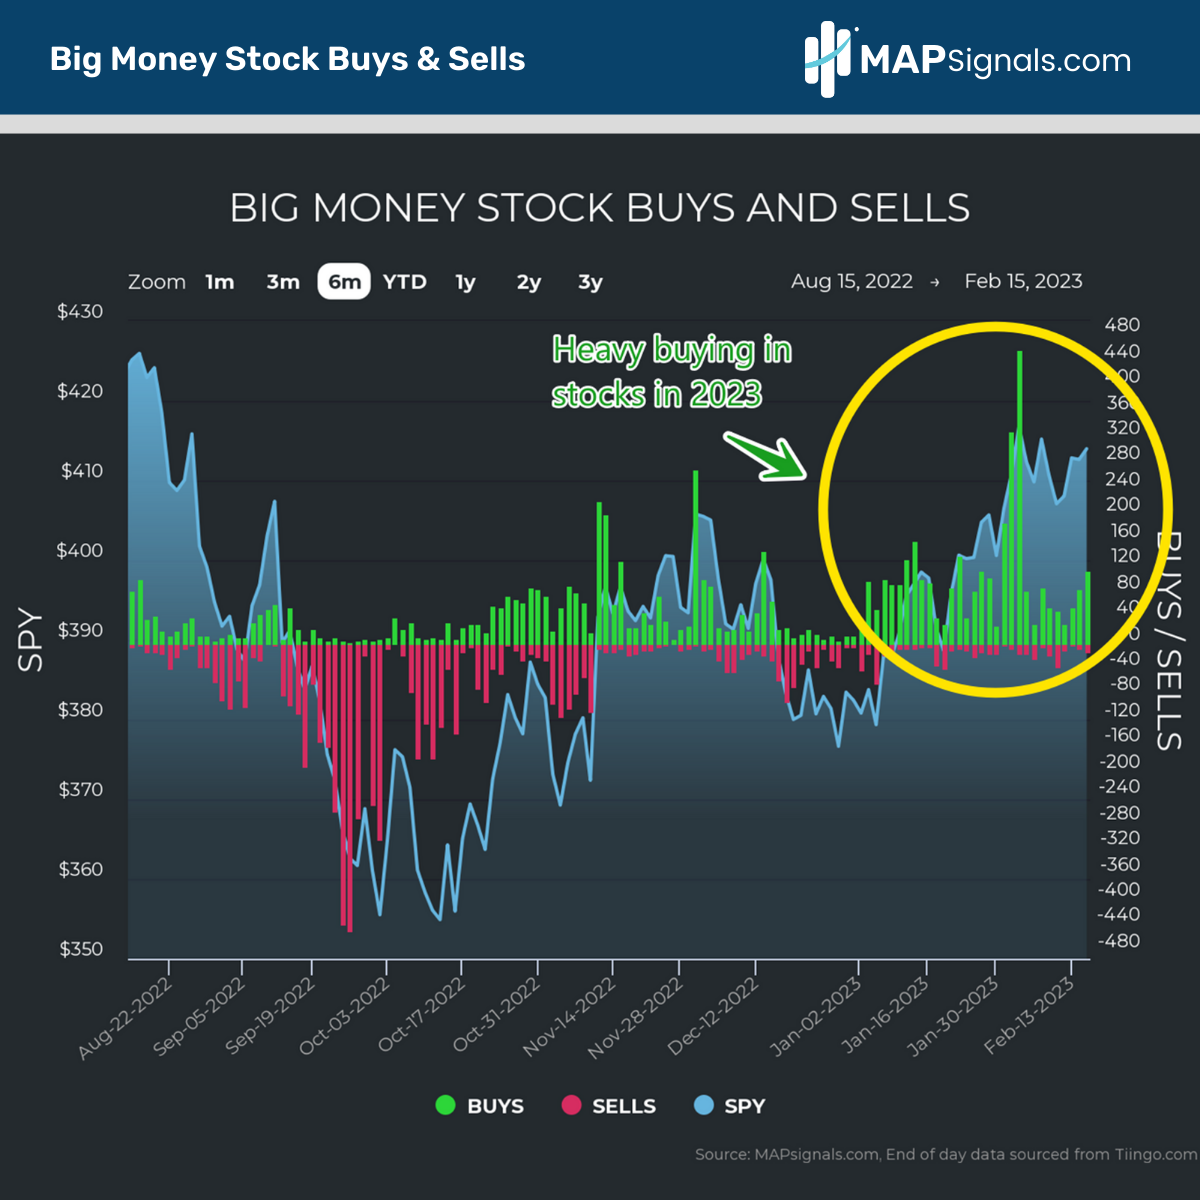
The big green bars reveal that buyers are in control. Selling (red bars) have evaporated. This level of accumulation is what it takes for a rare overbought signal to hit. Now, let’s look at prior overbought instances and see if there’s reason to head for the hills.
History of Overbought Markets
When the word overbought is uttered, some traders believe a crash is coming. The data just doesn’t support that narrative.
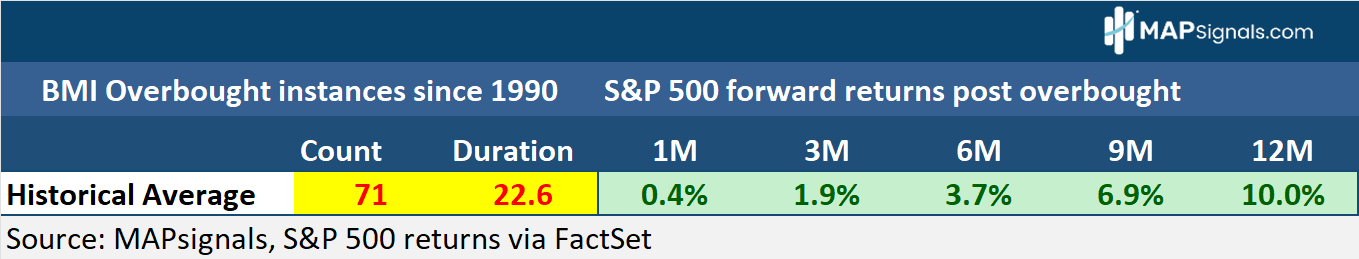
Going back to 1990 (including back tested data) our Big Money Index has triggered overbought 71 times. Interestingly, the average duration of the red zone is 22 trading days, or about 4 weeks. More importantly, if you believe forward market returns are negative on average, you’re wrong.
Below, plots the forward 1-month through 1-year average returns of the S&P 500 post breaking into the 80% BMI reading. A month later, stocks are up a modest .4% and a year later equites clock a gain of +10%.
Those 5 words are ringing louder: Don’t fear an overbought market!
This is just a snapshot. If you’re interested in a deeper dive on this study, members can read it here in our latest MAP View report.
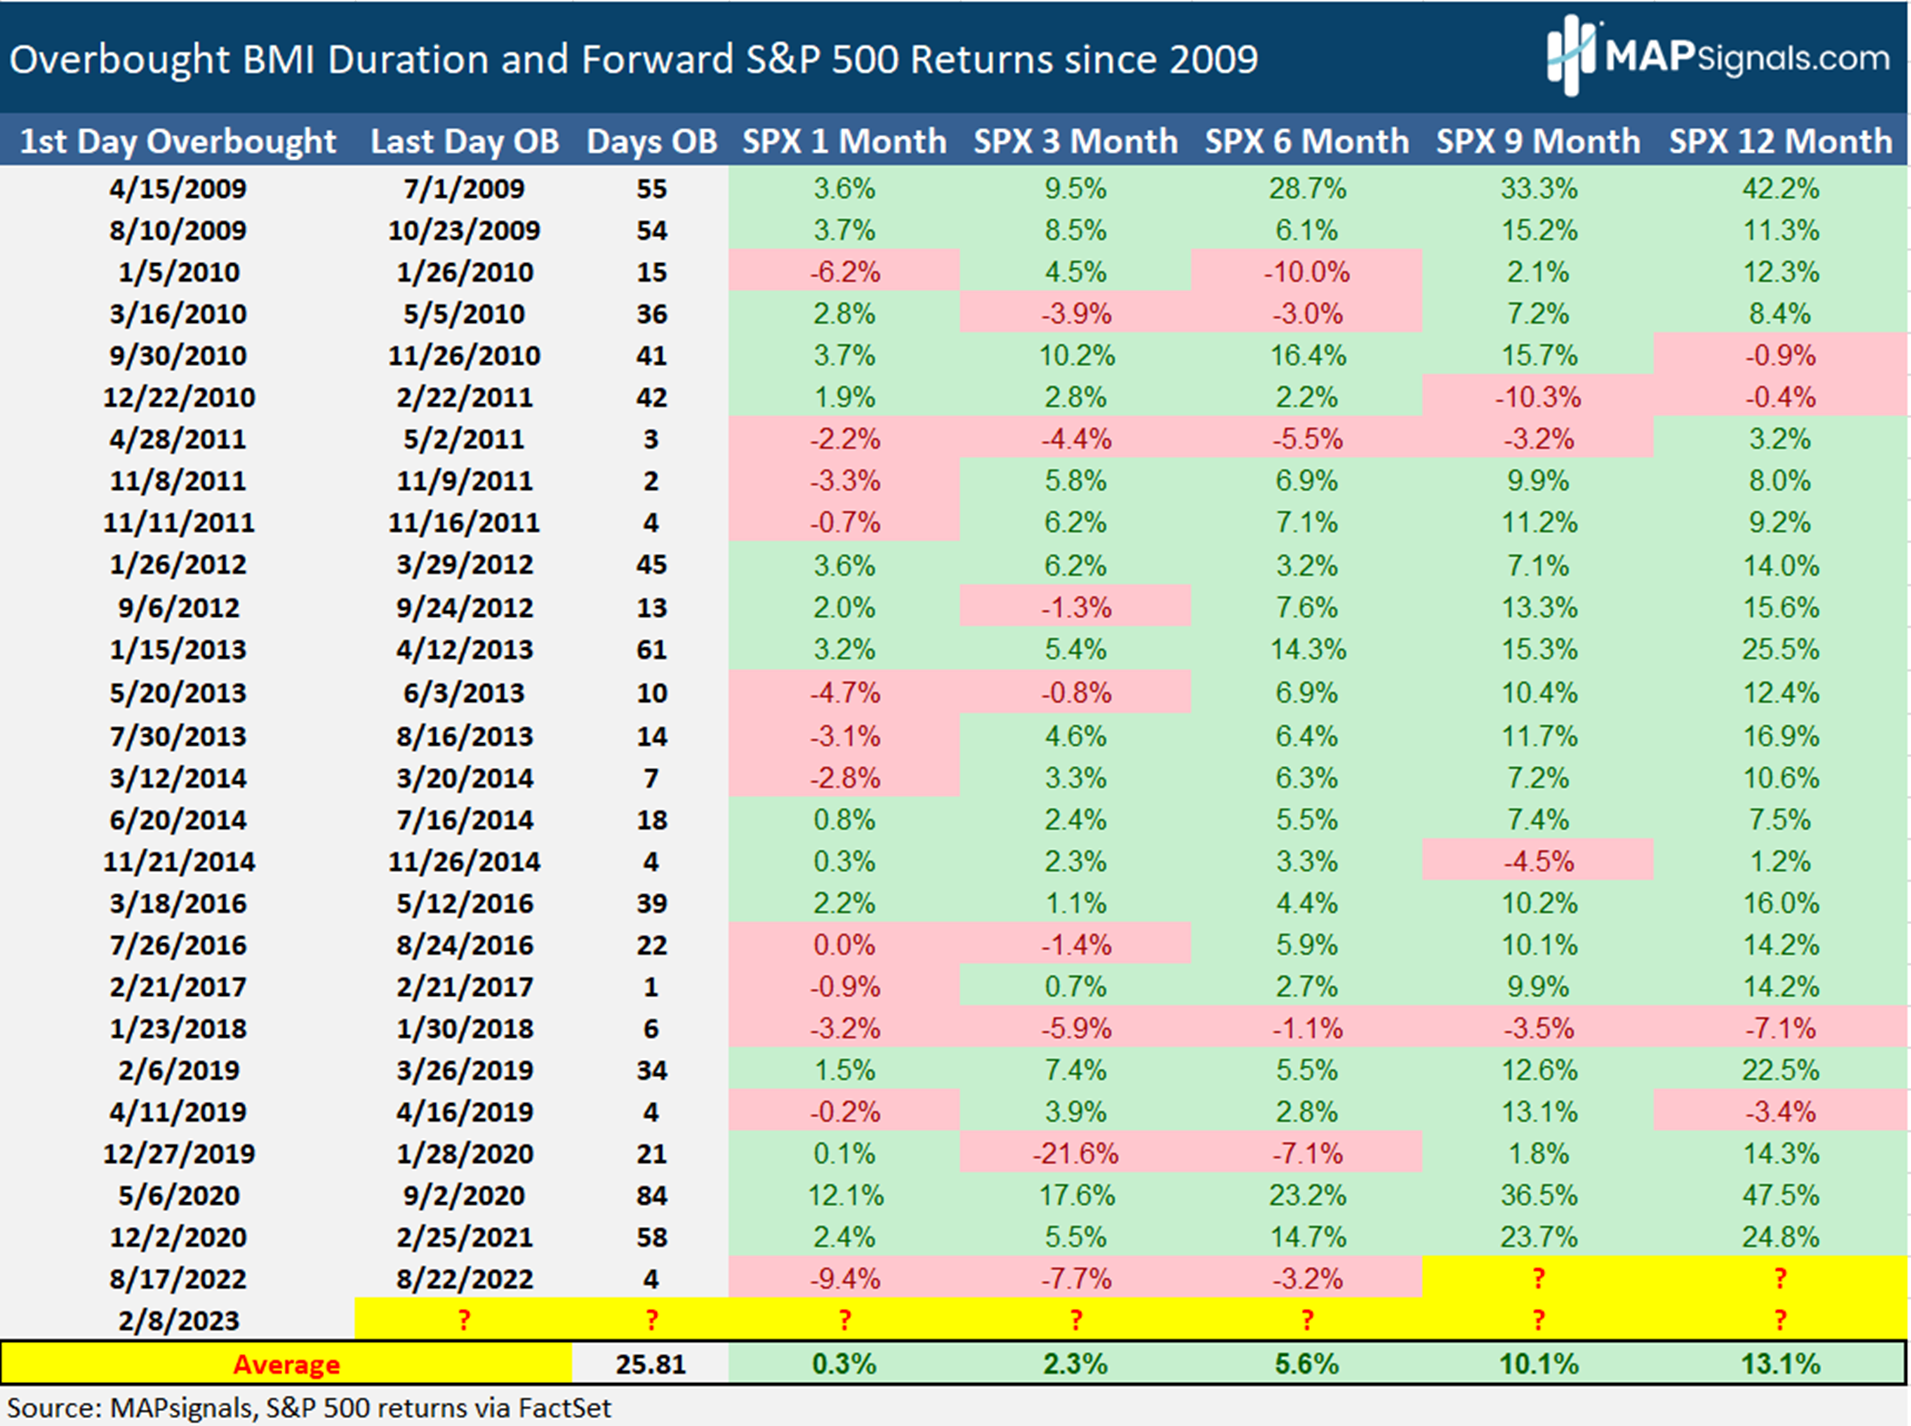
Let’s keep going and zero-in on more recent data. Below breaks out all overbought periods post 2008. There’ve been 27 overbought instances.
A month later, markets gain a measly .3%, however a year later stocks average a solid performance of +13%. The overbought duration jumps to 26 days, or roughly 5 weeks.
These aren’t the type of monster gains you can expect after an oversold signal, but they’re still impressive:
So, does this mean we have the all-clear signal in stocks? NO. This study simply shows that in the coming weeks, stocks could return modest gains, and likely dip before resuming its upward trajectory.
Following the BMI’s next move is the key to when this overbought market will turn. So, don’t worry – follow the data!
Let’s wrap up.
Here’s the bottom line: Stocks are overheated. But history says don’t fear an overbought market. A year later, stocks are up double digits on average.
Odds are we have a few more weeks in the red zone. Get a game-plan now.
Pick your spots and focus on the best companies with strong earnings growth and institutional support. The MAPsignals process can help.
Have a great week!