
Don’t Rule Out New Highs
People can’t believe the S&P 500 was up 7.5% in Q1, never mind the NASDAQ’s sizzling 21% pop.
Both institutional and retail sentiment remains downbeat. Cash on the sidelines just hit a record $5.1 trillion, up from the prior $4.8 trillion peak at the height of the Covid panic in April 2020.
Today’s macro write-up builds a simple case: Don’t rule out new highs.
In December, I told you Stocks May Do Better Than You Think in 2023. Today, I’ll reinforce that stance and show you why stocks can keep going up. Then I’ll show you the areas to overweight to take advantage of the move.
Don’t believe the hype. Stay long stocks.
Alright, let’s hop to it.
Goldilocks Makes a Comeback
Wall Street loves goldilocks – growth strong enough to create jobs and support corporate profits, but not so hot it stokes inflation. Falling prices give the Fed room to stop raising rates, reducing the odds that tighter monetary policy sparks a sharp recession. The goldilocks economy isn’t too hot or too cold, it’s just right.
Despite all the recessionary handwringing, the economy and the consumer are hanging in there. Growth is slowing but a deep, earnings-bruising recession seems unlikely. The bears keep underestimating the economy’s dynamism. That’s rarely a smart move. This isn’t Russia.
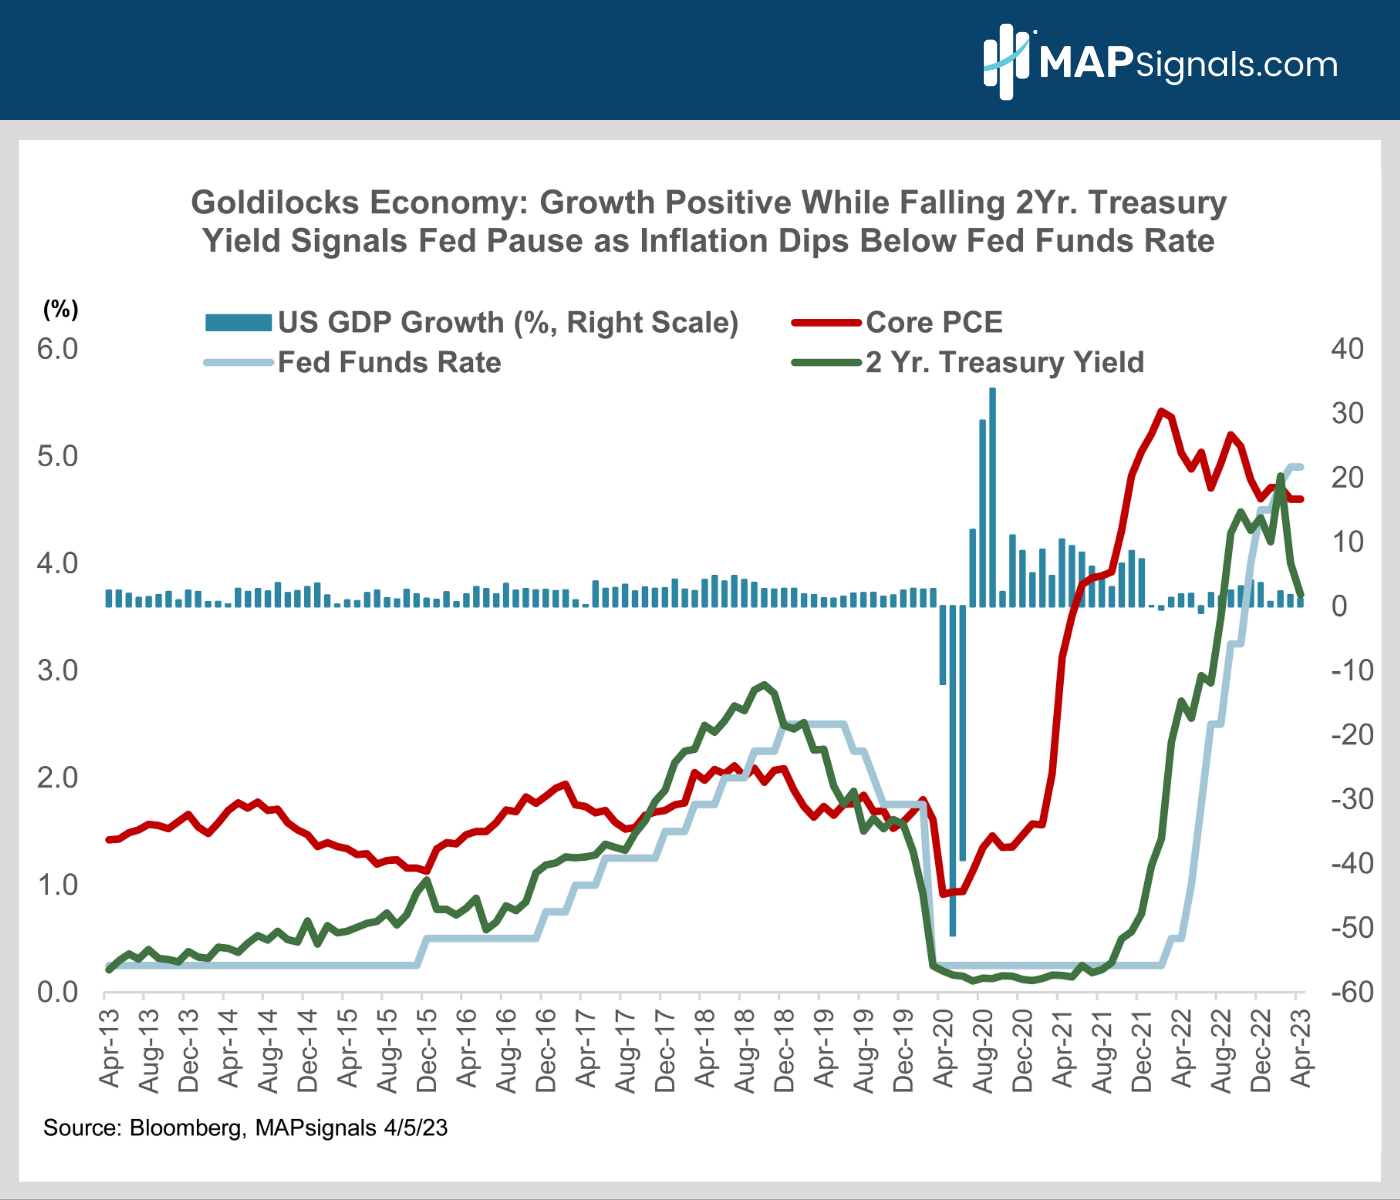
Check this out. The Atlanta Fed’s GDPNow tracks the US economy in real-time. The latest reading estimates 1.7% Q1 real GDP growth. Meanwhile, at 4.9%, the Fed Funds rate is now above core PCE at 4.6%. Core PCE is the Fed’s favored inflation gauge.
All this has 2-year yields – the best market proxy for the future path of the Fed funds rate – down to 3.8% from 5% a month ago (chart). A dovish Fed makes a hard landing less likely:
You’re probably wondering how recent regional bank stress impacts the macro-outlook for stocks?
The news here is better than you think.
The bear case is tighter credit will torpedo the economy and earnings. Not so fast. Check out this next chart.
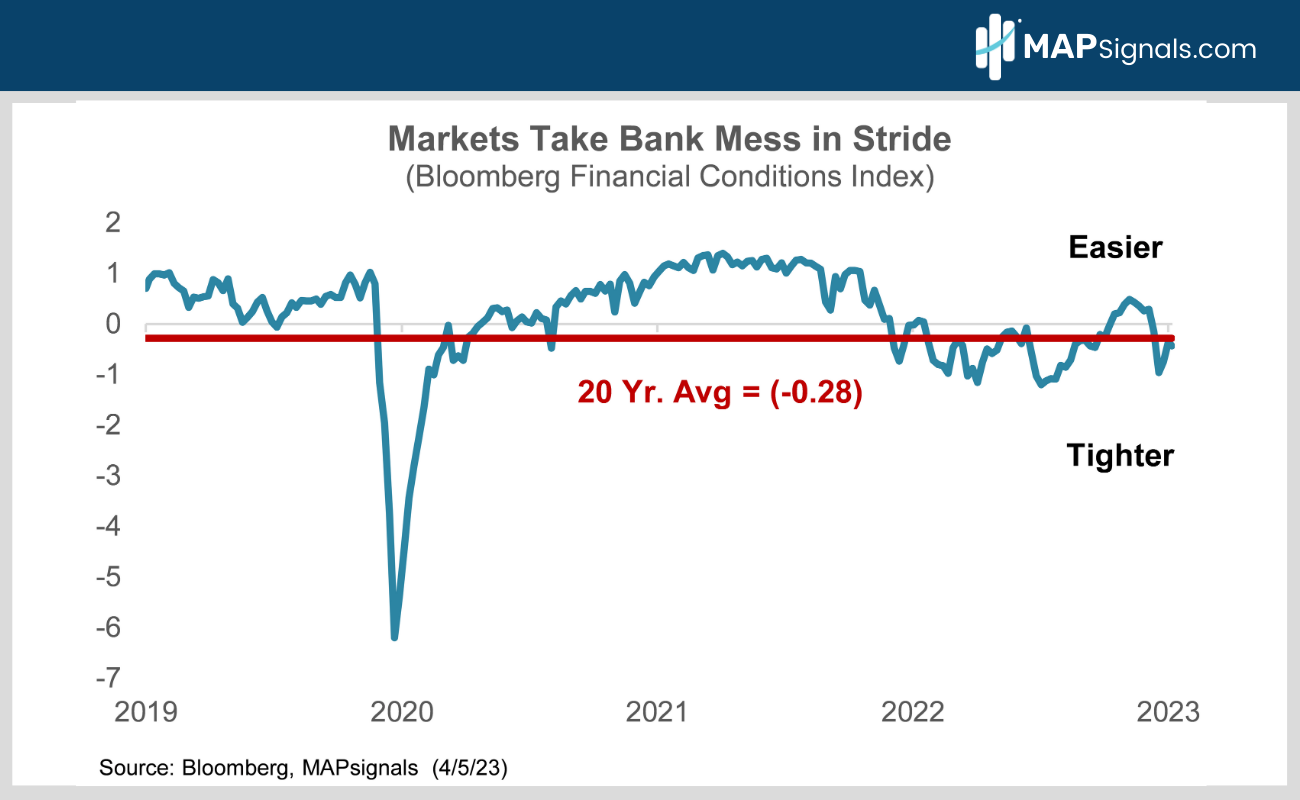
The Bloomberg Financial Conditions Index tracks the overall level of stress in U.S. money, bond, and equity markets to assess the availability and cost of credit. Deeply negative readings mean access to money is getting really tight.
The index hit -6 in the spring of 2020 when Covid uncertainty was raging. It’s currently negative 0.4, near its 20-year average and down only slightly from +0.3 before SVB hit the headlines.
So, what’s the upshot for stocks? The regional bank flare up is a wash. Here’s why. It makes the Fed more likely to stop tightening sooner. That will help blunt the impact of weaker regional bank lending on the broader economy. It will slow growth, but that can be neutralized by Fed easing:
The Fed is Done
The Fed funds futures market is pricing an end to the Fed tightening cycle at the May 3 FOMC meeting. Markets currently see a ¼ point hike as a 60/40 proposition. Either way, the end of Fed tightening is near.
Stocks typically do well after the Fed stops hiking rates. Investors buy in anticipation of faster economic and earnings growth as the drag from a rising cost of capital is replaced by the stimulative impact of cheaper money.
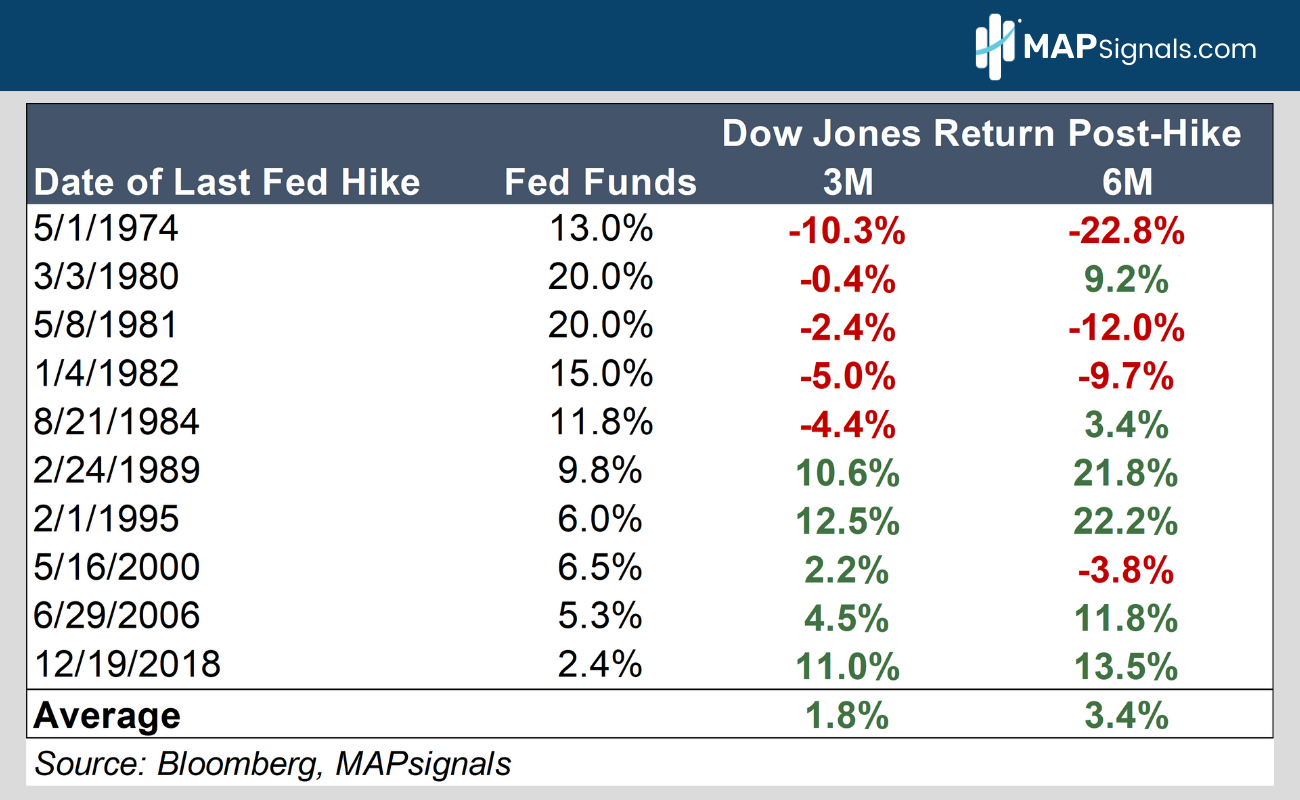
Since 1974, we’ve seen 10 Fed tightening cycles. The Dow Jones Industrial Average has averaged gains of 1.8% in the 3 months after the last Fed hike with a 3.4% average advance after 6 months.
Those keeping score know the DJIA has fallen 10% from its peak. Don’t rule out new highs:
The bears argue the Fed will keep short rates at 5% for a long time, choking off growth.
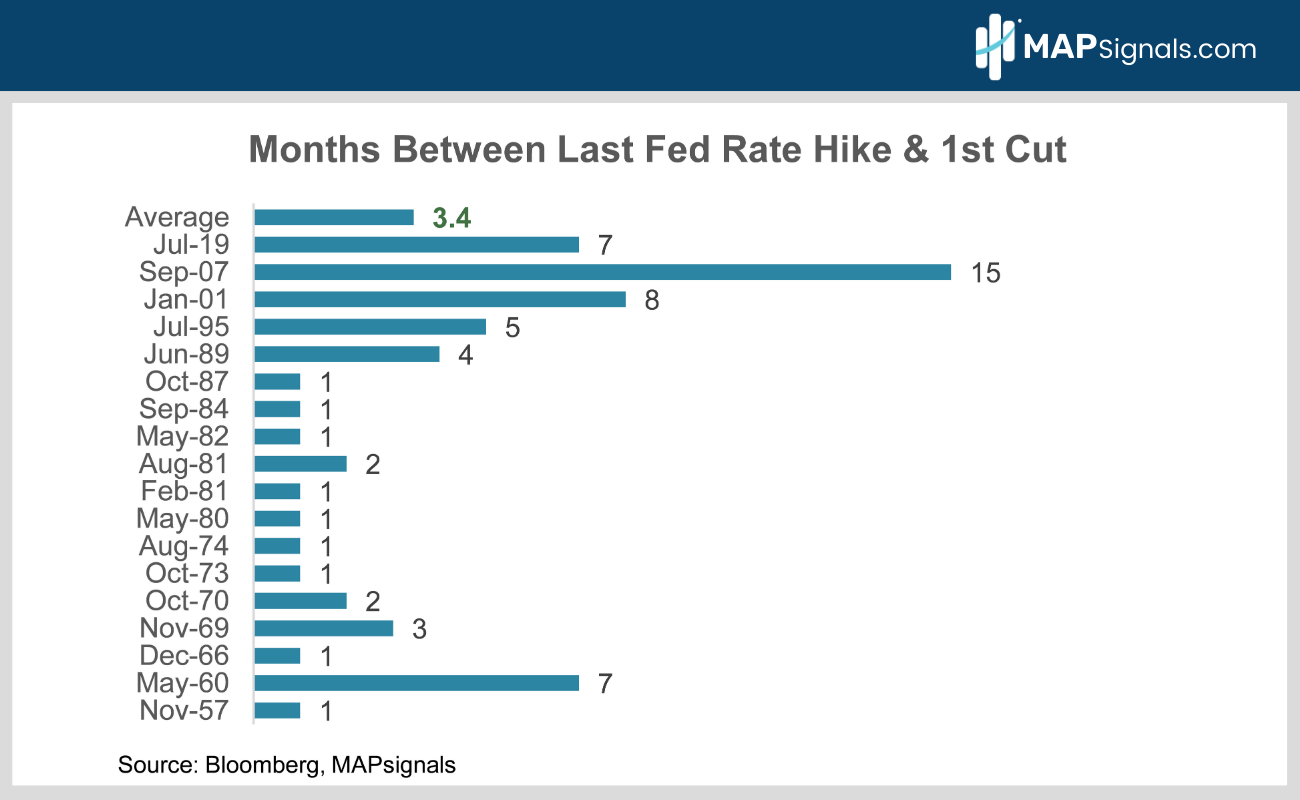
History says that’s unlikely. It doesn’t usually take the central bank long to shift gears from hikes to cuts. Check out this next chart.
Since 1957, the Fed has only waited an average of 3.4 months between ending rate hikes and beginning to ease policy. It’s just a matter of time before the Fed begins easing:
If this macro setup isn’t enough, there’s more.
The Earnings Bar is Really Low
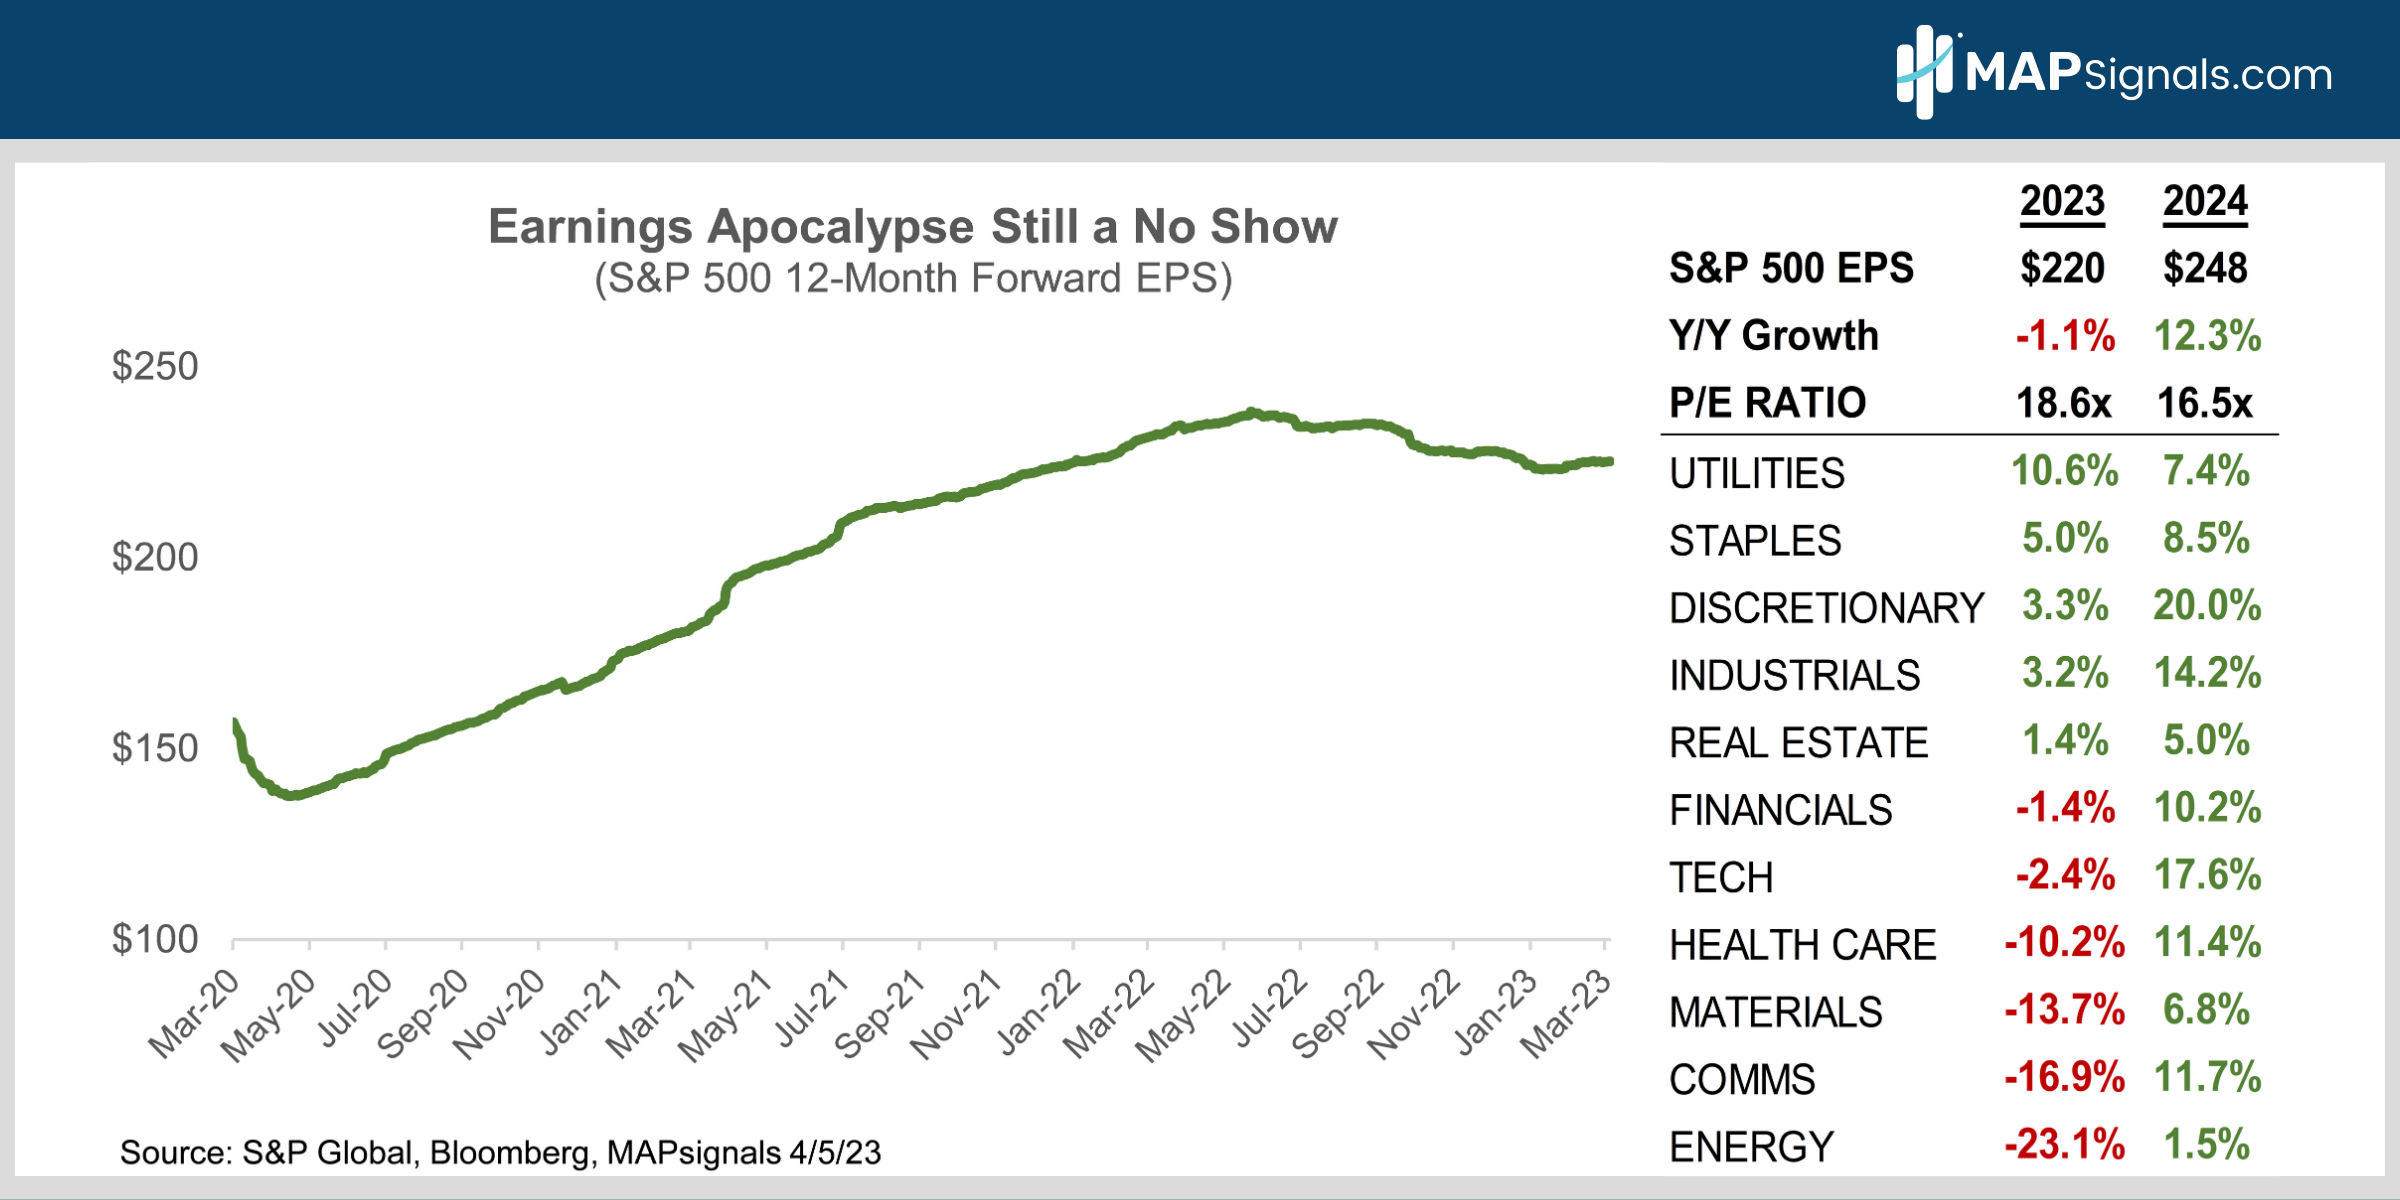
Bears have been warning about a profit meltdown for what seems like forever. Granted, we’ve seen some softness in S&P 500 earnings over the past few quarters, but a meltdown this is not! 12-month forward earnings expectations peaked last summer at $238 and have since fallen 5% to $225 (chart).
Q1 EPS season starts this week. Expectations are super low. Weak results are already priced into stocks. Earnings jitters are a big reason stocks have gone nowhere for the past year. Expect another “better than feared” round of results and forward guidance to leave the bears frustrated, again.
With inflation falling, the Fed close to pausing, and the economy slowing, but not collapsing, expect investors to “look through” any widely anticipated, near-term earnings softness, to better days ahead as growth re-accelerates in 2024 amid easier Fed policy.
Don’t rule out new highs!
Valuations Aren’t Stretched
Many cite elevated valuations as a reason stocks can’t rally. They’re missing the forest for the trees.
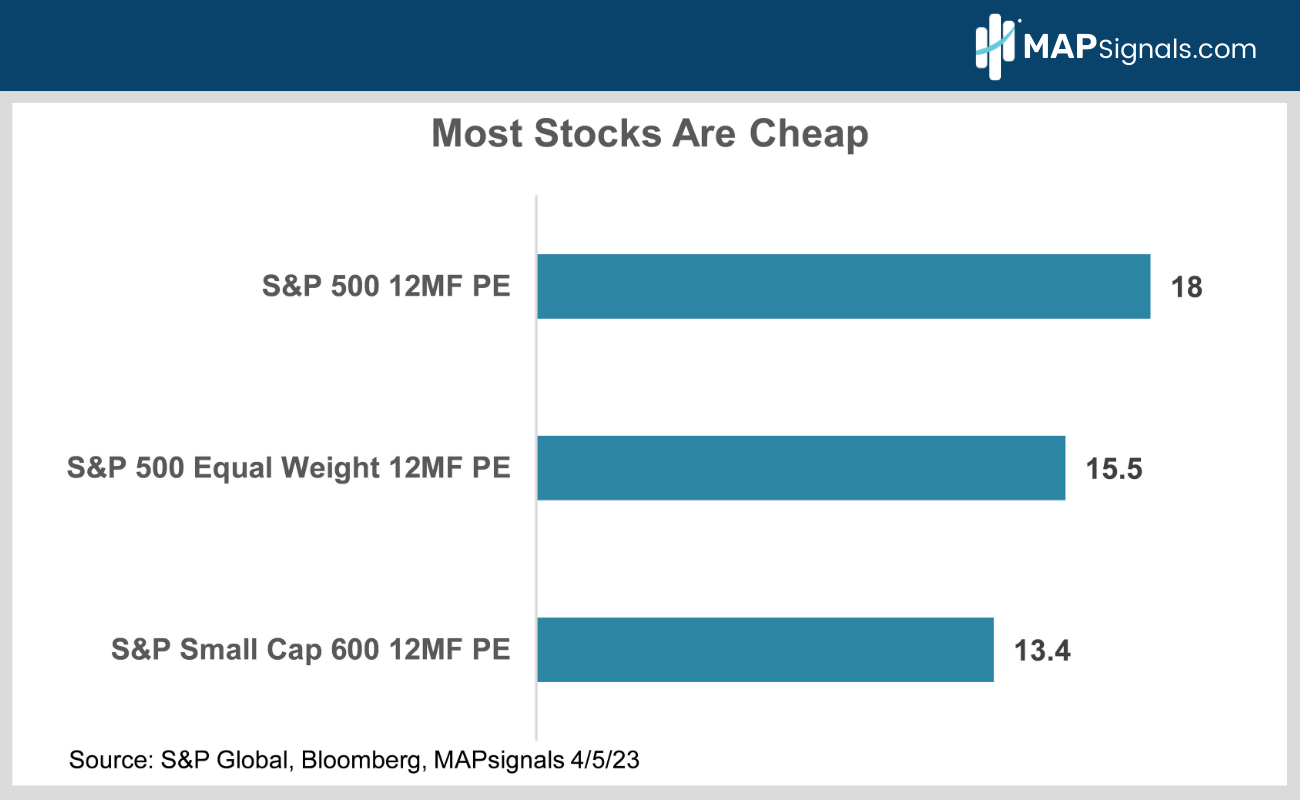
The top 15 names in the S&P 500 are the best companies in the world. It’s no surprise they aren’t cheap. Their high quality warrants a premium valuation. But the rest of the market is MUCH cheaper.
If you neutralize the higher valuations of the top 15 mega-cap stocks by looking at the S&P 500 equal weight index instead of the market cap weighted S&P, the 12-month forward P/E ratio shrinks to 15.5X from 18X.
Small caps are even more compelling with the S&P SC 600 Index trading at only 13.5X. Note the S&P small cap index excludes unprofitable companies. 35% of Russell 2000 constituents lose money so that index’s valuations is a lot higher.
In this market, quality is paramount. If you’re playing SC, use the 600.
The BMI Says Buy, Don’t Rule Out New Highs
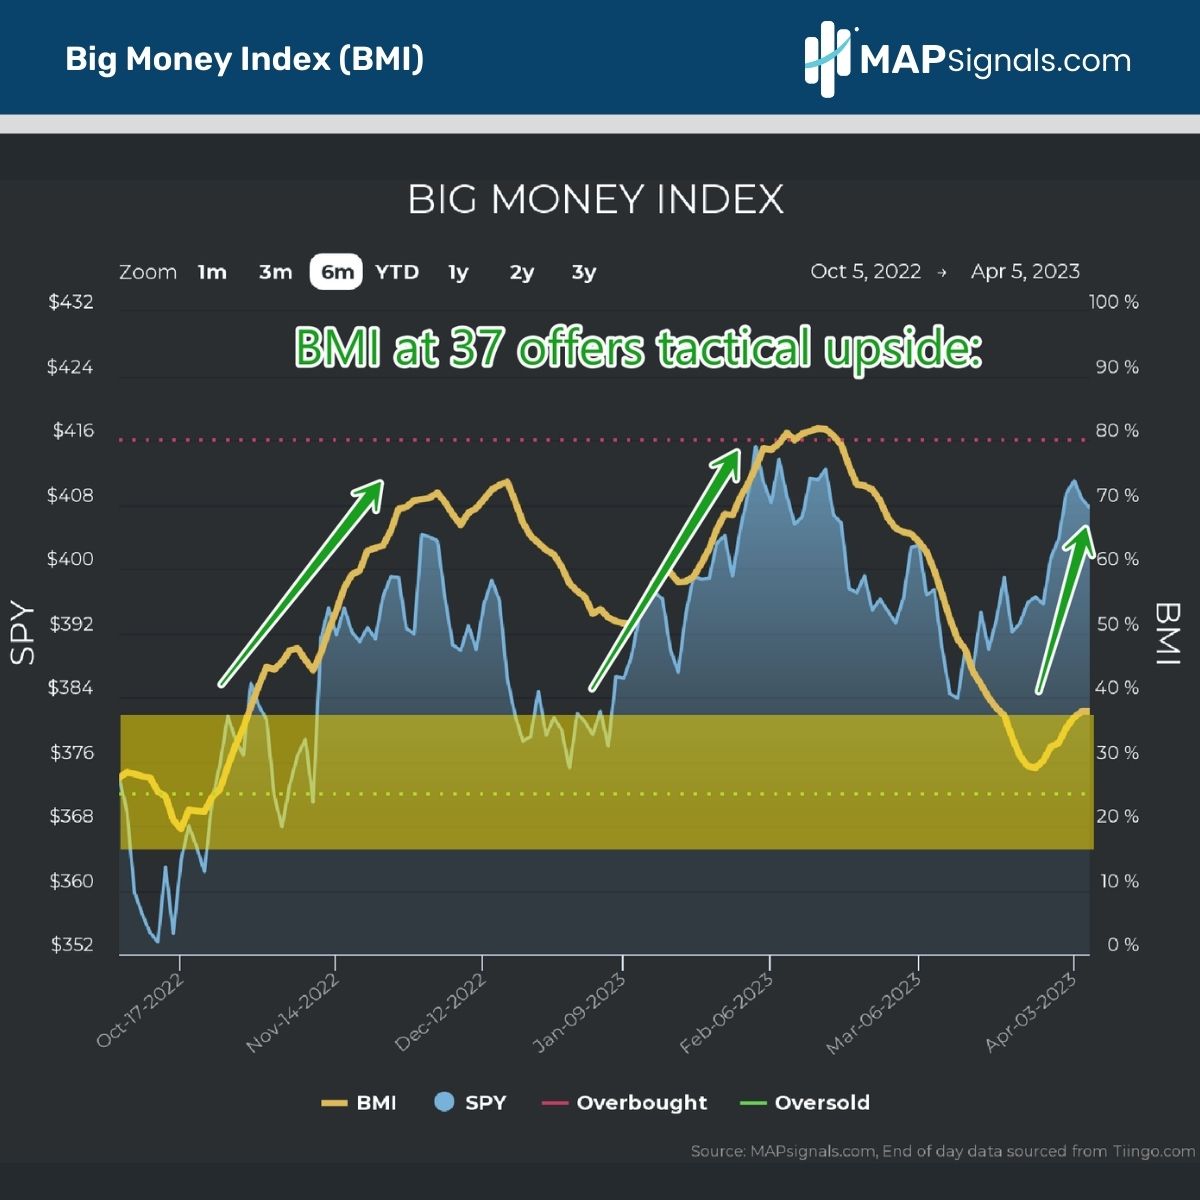
There are a lot of contrarian indicators out there. The Big Money Index (BMI) is one of the best I’ve ever seen. It tracks the intensity of big money buying.
Readings north of 80 signal an overbought market that’s too euphoric and ripe for a pullback. Conversely, when the BMI drops below 30, or even better, below 25, panic is in the air. That’s when the baby’s being thrown out with the bathwater and stocks are a bigtime buy.
When the BMI hit 82 in early February, we told you to take some chips off the table. On March 24, the BMI hit 29 as the S&P clocked an intra-day low near 3900. The S&P is now well over 4000 and the BMI has rebounded to 37 as institutional selling has slowed sharply.
At this level, the BMI still signals far more tactical upside than risk:
How to Play it
On March 6, I told you Macro Uncertainty Favors High Quality Stocks. I recommended overweighting high-quality sectors like technology and discretionary. The call’s worked. Big growth stocks have crushed the S&P recently as their predictable earnings and low debt have proven to be assets in uncertain times.
You don’t need me to tell you macro uncertainty remains high. Recession fears have replaced rising inflation as investors’ biggest macro worry. Everyone agrees growth is slowing, the debate is about whether we have a major, earnings crushing recession, or just a shallow recession/slowdown. I’m in the latter camp.
But I’m still recommending sticking with quality. The economy’s fate will take time to determine. Things will remain choppy and uncertain for a while.
With growth slowing I would also overweight counter-cyclical defensive sectors like staples and health care. After lagging in Q1, both are leading lately amid heightened economic uncertainty.
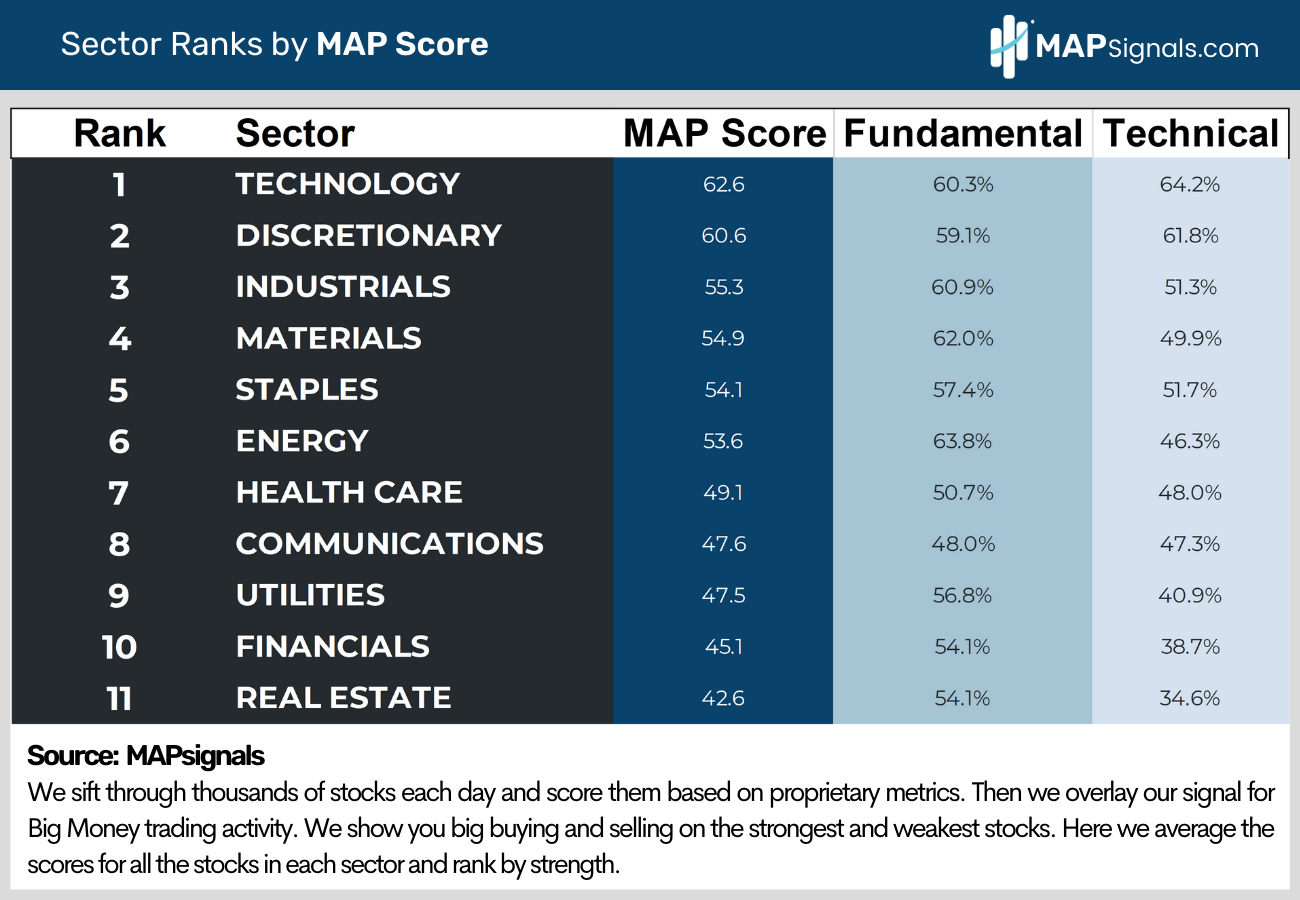
Tech and discretionary continue to top MAPsignals’ sector rankings as they have all year. Staples and health care are quickly moving up the leaderboard and currently sit 5th and 7th, respectively.
Bringing It All Together
Slowing growth and falling inflation mean the Fed is done tightening. The Fed will soon be ready to ease to prevent a hard landing.
With sentiment and positioning both extremely negative, and sluggish 2023 earnings already priced into undemanding equity valuations, there’s no reason stocks can’t challenge their all-time highs in Q4.
But with macro uncertainty likely to remain high for a while, high quality and defensive sectors offer the best way to position for the next leg of the rally. Think tech, discretionary, staples and health care and don’t rule out new highs!
To outperform, use a map! Individual stock performance dispersion is really high right now. Plenty of stocks are beating the S&P 500. Get started with a subscription here.
Invest well,
-Alec