
Prepare for September Volatility
Tis the season to be cautious.
September is notoriously a negative month for stocks. History and data suggest one message: Investors should prepare for September volatility.

After closing out a weak August, where the S&P 500 fell 4.2%, investors now face a seasonally weak time of year.
Last week, I put together a midterm election stock market playbook which hinted at two themes we should expect in 2022. First, midterm election years are notorious for negative stock market returns in September. And second, October and November historically boast strong rallies.
As I’ll show you, the first step of this roadmap is already in play with selling increasing significantly in our data. Near-term, expect a bumpy ride. That’s the bad news.
The good news is prices tend to firm in Q4. If history is any guide, use the September doldrums as opportunistic entry points.
Let’s check in on the data.
Prepare for September Volatility
Just 2 weeks ago our Big Money Index was overbought. This is our indicator that measures the health of the stock market.
When volumes increase as prices rise, expect higher markets. When buying slows and selling increases like now, prepare for weakness.
The BMI has reached a 3-week low as selling has increased dramatically:

Above in the top right you’ll notice a yellow circle, underscoring the fast decline in the BMI. As of this morning, the reading is 70%, which broke through the key level of 75%.
As a reminder, when the BMI rises in epic fashion from oversold to overbought levels (red horizontal line), be on alert once it breaks below 75%. History has shown, it’s a sell signal to take profits.
The forward returns for the S&P 500 post this signal are negative 1 to 2 weeks out. See below:
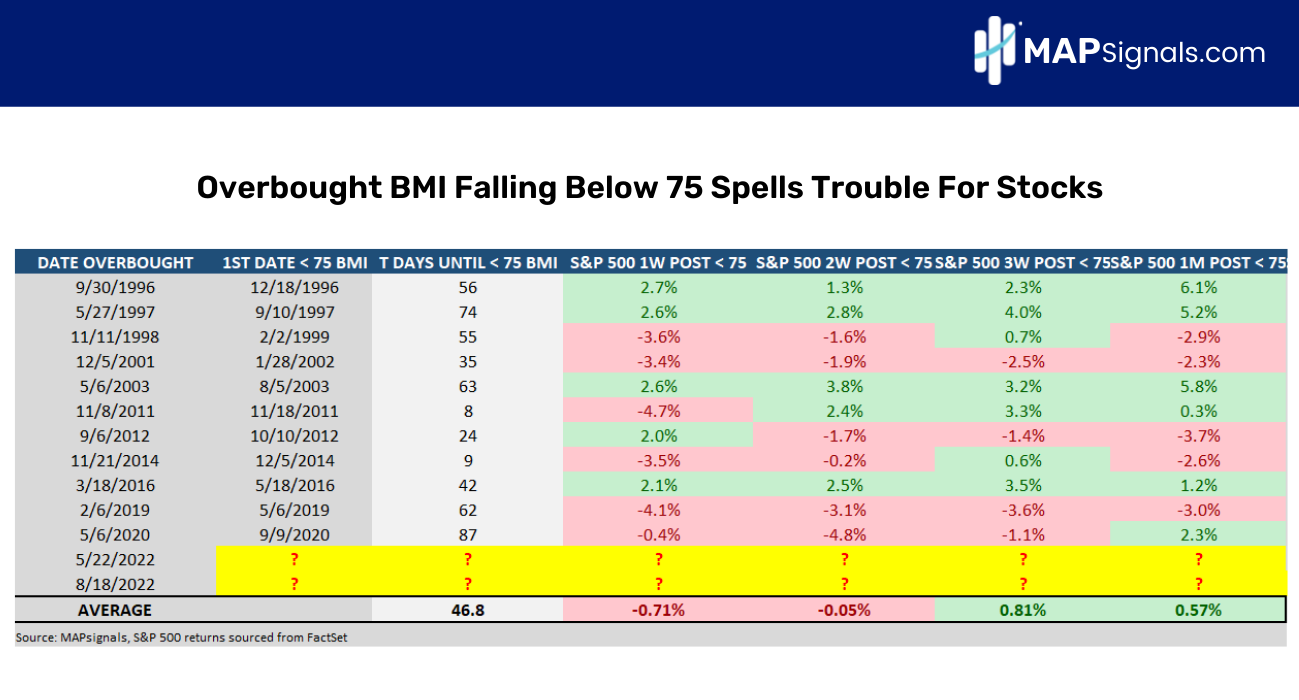
That’s right, after falling below 75%, you can expect stocks to return -.71% a week later and -.05% two weeks later.
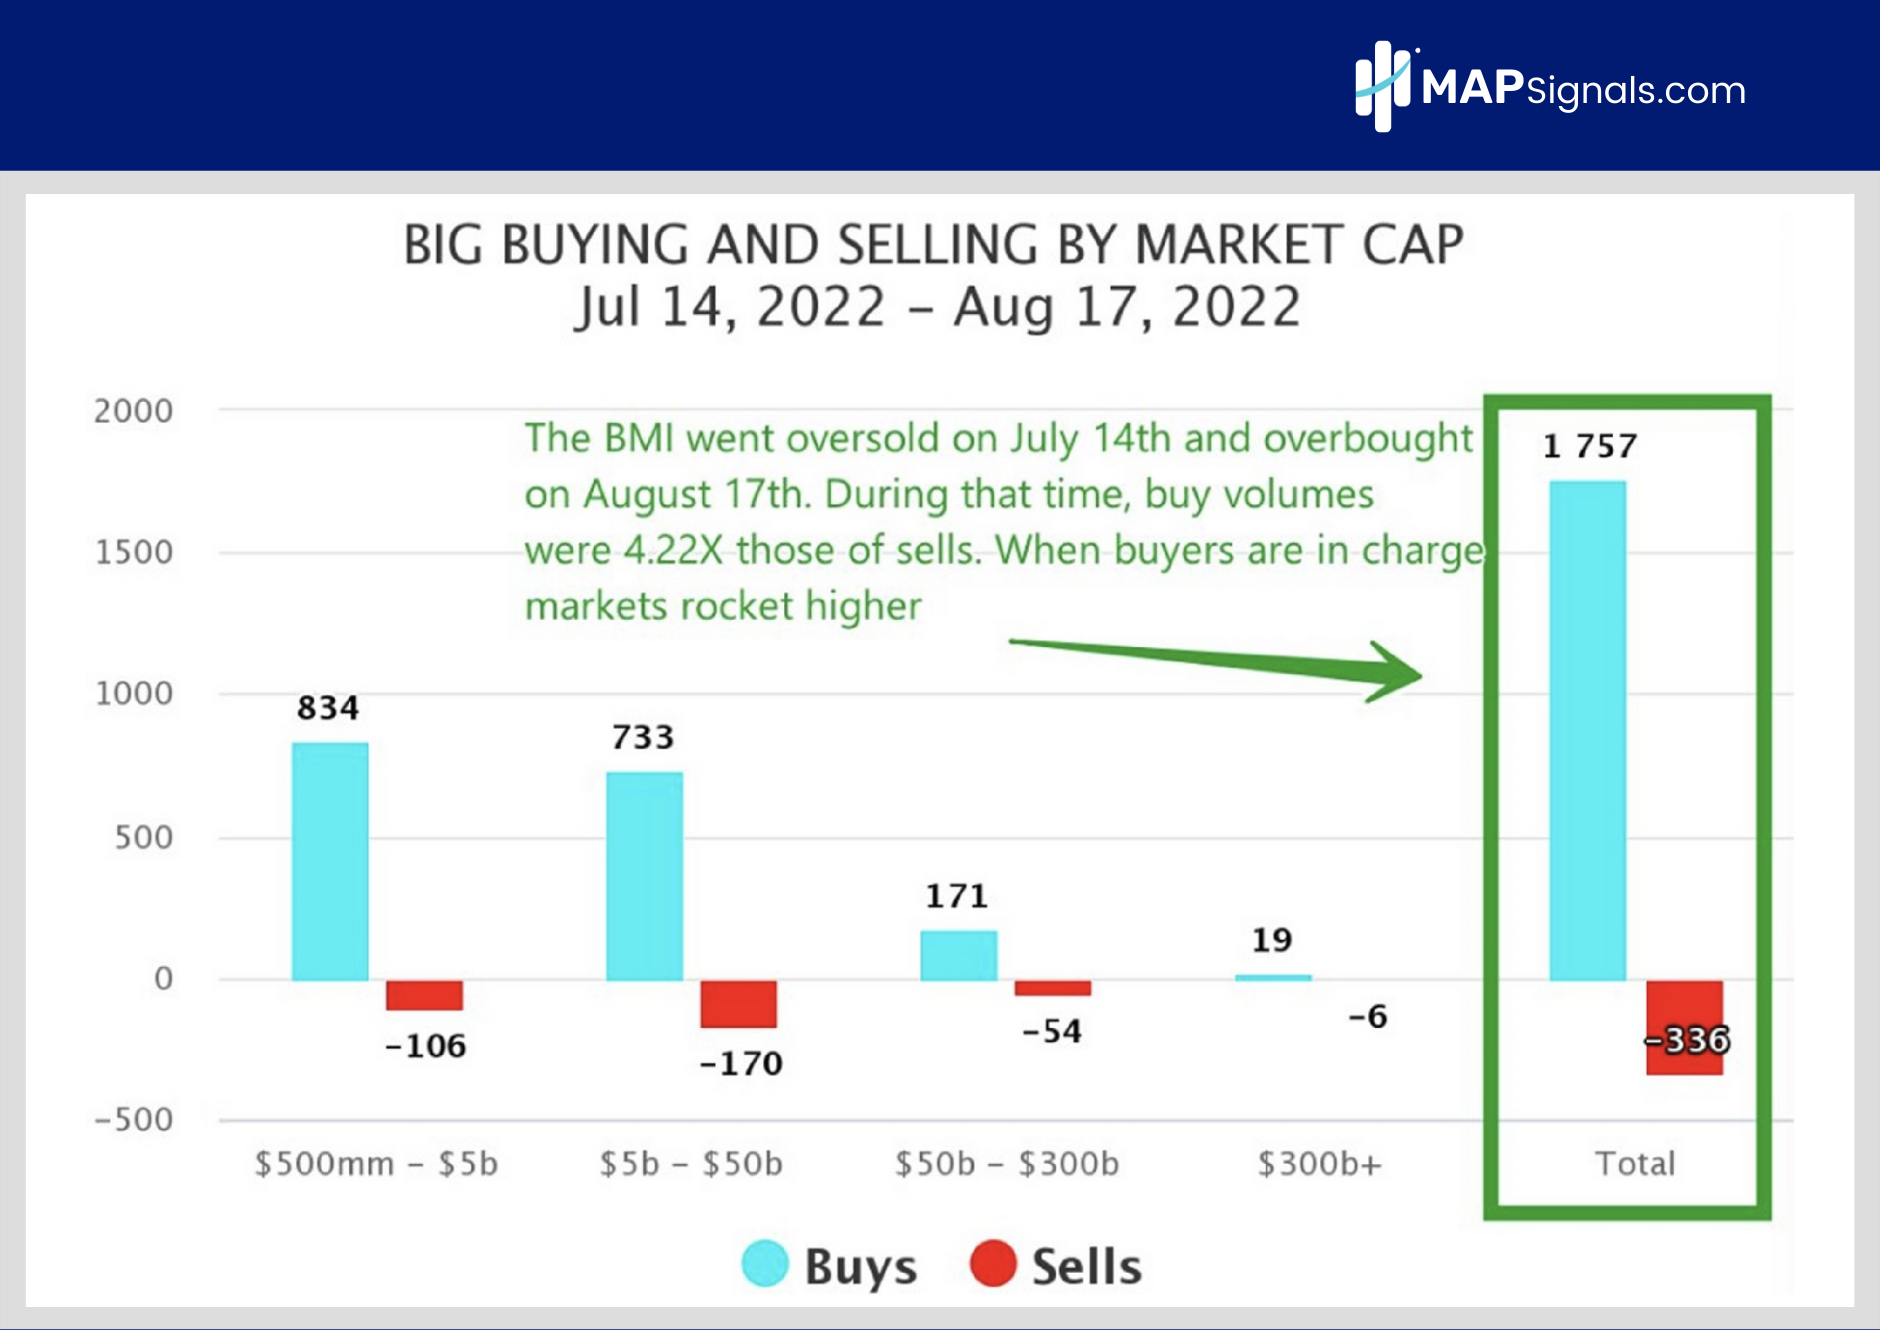
And looking at the shift in buy and sell activity makes the case more evident.
Since the BMI went oversold on July 14th and overbought on August 17th, buy signals outnumbered sells by a ratio of over 4:1. When demand outstrips supply, stocks surge. See below:
But this trend has completely shifted in favor of sellers recently. From August 18th – 31st, sell signals outgain buyers:
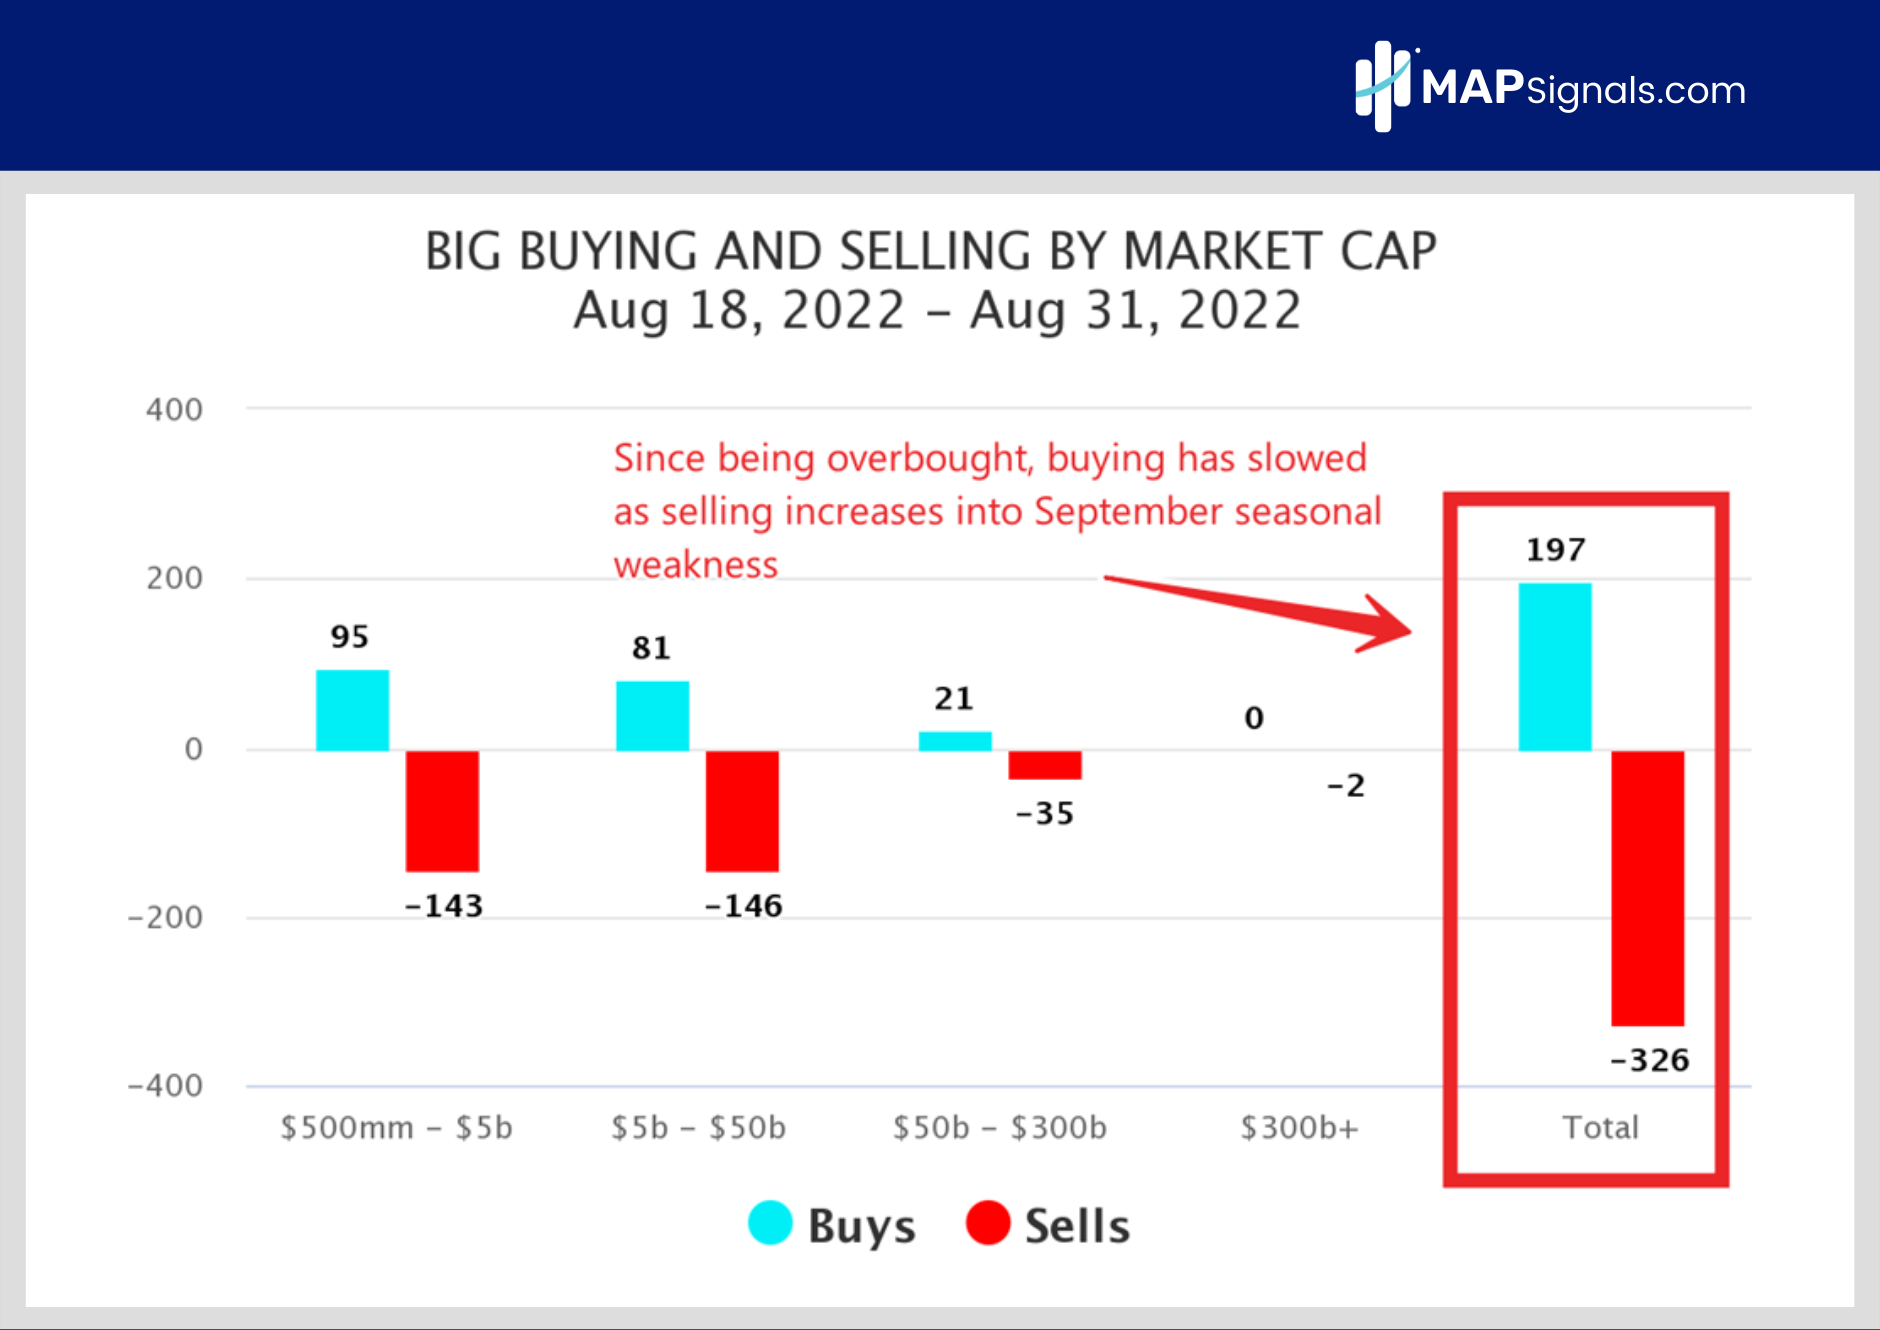
This major shift is what’s causing weaker prices and a free-falling Big Money Index.
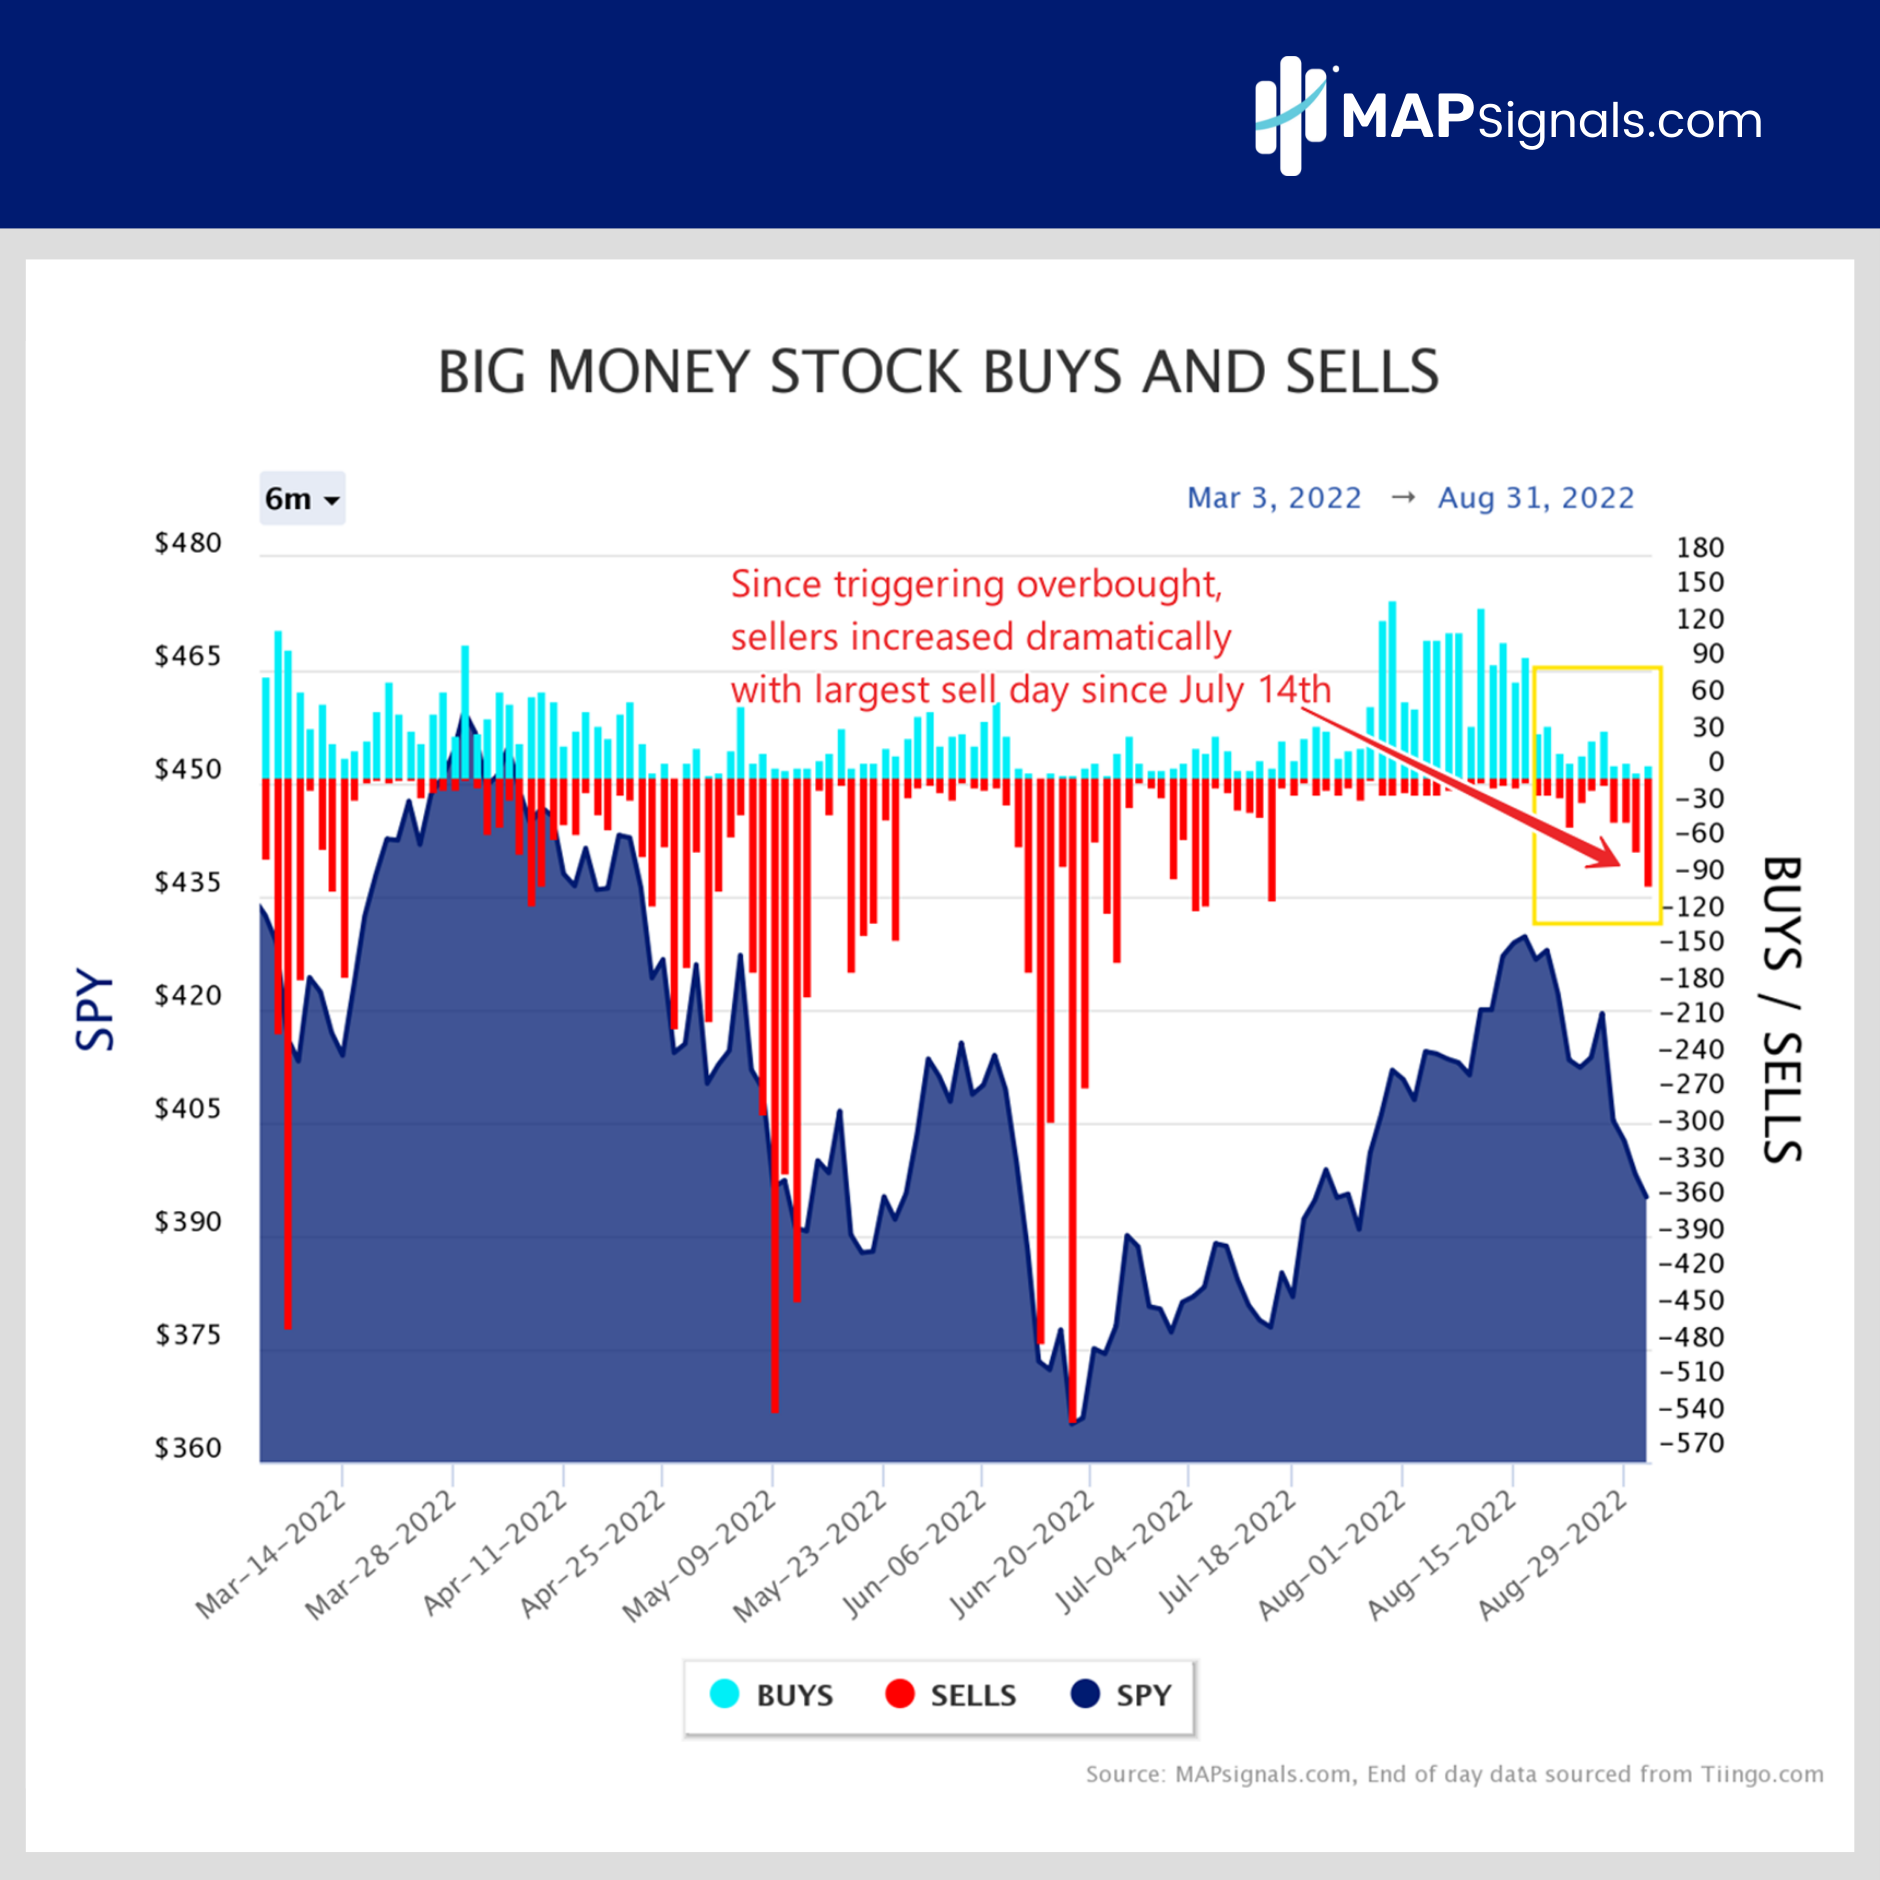
Taking it one step further, check out the daily action. We can see that yesterday was the single largest day of selling since July 14th (the day we hit oversold). A total of 90 stocks were sold compared to only 10 being bought. See below:
This data suggests traders should prepare for September volatility. That’s been our theme for weeks. But don’t get too bearish. Midterm election years tend to show green pastures in October and November.
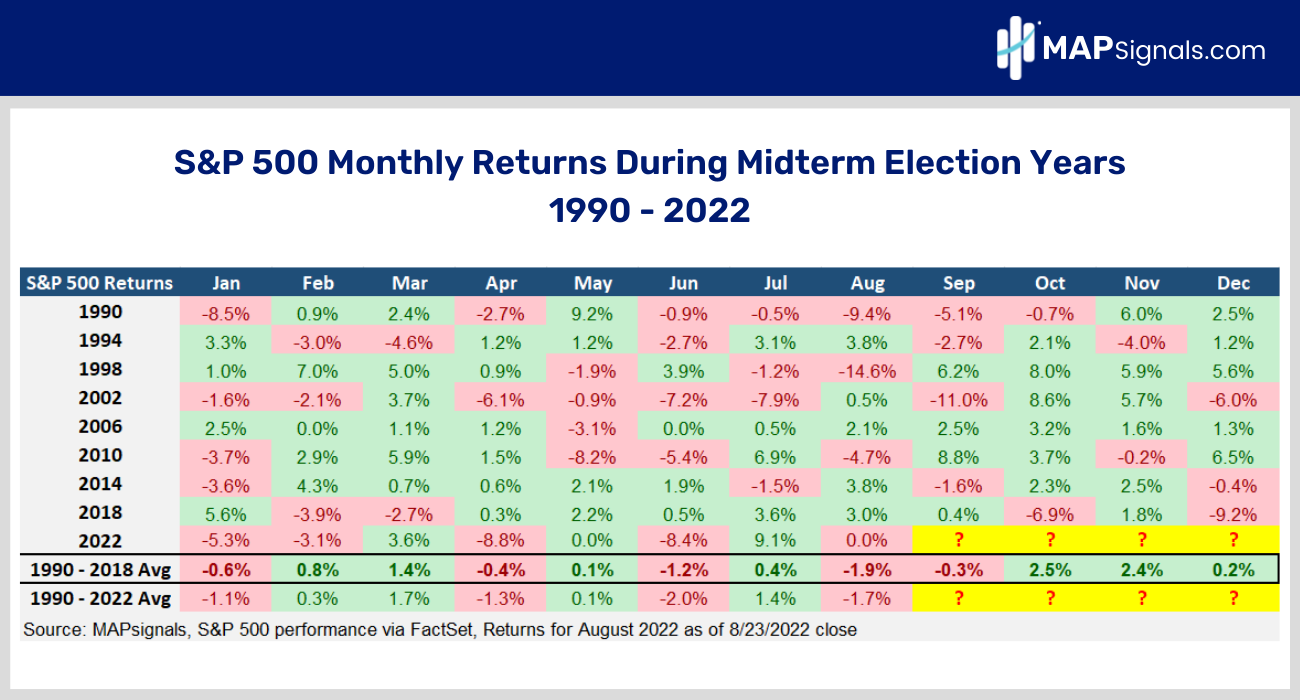
Below are the monthly returns for the S&P 500 in midterm election years going back to 1990. Based on history, September is red on average. But also notice what happens in October and November: The S&P 500 gains +2.5% and 2.4% respectively. See below:
So while it’s never fun to sit through red markets, history points to better days in the months ahead. And that’s worth preparing for.
Here’s the bottom line: As I said last week, be cautious heading into September. History proves it’s an ugly time for stocks. The latest Big Money data echoes that message with some of the biggest selling we’ve seen in a month.
But, as you prepare for September volatility, also prepare for better days in the months ahead. Midterm election years since 1990 showcase market gains in October and November of 2.5% and 2.4% respectively.
Look, history rarely repeats, but it often rhymes. The first step of the midterm election roadmap is playing out as expected. Odds are Q4 will bring a much-needed lift.
Using cold hard data can only help along the way. Follow the Big Money footprints with MAPsignals.
If you’re looking to kick your trading up a notch, get started with a MAPsignals subscription today. Get access to our automated portal that auto-updates each morning.