• Menu
  • Skip to right header navigation
  • Skip to main content
  • Skip to primary sidebar
  • Skip to footer

MAPsignals

We map big money.

  • Latest Insights
  • Power of MAP
    • MAP Products
    • MAP System
    • White Papers
    • Videos & Interviews
  • Profit with MAP
  • About
    • About MAP
    • MAP Team
    • Authors
    • MAP System
    • MAP Products
    • Big Money Index
  • Members
    • Get Started With MAP
    • My MAP
    • Big Money Charts
    • MAP View
    • MAP View Options
    • MAP Top 20 Weekly
    • MAP 50
    • Member Updates
    • Platinum Updates
    • Members Only Posts
    • Performance
  • Portal

Flying South

March 4, 2021 //  by Lucas Downey//  5 Comments

When the weather cools, birds migrate for winter.

Look up and you’ll see them flying south.

flying south

I love that flying-V overhead. We don’t really know why birds migrate.

It may be due to  changing seasons, dwindling resources, or just plain heading for sunny warmth. Flying south happens innately, like a trigger. Essentially, birds listen to inner-signals that have evolved over millennia.

Birds aren’t loners; they travel in groups. It’s a safety measure that’s been internally hard-wired for millions of years.

Let’s think of stocks like birds. Occasionally we see certain flocks of stocks heading south. That signals change for investors and they decide to sell…like we’re seeing now.

Seasons change. Warmth gives way to cold. The over-heated market is colling now. Traders are heading for safety.

Like last week, our data continues with the theme of increased selling. The market migration is here.

Big Money Index Flying South

The Big Money Index shows us the market’s trend. As early as a month ago, our data started signaling changes. And last week we hinted at the silent undertow for stocks.

That trend is increasing. Stocks are heading lower by flying south. Below, you can see that the BMI is now in a downtrend:

big money index flying south

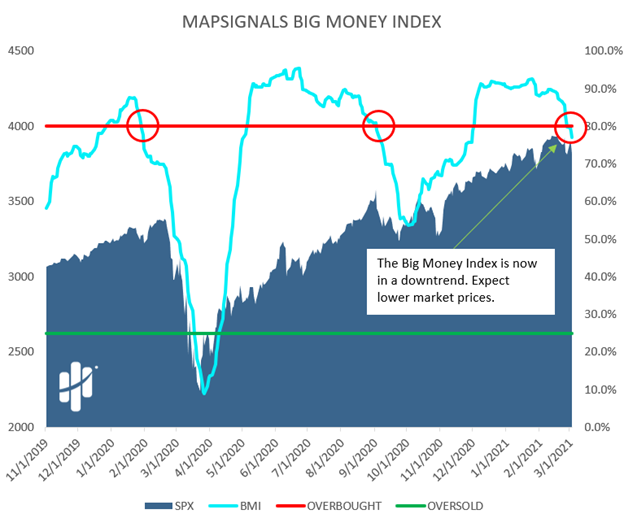
The trigger area has been breached: breaking below overbought (circled in red off to the right). I’ve also circled the 2 prior times this occurred. You can see that markets tend to fall alongside the BMI.

Stocks flying south isn’t a new phenomenon. That’s how they behave after extreme overbought conditions. Our BMI was overbought for nearly 12 weeks. Eventually stocks need to breathe.

Popular long positions get crowded (like growth stocks) and exits can be very fast. That’s the market migration we see now.

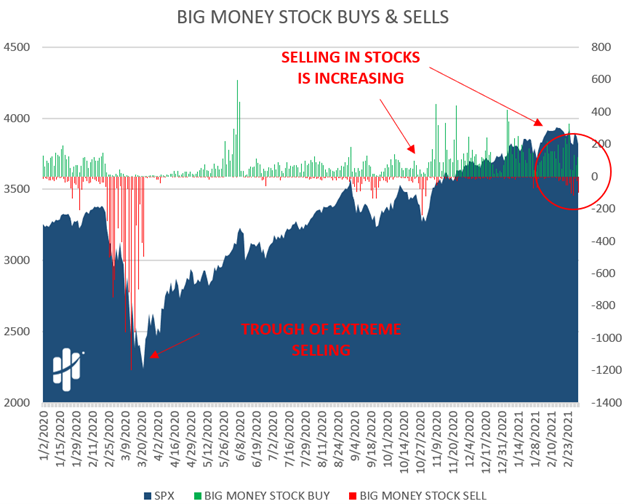
Big Selling In Stocks Increases

As a reminder, the BMI is made up of daily buys and sells of stocks. If the index is falling, selling is picking up. And that’s precisely what’s happening.

Below is our Big Money Stock Buys & Sells chart. Green bars are buyers and red sticks are sellers. I’ve circled what’s important. But you need to know that only some stocks are flying south.

stocks buys and sells

You can see the same type of action in ETFs. Like the above chart, green bars are buyers and red are sellers.

ETF buys and sells

Like I said above, what’s really interesting is certain groups are falling while other are staying put. Not all birds migrate at the same time…the same goes for sectors.

As I’ll show you, only some areas of the market are headed south.

Sectors Seeing An Unwind

Momentum swings both ways. In a strong bull market, buying in stocks begets more buying. In a falling market, selling in stocks paves the way for more selling.

But the important distinction is, our sell data is not across the board. Only some stocks are being sold while others are getting bought.

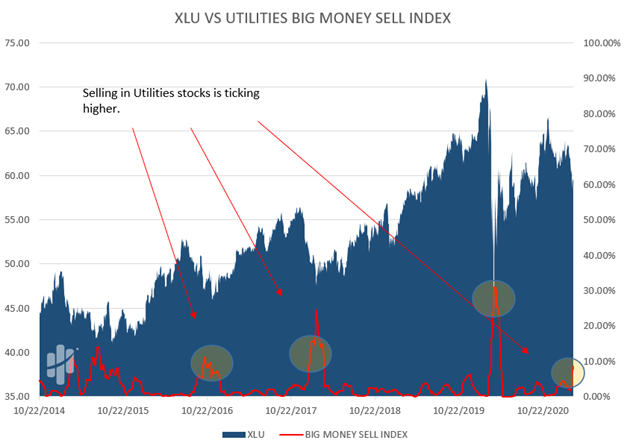
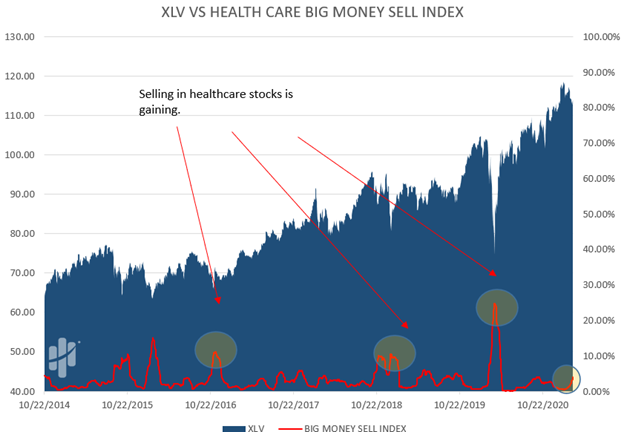
Below are our Big Money Sector Indexes. First, let’s look at where selling momentum is increasing. A rising red line means selling is gaining:

Utilities:

selling in utilities

Next up is Healthcare:

selling in healthcare

Lastly, you can see that selling in Tech stocks is starting to ramp:

selling in technology

I don’t want to alarm you but, as nasty as the growth unwind has been, we are nowhere near extremes as previously seen in these charts. If anything, it appears that the migration south is just starting. We expect more near-term selling in these groups.

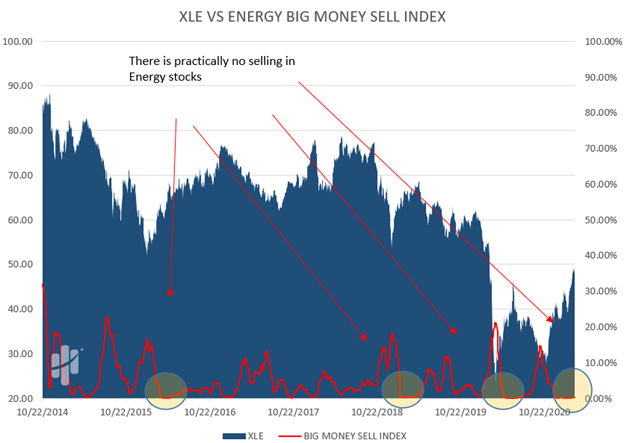
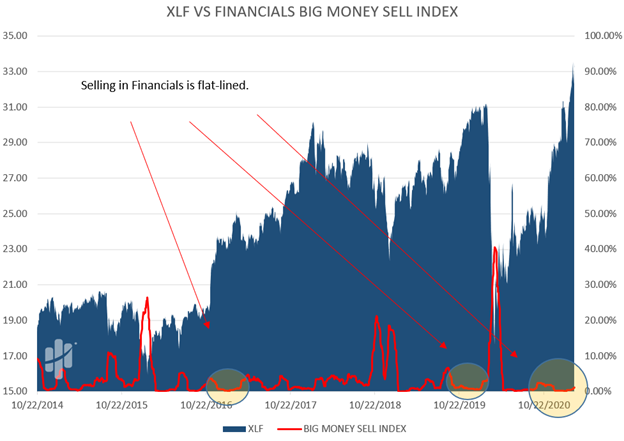
Contrast this to the reopen sectors: There is zero selling in certain areas.

Like Energy:

selling in energy

And Financials:

selling in financials

Lastly, Discretionary:

selling in discretionary

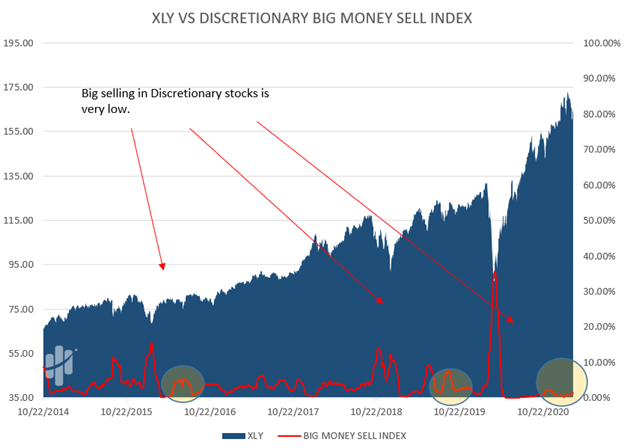
Clearly, some sectors are flying south while others have decided to stay put. But, we do expect selling to increase across the board. As we’ve highlighted, growth areas are the pain points.

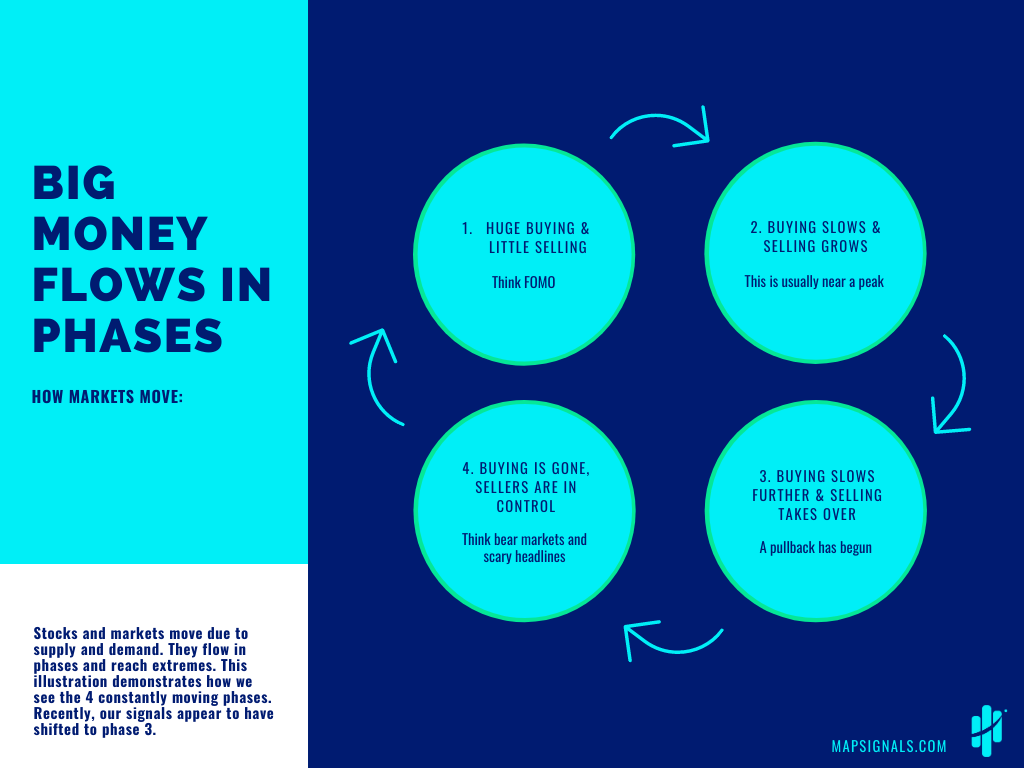
But this isn’t new. Big Money moves in phases. Sometimes we blast higher for months. Other times we stall and fall.

As a reminder, here are the 4 phases of Big Money. Phase 3 looks to be here…i.e., the near-term top is likely in:

phases of Big Money

So, let’s wrap it all up.

Here’s the bottom line: stocks are flying south. The Big Money Index tells us to expect more selling. But, that’s only near-term. Market migrations are only temporary.

As long-term investors, we see times like now as areas to get our buy lists ready. Stocks that we’ve watched fly high for months are finally getting to lower prices. Those can be attractive entries that we like.

While the data signals turbulence near-term, just remember that flying south is only part of a bird’s life. They eventually fly north for Summer.

It’s the best of both worlds.

MAPsignals is a market bird watcher. Eventually the season will get warmer for stocks.

Stay alert for when we hear the Big Money bird call again.

Lucas Downey
Lucas Downey

Lucas is co-founder of MAPsignals. His full bio can be found here.
Prior to MAP, he was Head of ETF Sales at Cantor Fitzgerald & SVP of Derivatives at Jefferies, LLC.

Spread the word!

Category: All, Big Money Insights Weekly

Previous Post: «silent undertow Silent Undertow
Next Post: The Big Money Index Is Falling. What’s It Mean? »

Reader Interactions

Comments

  1. Joe

    March 4, 2021 at 11:12 am

    Appreciate your analysis. When the Govt. is dropping money and the world follows, well, it’s too irresistible for me. If everyone thinks the same, perhaps someone is not thinking. Onwards and upwards!!!

    Reply
    • MAPsignals Staff

      March 4, 2021 at 11:51 am

      It’s an interesting time indeed. We think periods like now, make data so important.

      We can’t wait for the rocket launch signal 🙂

      Reply
  2. Gary

    March 4, 2021 at 1:48 pm

    Wow. I am impressed. Thanks for fantastic analysis and updates you have been giving. My shopping list is ready!

    Reply
    • MAPsignals Staff

      March 4, 2021 at 2:12 pm

      Remember to spread the word! People need to know!

      Thanks for the kind words!

      Reply
  3. Greg

    March 4, 2021 at 10:13 pm

    Hello, just wanted to thank you guys and say that your information has been spot on for months. You told us when markets would peak, stall and start to sell off…and you were right! I took the info and bought Puts; SPY, QQQ and IWM. They have worked out well. I am a “Bull”, however, I welcome times like these. I have my shopping list ready to go…I heard the market is having a sale. 😉
    Thanks again!

    Reply

Leave a Reply Cancel reply

Your email address will not be published. Required fields are marked *

Primary Sidebar

Get Big Money Insights for FREE

Want to know where the Big Money is headed?

Just enter your email address below. You'll get our FREE NEWSLETTER sent directly to your inbox.

We call it Big Money Insights... It’s your weekly sneak peek at the powerful market-moving forces that are hidden from 99% of investors.

"*" indicates required fields

This field is for validation purposes and should be left unchanged.

Categories

  • All
  • Big Money Insights Weekly
  • Big Money Series
  • Macro Insights
  • MAP In The Media
  • Members Only
  • Performance
  • Podcast
  • Special Reports
  • Stocks
  • Videos & Interviews
  • White Papers

Archives

  • May 2022
  • April 2022
  • March 2022
  • February 2022
  • January 2022
  • December 2021
  • November 2021
  • October 2021
  • September 2021
  • August 2021
  • July 2021
  • June 2021
  • May 2021
  • April 2021
  • March 2021
  • February 2021
  • January 2021
  • December 2020
  • November 2020
  • October 2020
  • September 2020
  • August 2020
  • July 2020
  • June 2020
  • May 2020
  • April 2020
  • March 2020
  • February 2020
  • January 2020
  • December 2019
  • November 2019
  • October 2019
  • September 2019
  • August 2019
  • July 2019
  • June 2019
  • May 2019
  • April 2019
  • March 2019
  • February 2019
  • January 2019
  • December 2018
  • November 2018
  • October 2018
  • September 2018
  • August 2018

Follow us on Twitter

MAPsignals Follow 573 808

MAPsignals - we map the markets.

mapsignals
mapsignals avatar; MAPsignals @mapsignals ·
15h 1528792004649418754

“Most people get interested in #stocks when everyone else is. The time to get interested is when no one else is. You can't buy what is popular and do well.”
- #WarrenBuffett

Image for the Tweet beginning: “Most people get interested in Twitter feed image.
Reply on Twitter 1528792004649418754 Retweet on Twitter 1528792004649418754 1 Like on Twitter 1528792004649418754 2 Twitter 1528792004649418754
Load More...

Subscribe To Our YouTube Channel

MAPsignals

MAPsignals
#BestETFs #JasonBodner #ETFs
Investors are fearful. These are the best ETFs to buy now for June 2022. Our latest blog post is here: https://mapsignals.com/map-blog/

At MAPsignals, we turn to data to help us find opportunities. Scoring stocks is what we love to do. Scoring baskets of stocks allows us to score ETFs! 

Having an unemotional data-driven approach allows us to highlight funds rising to the top. This process is how we find the best ETFs for June 2022. 

From our standpoint, the best ETFs are ones that hold incredible stocks. 

We are seeing strong technical and fundamental scores in Utilities, Food & Beverage, Staples, and Energy ETFs.

Jason Bodner breaks down the following 5 Best Defensive ETFs to Buy Now:
2:46 iShares U.S. Energy ETF (IYE)
4:39 First Trust Natural Gas ETF (FCG)
6:21 First Trust Nasdaq Food & Beverage ETF (FTXG)
8:37 First Trust Utilities AlphaDEX Fund (FXU)
10:20 Consumer Staples Select Sector SPDR Fund (XLP)

Inside each of these ETFs are outlier stocks. Those are companies that outperform all others. Data and helps us find them!

In IYE, he breaks down high scoring stock, Occidental Petroleum Corporation (OXY)
Inside FCG, Jason showcases Coterra Energy Inc. (CTRA)
Then for FTXG, he finds Archer-Daniels-Midland Company (ADM)
For FXU, he focuses on NRG Energy, Inc. (NRG)
Finally for XLP, he showcases Costco Wholesale Corporation (COST)

Learn more at www.mapsignals.com
Remember this is not personal investment advice of any kind. This video is for entertainment purposes only. 

Our disclaimer can be found here: https://mapsignals.com/contact/

Disclosure: Jason holds long positions in COST in managed accounts at the time of filming.

Music by 5ilverfox:
https://open.spotify.com/artist/0UsYrSmSKlcFnvY6XAUOQp
https://soundcloud.com/5ilverfox
Best ETFs to Buy Now for June 2022 | ETF Database
YouTube Video UC4nueJix0bSLmZyilUuCVrQ_Ew7oNsoKzGM
Load More... Subscribe

Footer

© 2021 Mapsignals.com

  • Home
  • Contact & Disclaimer
  • Privacy Policy
  • Terms & Conditions
  • Cookie Policy (US)
  • FAQ

Copyright © 2022 · Mai Law Pro on Genesis Framework · WordPress · Log in

✕
The Big Money Index White Paper is Here

Get your copy here and know where the Big Money is headed.

Enter your email address below and you'll get our FREE NEWSLETTER sent directly to your inbox. 

 We call it Big Money Insights... It’s your weekly sneak peek at the powerful market-moving forces that are hidden from 99% of investors.

Manage Cookie Consent
We use cookies to optimize our website and our service.
Functional Always active
The technical storage or access is strictly necessary for the legitimate purpose of enabling the use of a specific service explicitly requested by the subscriber or user, or for the sole purpose of carrying out the transmission of a communication over an electronic communications network.
Preferences
The technical storage or access is necessary for the legitimate purpose of storing preferences that are not requested by the subscriber or user.
Statistics
The technical storage or access that is used exclusively for statistical purposes. The technical storage or access that is used exclusively for anonymous statistical purposes. Without a subpoena, voluntary compliance on the part of your Internet Service Provider, or additional records from a third party, information stored or retrieved for this purpose alone cannot usually be used to identify you.
Marketing
The technical storage or access is required to create user profiles to send advertising, or to track the user on a website or across several websites for similar marketing purposes.
Manage options Manage services Manage vendors Read more about these purposes
View preferences
{title} {title} {title}