• Menu
  • Skip to right header navigation
  • Skip to main content
  • Skip to primary sidebar
  • Skip to footer

MAPsignals

We map big money.

  • Latest Insights
  • Power of MAP
    • MAP Products
    • MAP System
    • MAP White Papers
    • Videos & Interviews
  • Profit with MAP
  • About
    • About MAP
    • MAP Team
    • Authors
    • MAP System
    • MAP Products
    • Big Money Index
  • Members
    • Get Started With MAP
    • My MAP
    • Big Money Charts
    • MAP View
    • MAP View Options
    • MAP Top 20 Weekly
    • MAP 50
    • Member Updates
    • Platinum Updates
    • Members Only Posts
    • Performance
  • Portal

Silent Undertow

February 25, 2021 //  by Lucas Downey//  5 Comments

The last time I was at the beach with the kids, I got freaked out. Everything was clam and then suddenly the lifeguard blew his whistle.

He shouted: “Rip-current ahead! Everyone out of the water! (whistle blows) You gotta stay onshore for now.”

He was very worried about the silent undertow.

silent undertow

On the surface, ocean waves move in sequence together.

Waves appear to be predictable; rhythmic.  But, sometimes there’s other stuff going on that we can’t see.

Anyone who has been to the beach likely heard the lifeguard whistle at some point. It’s their job to keep swimmers safe.

Swimmers mostly know to avoid danger. For example: the misleading beauty of a jellyfish. The lilting blob packs a nasty sting if you tangle with it. But then again, not all swimming risks are easily spotted with the naked eye.

When it comes to the ocean though, it’s far more complex than just the waves we see rising and falling. There are two dangers to be alert for: rip currents and a silent undertow.

They are both scary. When water rushes into the shoreline, it has to go back out to sea. Rip currents happen when water flows the opposite of the incoming waves.  They are often strong and can drag you out to sea.

Those we can actually see from the shore line… they look like this:

silent undertow

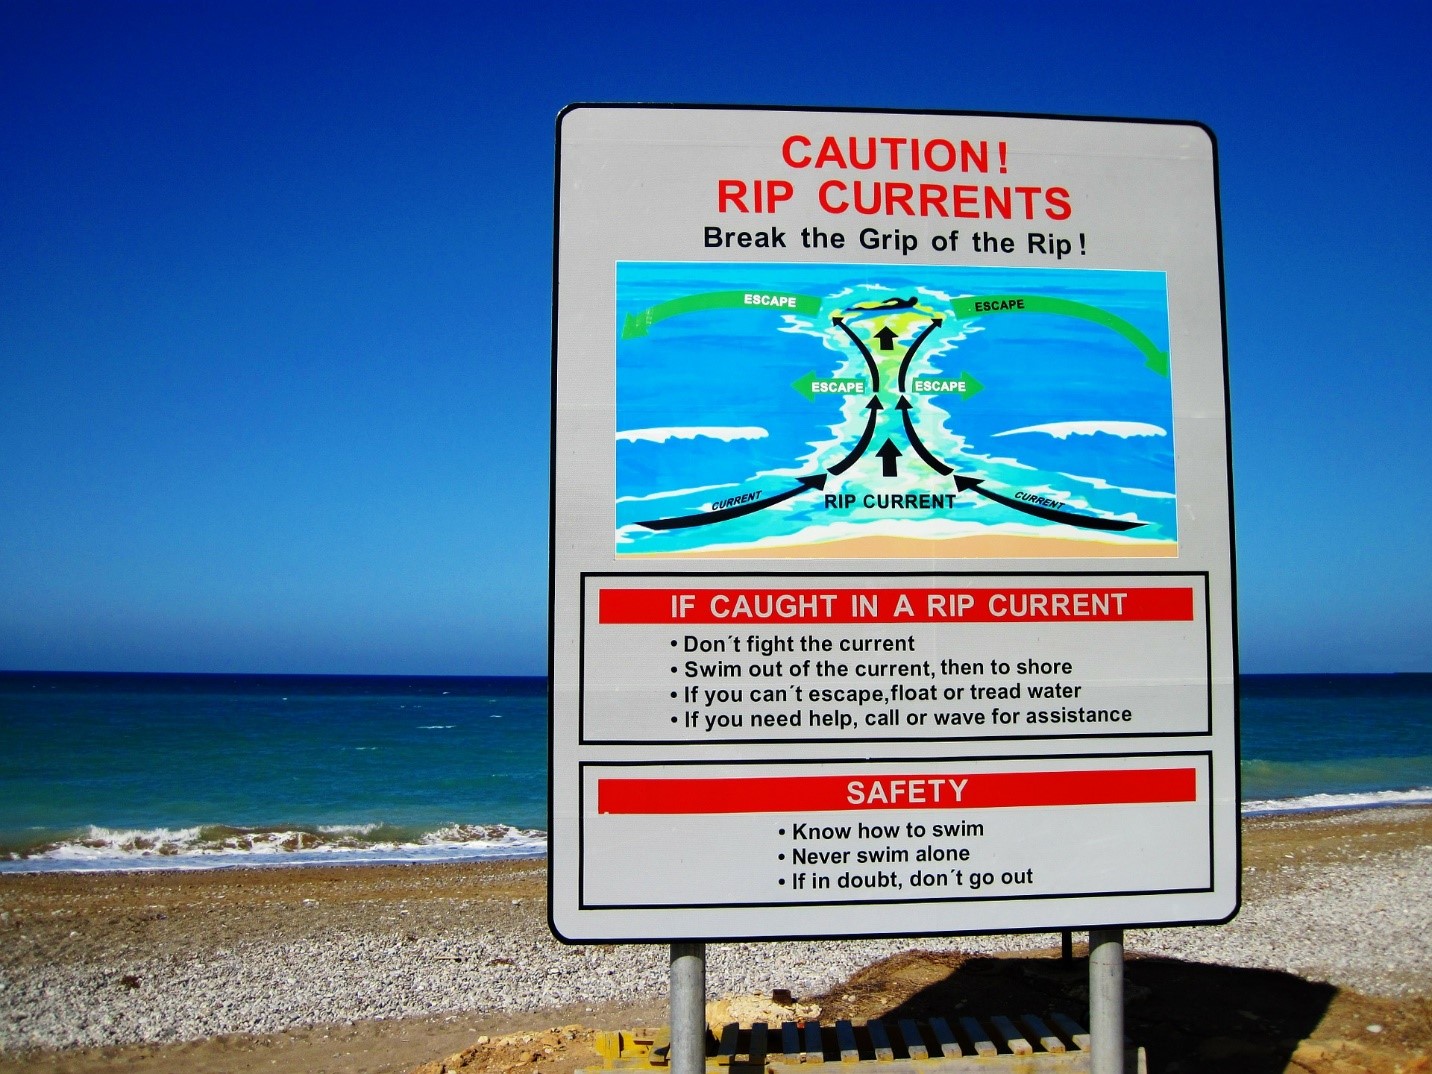
But what’s happening under the surface is harder to detect visually. One of the strongest unseen forces is the silent undertow.

It’s the underlying current that’s opposing the ocean’s waves. When the waves crash onshore- the water goes down and back out to sea underneath.

Stocks have their own currents. Think of a rip current as a force quickly pulling you away from profit, like a stock market correction. The best way to survive one is to swim sideways out of it. That is, don’t fight it.

But the silent undertow is much sneakier. For example, the indexes may show waves of money pulling prices higher. But, the undertow shows certain groups tugging the other way.

That’s what’s happening now. This is your rip current warning. The undercurrent is showing something different than the surface waves.

Money is sloshing around violently like from one side of the tub to the other. Those with a balanced portfolio can feel the rotation going on each day.

Let me explain.

Big Money Index Silent Undertow

Last week we detailed how stocks were waiting for the signal. Basically, we noticed opposing forces in our data. That trend is still around.

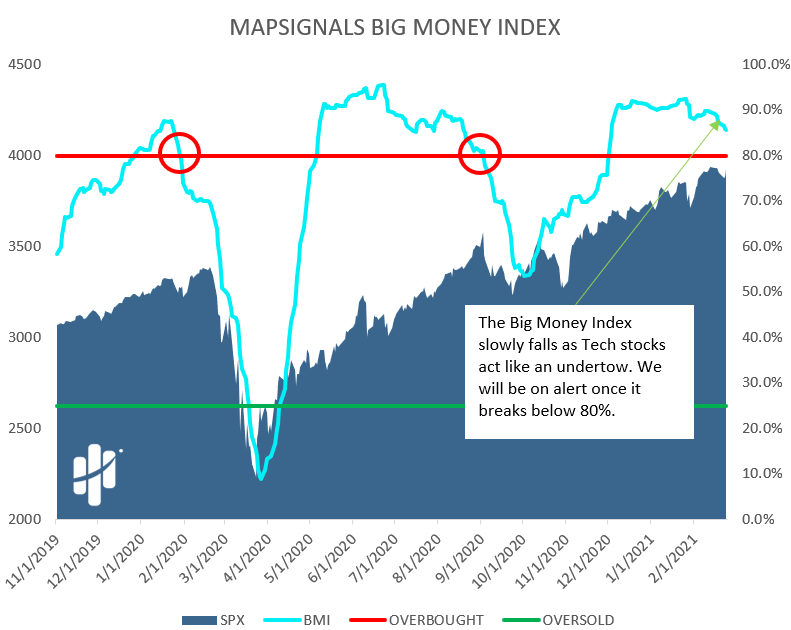
On the surface, indexes grind higher. But the undertow silently shows the Big Money Index slowly pulling lower:

big money index silent undertow

That may seem alarming,  but rest assured, there are plenty of sectors seeing the juice. Prior sagging groups are cranking higher. The re-open trade is powering the small-cap rally.

But the fuel for market strength for ages now are suddenly lagging. Tech and growth are caught in a silent undertow.

As the BMI drifts lower, remember: it measures all stocks irrespective of sector. If a few groups of the market power higher, it can offset weakness in other key areas.

That’s the push-and-pull showing up in our data.

Stock And ETF Silent Undertow

How do we really see what’s going on under the surface? First, we look at volume trends in stocks. And there is a clear trend happening right now: stock volumes are very high.

In fact, Tuesday was the second-largest volume day in 2021. That was a 3.8% swing between high and low on that day.

It started with huge selling in the morning then big buying in the afternoon. That is a choppy undercurrent right there.  Check out the study below which compares Tuesday’s (February 23rd) volumes to other big days in 2021:

outsized big money volume days

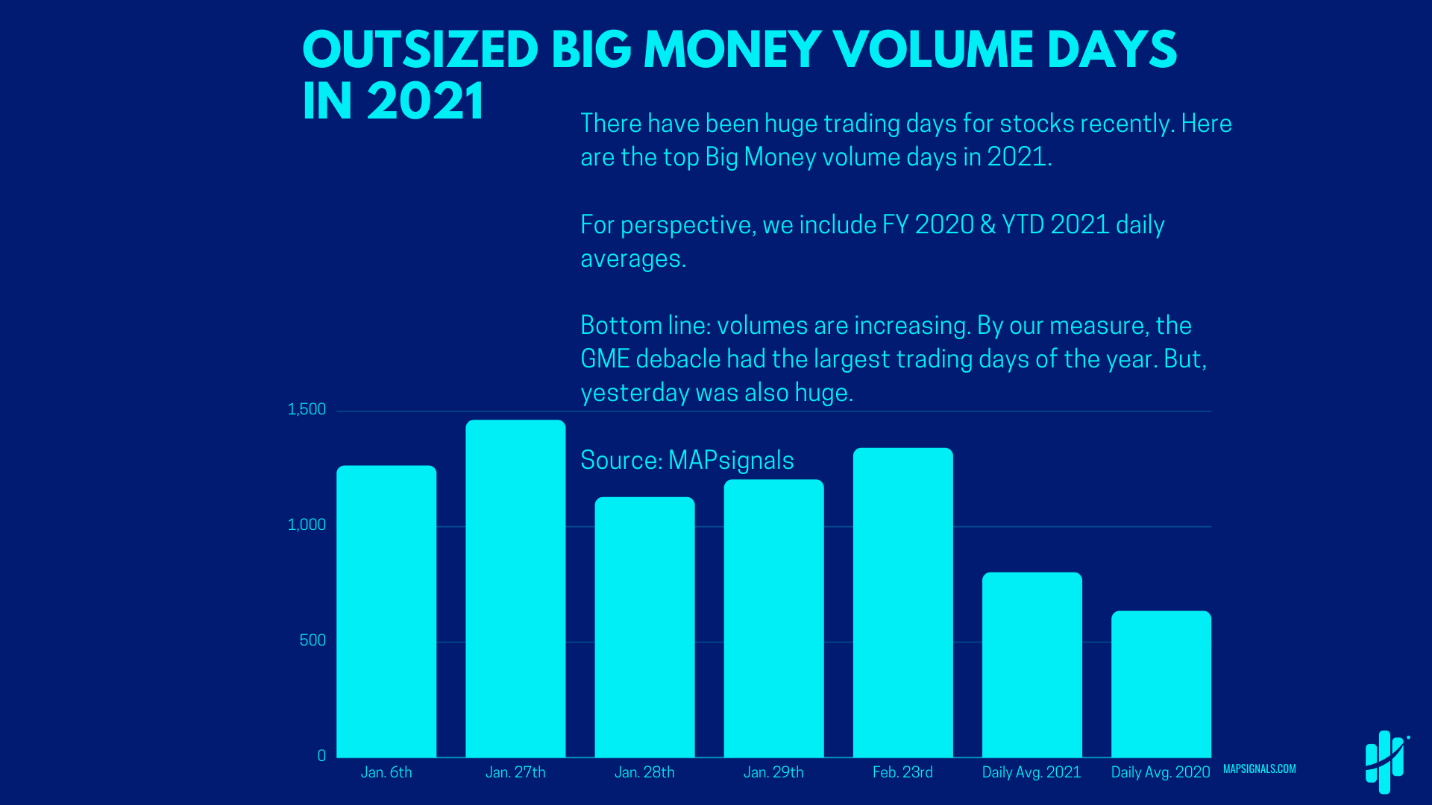
You can also see the daily average of these signals in 2021 and 2020. In other words, the pandemic chaos market. Bottom line: 2021 volumes are exploding.

Here’s another way to look at Tuesday’s crazy day:

huge big money volumes

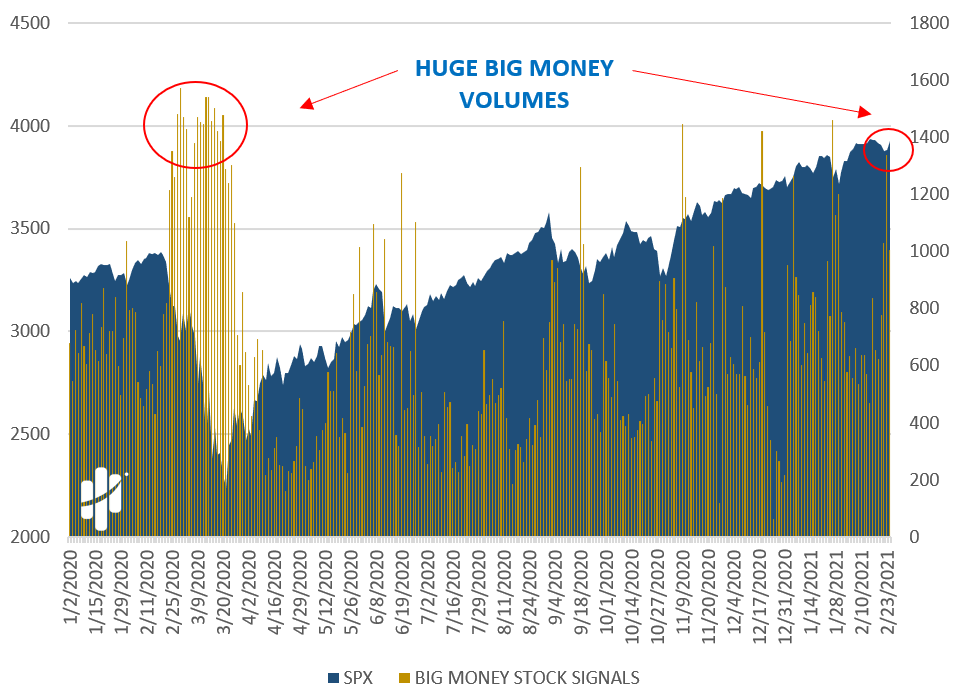
I’ve circled Tuesday’s action and the explosive volumes in the pandemic selloff. The first thing we notice of course is volumes of recent market strength come close to matching huge weakness of last year.

That means that the money changing hands is still pushing stocks higher now.

But let’s keep drilling down. Next, I’ll show you the silent undertow.

Certain growth stocks are retreating. An easy way to see this is by looking at our Big Money Stock Buy & Sells chart. These buy and sell signals determine the flow of the Big Money Index.

Again, I’ve circled what is important – the silent undertow of sellers in stocks:

big money stock buys and sells

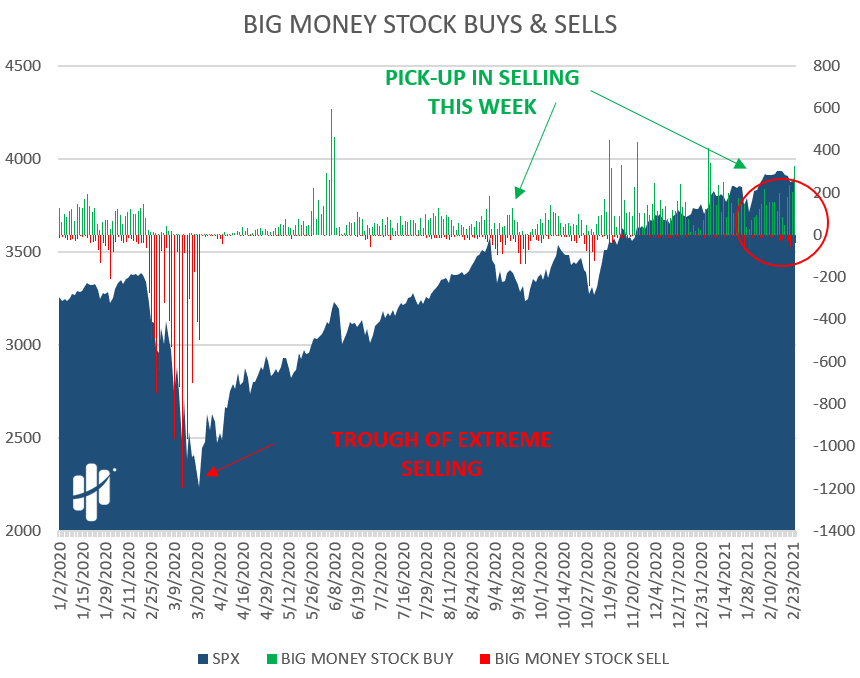
But again, indexes may seem strong because this selling is localized. Many of those red signals are Technology, Staples, & Health Care stocks feeling the pressure.

Because that’s only one part of the picture, we also see some huge green signals. That’s the wave of juice going into re-open stocks.
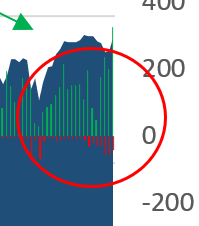
Here’s a zoom in:

big money stock buys and sells zoom in

Now, that’s not the only silent undertow we can see. There’s a big-ole’ tug-of-war in ETFs too.

Like the chart above, we see the same action for ETFs. Below shows Big Money ETF Buys & Sells. Naturally, ETFs also represent waves in the stock market. As you can see, there has been a Jekyll-and-Hyde here too:

big money ETF buys and sells

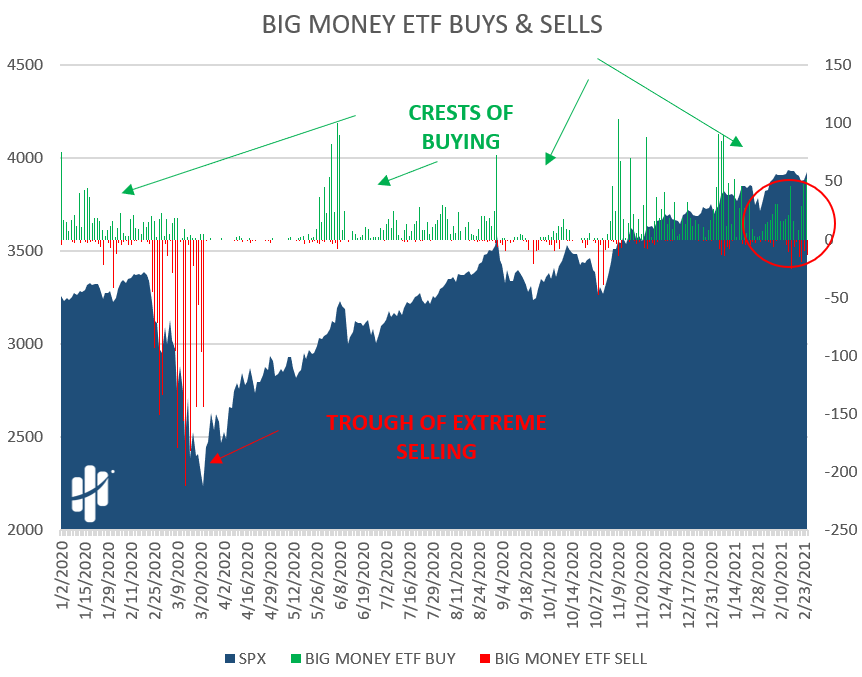
Like with stocks, ETFs are feeling the push and pull. Let’s zoom in:

big money ETF buys and sells zoom in

The big green bars are mainly re-open themed funds. Energy, Financials (Banking), Real Estate, Leisure, Industrials, and small-cap funds are getting bought.  The selling is revealed in Utilities and Bond ETFs.  As the market expects higher interest rates, debt instruments fall.

Let’s wrap this all up. In last week’s post we said how there’s a mixed message happening with stocks. The divergence we noticed then, is slowly intensifying. What we have is a big fat rotation.

Here’s the bottom line: Money is pouring into reopen sectors like Financials, REITs, Discretionary, & Industrials. But, growth-heavy sectors are feeling the silent undertow: Technology, Health Care, & Staples.

The market’s lifeguard is signaling danger to blissfully unaware swimmers.

From our lifeguard chair- we’ll continue to monitor the choppy water and give you updates. For now, inexperienced swimmers, stay close to shore. Surfers may enjoy the swells. In this environment though- things can shift quickly.

Keep an ear out for the whistle.

***MAPsignals subscribers, look for a video update tomorrow in the Member Updates section!

Lucas Downey
Lucas Downey

Lucas is co-founder of MAPsignals. His full bio can be found here.
Prior to MAP, he was Head of ETF Sales at Cantor Fitzgerald & SVP of Derivatives at Jefferies, LLC.

Spread the word!

Category: All, Big Money Insights Weekly

Previous Post: «Waiting for the signal Waiting For The Signal
Next Post: Flying South flying south»

Reader Interactions

Comments

  1. Robert

    February 25, 2021 at 4:42 pm

    Beautifully written, again! Nice structure, entertaining often, great message. Way to go!

    Reply
  2. merlyn

    February 25, 2021 at 6:34 pm

    entertaining as always! the way the article written is catchy and clearly painted the overall picture. Kudos!

    Reply
  3. Kevin

    February 25, 2021 at 7:21 pm

    When is the BMI index coming to high-growth stocks? ?

    I kept looking at the BMI. . .only Tuesday did I realize what was happening, and the subject of this well written article. . .

    In hindsight, solar was first to go, but I figured this was sector specific, had I had the BMI for high growth stocks, maybe I’d have been prepared? ?

    Does this even make sense? Some young ppl only invest in high growth stocks. . .would it just look too crazy? Constantly bouncing from under and overbought so as not to be helpful?

    This is, and has been an incredible learning experience, seeing my portfolio drop as much as it did, yet the general market uptrends!

    While I think the whistle has been blown on high growth already, I’ll keep ears to the ground for those pocket aces!

    Reply
    • MAPsignals Staff

      February 25, 2021 at 7:27 pm

      We are going to have a beta dashboard this year for our users. I’m hoping we can learn more about our data with other people diving into it.

      We could theoretically make a version of the BMI for any index. But, we have to test it to be sure. Markets do some funky things sometimes.

      Never forget the first rule of MAP club, “never fight the BMI.”

      Reply
      • Kevin

        February 25, 2021 at 7:48 pm

        True Life!

        Be it Feb. 27, Sept. 2, Nov. 6, or now Feb. 23rd, always a different narrative!

        Thanks for all the work and creativity you put in!

        Reply

Leave a Reply Cancel reply

Your email address will not be published. Required fields are marked *

Primary Sidebar

Get Big Money Insights for FREE

Want to know where the Big Money is headed?

Just enter your email address below. You'll get our FREE NEWSLETTER sent directly to your inbox.

We call it Big Money Insights... It’s your weekly sneak peek at the powerful market-moving forces that are hidden from 99% of investors.

"*" indicates required fields

This field is for validation purposes and should be left unchanged.

Categories

  • All
  • Big Money Insights Weekly
  • Big Money Series
  • Macro Insights
  • MAP In The Media
  • Members Only
  • Performance
  • Podcast
  • Special Reports
  • Stocks
  • Videos & Interviews
  • White Papers

Archives

  • February 2023
  • January 2023
  • December 2022
  • November 2022
  • October 2022
  • September 2022
  • August 2022
  • July 2022
  • June 2022
  • May 2022
  • April 2022
  • March 2022
  • February 2022
  • January 2022
  • December 2021
  • November 2021
  • October 2021
  • September 2021
  • August 2021
  • July 2021
  • June 2021
  • May 2021
  • April 2021
  • March 2021
  • February 2021
  • January 2021
  • December 2020
  • November 2020
  • October 2020
  • September 2020
  • August 2020
  • July 2020
  • June 2020
  • May 2020
  • April 2020
  • March 2020
  • February 2020
  • January 2020
  • December 2019
  • November 2019
  • October 2019
  • September 2019
  • August 2019
  • July 2019
  • June 2019
  • May 2019
  • April 2019
  • March 2019
  • February 2019
  • January 2019
  • December 2018
  • November 2018
  • October 2018
  • September 2018
  • August 2018

Follow us on Twitter

MAPsignals Follow 1,449 1,070

MAPsignals is a data platform that tracks institutional money flows in stocks and ETFs. Sign up for free insights here: https://t.co/SaAVHjKC9J

mapsignals
mapsignals avatar; MAPsignals @mapsignals ·
19h 1622987016957820928

One of my favorite #dividend #stocks having a day - Skyworks Solutions $SWKS - owned it for years

The $2B buyback is pretty significant given the market cap is sub $19B

#Semiconductors continue to see major inflows

Reply on Twitter 1622987016957820928 Retweet on Twitter 1622987016957820928 0 Like on Twitter 1622987016957820928 2 Twitter 1622987016957820928
Load More...

Footer

© 2021 Mapsignals.com

  • Home
  • Contact & Disclaimer
  • Privacy Policy
  • Terms & Conditions
  • Opt-out preferences
  • FAQ

Copyright © 2023 · Mai Law Pro on Genesis Framework · WordPress · Log in

✕
What Happened to Risk Assets White Paper is Here

Get your copy here and take a journey through our thoughts on margin and leverage.

Enter your email address below and you'll get our FREE NEWSLETTER sent directly to your inbox. 

 We call it Big Money Insights... It’s your weekly sneak peek at the powerful market-moving forces that are hidden from 99% of investors.