
Gradually Then Suddenly
Bill: How’d you go bankrupt?
Mike: Two ways. Gradually, then suddenly.
This awesome quote from Earnest Hemingway’s The Sun Also Rises points out how trends can go.
Usually, trends take time to form and play out. But like a snowball rolling downhill, they gain momentum and power with time.
If you want some good examples, think of the power of compound interest or the geometric growth of technological innovation. It’s natural for humankind to build and thrive.
And what better human behavior barometer is there than the stock market? It’s inundated with short-term themes. But there is one trend that happens gradually then suddenly: stock markets go one direction over time…UP.
Inside of that overwhelming uptrend however, is a little secret. Only a thimble’s worth of stocks account for all of the market’s gains (above treasury bills) for the last ~100 years.
So, while stocks climb gradually year-after-year…holding that thimble of outlier stocks is where huge gains are hidden.
Here’s why I bring this up: our data is suddenly showing many of our favorite stocks signaling upside. Because MAPsignals all-stars are starting to get love, it’s time to get pumped up!
When that happens, zip up the spacesuit and strap in. Earnings season is the spark needed to ignite the outlier stocks’ rocket for the next leg higher.
Now I’ll walk you through how our data says stocks are ready to launch.
Big Money Index Lifts Gradually Then Suddenly
To gauge the true internals of the market, we follow the BMI. It plots unusual buying and selling of stocks.
When big buying increases, the index lifts – hoisting the market higher. That’s what we see now:
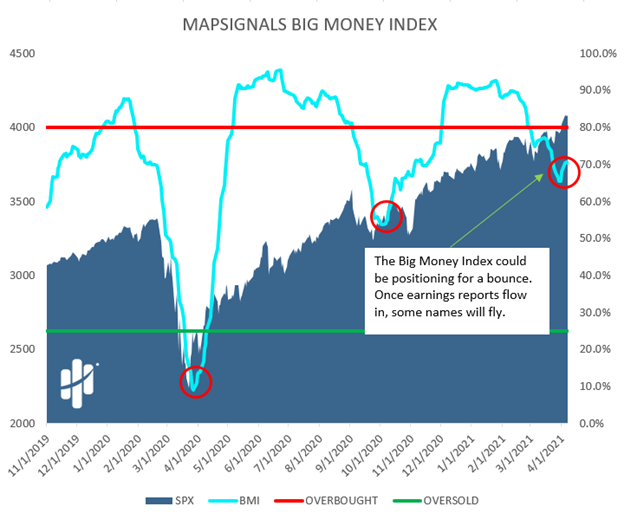
As you can see with the red circles, uptrends in the BMI can start gradually then suddenly rocket higher.
That behavior along with some outliers showing sudden buy signals tells us what’s coming: JUICE.
Now, let’s get more granular and look at daily stock signals.
Stock Buying Is Increasing Ahead of Earnings Season
Last week we pointed out how stock trading is usually light heading into earnings season. If you missed it, read our post Déjà vu All Over Again. That theme is starting to shift.
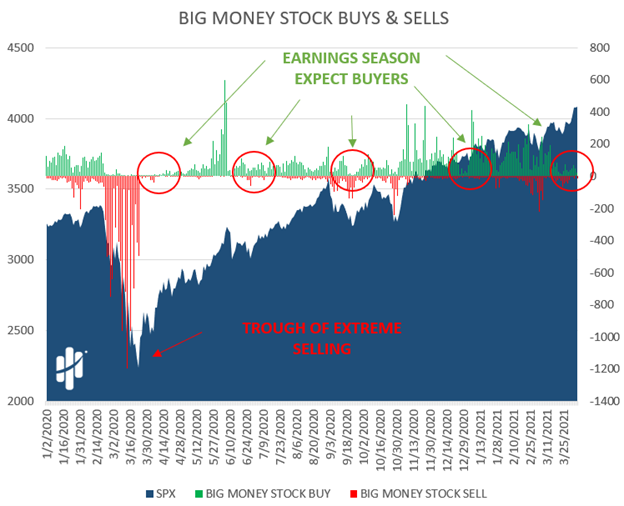
Buying started gradually then suddenly even more buyers are showing up.
Below you can see our Big Money Stock Buys & Sells chart. Green bars are the daily buys of stocks and red are the sellers.
You can see the green signals are starting to ramp. If it continues, the BMI will race higher:
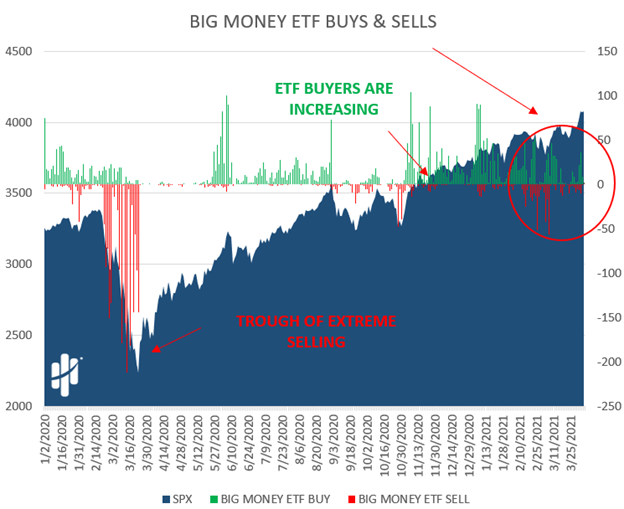
And that’s not the only green glow. When stock buyers appear, usually ETF buyers arrive gradually then suddenly too.
Check out the green juice circled off to the right:
Buying is just buying, however it’s crucially important what is being bought. Look, it’s nice buyers are starting to come around. But, under the surface there’s a bid for growth. And that’s one key that’s been missing in our data for over a month.
That’s been the weight around the BMI’s ankles.
This new perk of growth buying means that we’re likely on the cusp of some big up-moves in high-quality outliers.
MAPsignals subscribers, pay attention to the Top 20 report this week and next. Quality semiconductors and small-cap growth stocks are topping the list. Some of those names will lift gradually, then suddenly make you rich.
It reminds me of the Big Money story of Facebook, Inc. (FB). It was a slow climb over the years…but, 72 Top 20 appearances since 2012 told us all we needed to know.
The Big Money is made gradually, then suddenly. In the end, you’re sitting on a monster stack. Below you can see the recurring Big Money theme of Facebook.
It’s been a runaway train in our data and vaulted roughly 689% since Big Money started getting in. We expect many new names recently getting Big Money attention to set up for similar:
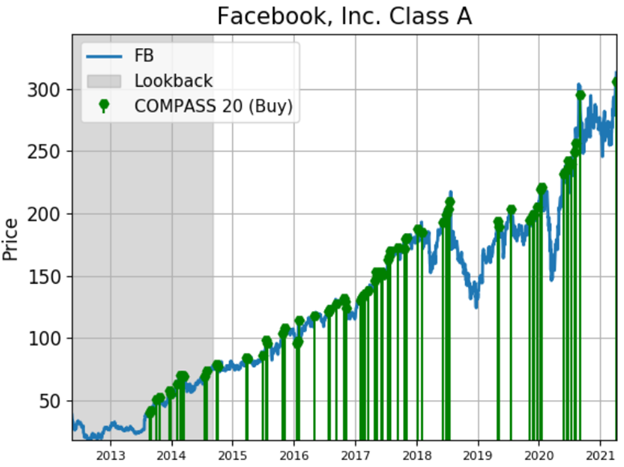
Source: MAPsignals, End of day data sourced from Tiingo.com
Yes, FB took years to play out, but other times juice happens faster than a speeding ticket, like with Kohl’s Corp. (KSS). We recommended buying the KSS April 25 Call for $2.91 back on November 1st, 2020.
That option expires next Friday:
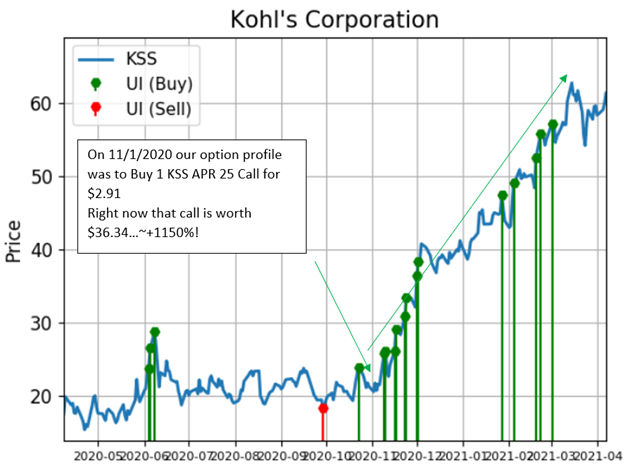
Source: MAPsignals, End of day data sourced from Tiingo.com
By now, you know the story. The gains happen gradually then suddenly after holding you get a windfall! That’s why we’re not like other options traders in-and-out. We believe in holding options right up until expiration to get the most juice.
Let’s wrap this all up.
Here’s the bottom line: Multiple MAPsignals’ datapoints say that outlier stocks are ready to roll. And that’s a change in tone from weeks ago.
Our message has been to add on dips. That’s how we’ve been positioning.
The payoff is coming…history says so, and so does our data.
The MAPsignals playbook is generally pretty simple:
1) Buy and hold but not ordinary stocks- buy outliers. Never forget that.
2) Add to amazing companies on pullbacks. We’ve done that here for years…because it works.
That is all.
Seriously though, I can’t tell you what to do, but what I do know is this: Eventually buyers will arrive gradually, and suddenly the crowd will watch in amazement.
Don’t be a spectator…
More wisdom from Hemingway takes us out: “Never mistake motion for action.”
***And just for fun we did a quick rundown of this week’s data on our YouTube channel. Check it out below!