
Macro: How to Play the Stock Market Chop Before the Pop
Stocks have had an amazing run.
The S&P 500 rallied 22% from its late October lows. It’s north of 5000. That’s one of the steepest 3 ½ month rallies of all time!
Regular readers know we’ve been bullish the whole way. But it’s time for stocks to catch their breath.
Today, we’ll show you how to play the stock market chop before the pop.
Our macro indicators support a buy the dip attitude. A few sectors have the most upside.
OK let’s hop to it.
Rate Cuts May Be Delayed, But They Won’t Be Denied
Falling interest rates and hopes for Fed rate cuts have been the biggest macro drivers fueling this rally.
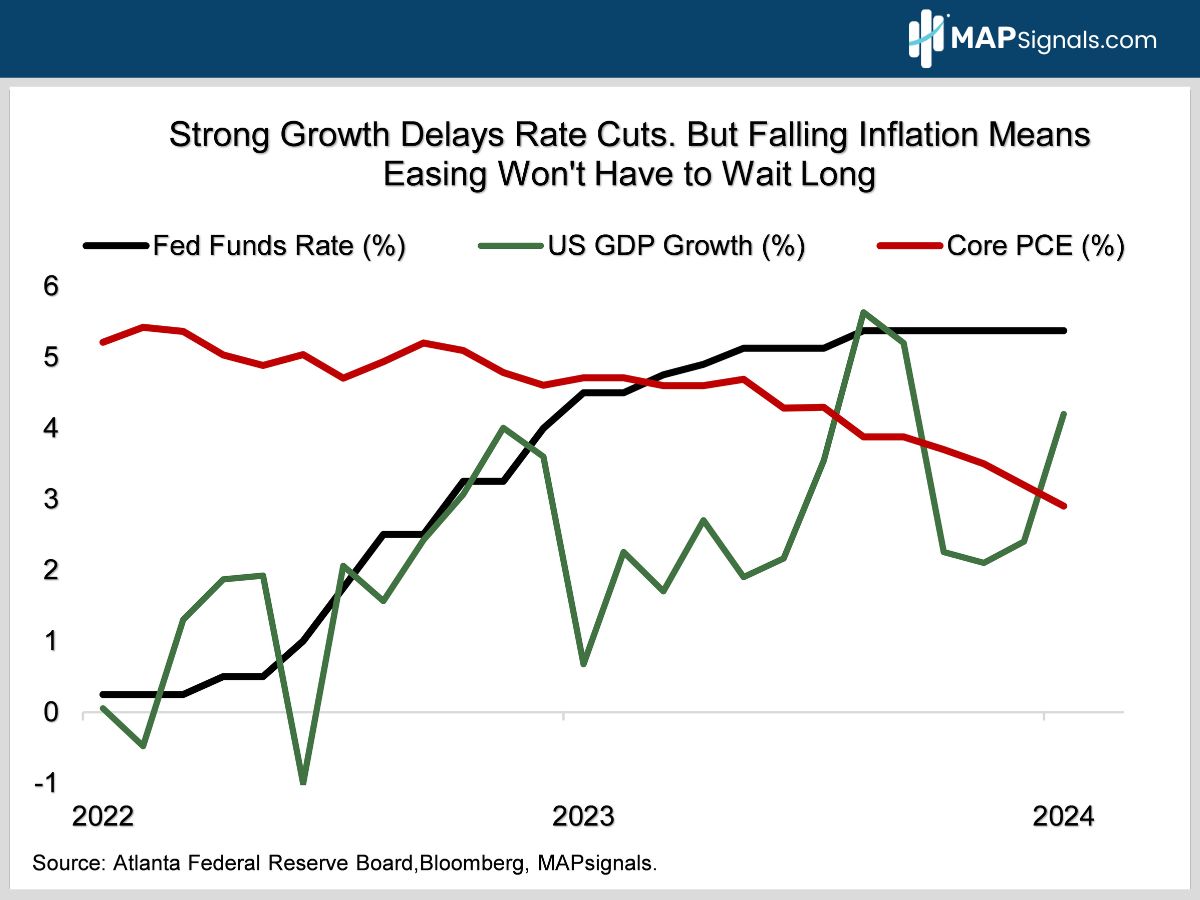
But with economic growth continuing to surprise to the upside (chart), markets are betting the Fed is likely to be more gradual in easing monetary policy.
Interest rates have perked up lately as market expectations for the first Fed rate cut have been pushed out to June from March. The 10-year Treasury yield has popped above 4.15% from its December low at 3.8%.
That’s starting to pressure interest rate sensitive sectors like small caps, regional banks, real estate, utilities, materials, and biotech. All of these areas are down YTD, sharply underperforming the S&P 500’s 5.5% gain.
The good news is inflation is falling (chart). So, while rate cuts may be delayed, they won’t be denied.
Meanwhile, strong growth is powering record S&P 500 earnings, which should be up 9% this year.
That’s why the S&P has been so resilient even as smaller pockets of the market have been hit pretty hard.
On the heels of an epic run, we think increasingly crowded institutional investor positioning makes a choppier market likely.
To be clear, we’re still bullish. We’re just looking for some consolidation before the next leg higher.
Institutional Money Flows Signal Short-Term Profit Taking Likely
Are we getting the same tactically cautious message from MAPsignals’ Big Money Index?
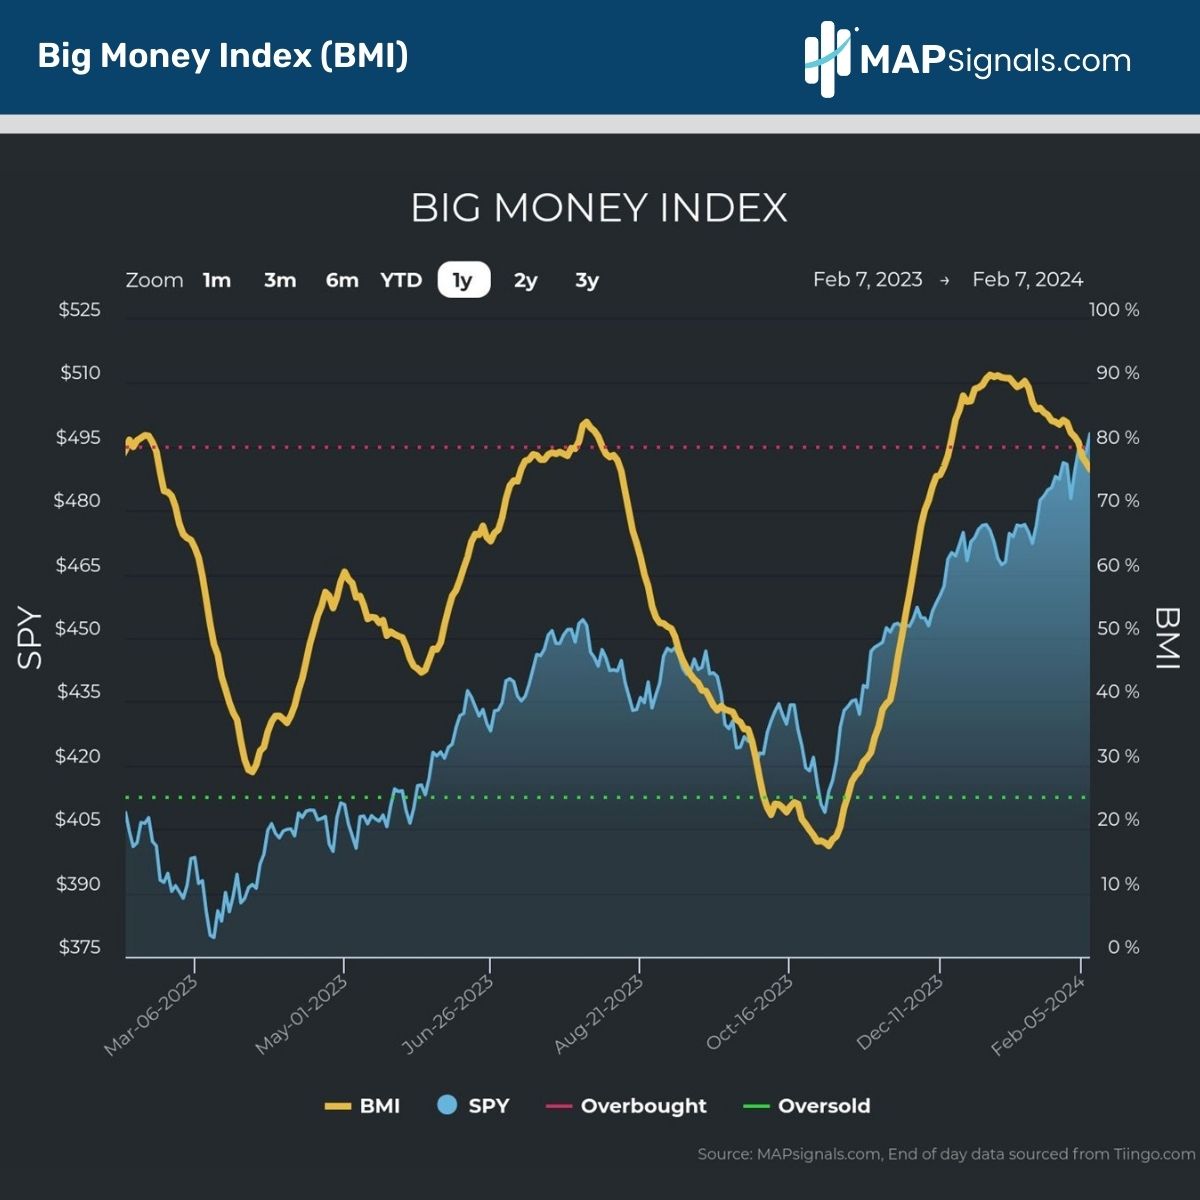
The Big Money Index (BMI) is a fantastic timing tool. The BMI tracks institutional investor positioning.
Subscribers know we’ve been nailing market pivot points with it for years.
Here’s how the BMI works:
Readings under 25 are rare and indicate stocks are oversold and it’s time to buy. Conversely, readings over 80 mean stocks are overbought and traders should lighten up once the indicator heads south.
The BMI rightly told you to buy stocks in October 2022 at the bear market bottom when it went oversold at 25. Then it told you to buy the dip last March when it tanked to 29.
Then it nailed last July’s peak when it said to sell stocks as it went overbought at 84.
Most recently, the BMI slumped down to a super-low 17 in October. It was rightly telling you to buy right as stocks were bottoming out. The S&P 500 is up over 20% since its October 27 low at 4103.
Let’s face it, the BMI has an amazing batting average!
OK let’s see what the BMI is telling us now. It just fell out of overbought territory to 76 on February 7:
Since 2009, the S&P 500 has a negative performance 1-week to 2-months after falling out of the overbought zone.
Below shows how this sour performance is in stark contrast to the average “normal” return of the index:
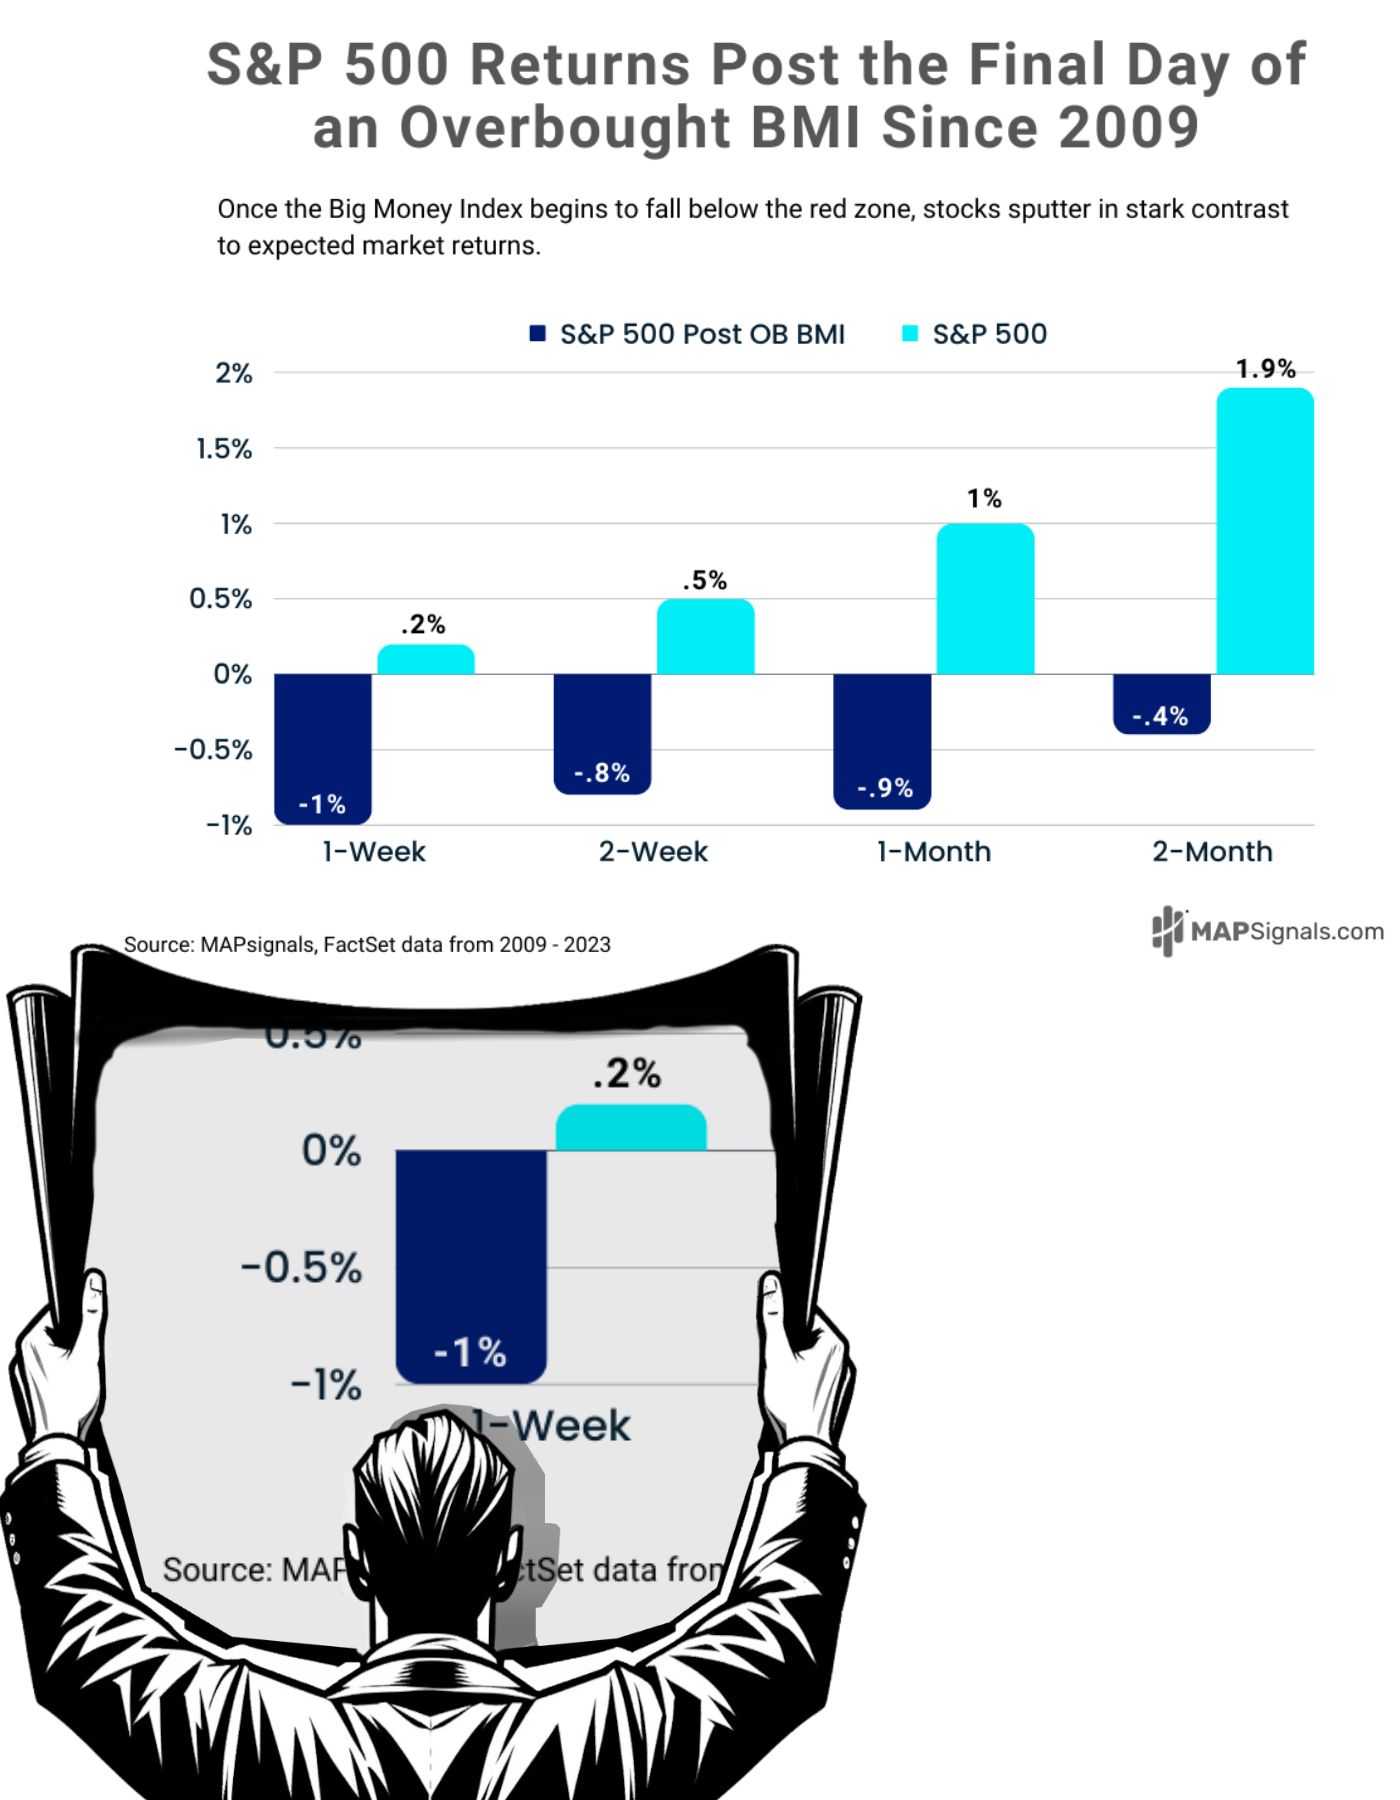
Based on the latest downtrend in the BMI, you should expect some volatility soon.
Odds are we’ll get the long-awaited pullback.
How to Play the Stock Market Chop Before the Pop
We’d buy the dip. Here’s why:
Inflation is falling. Sure, service inflation is a bit sticky, and prices won’t fall in a straight line, but the overall trend is clearly lower (see chart 1).
As long as that’s the case, the Fed will be forced to start cutting rates soon.
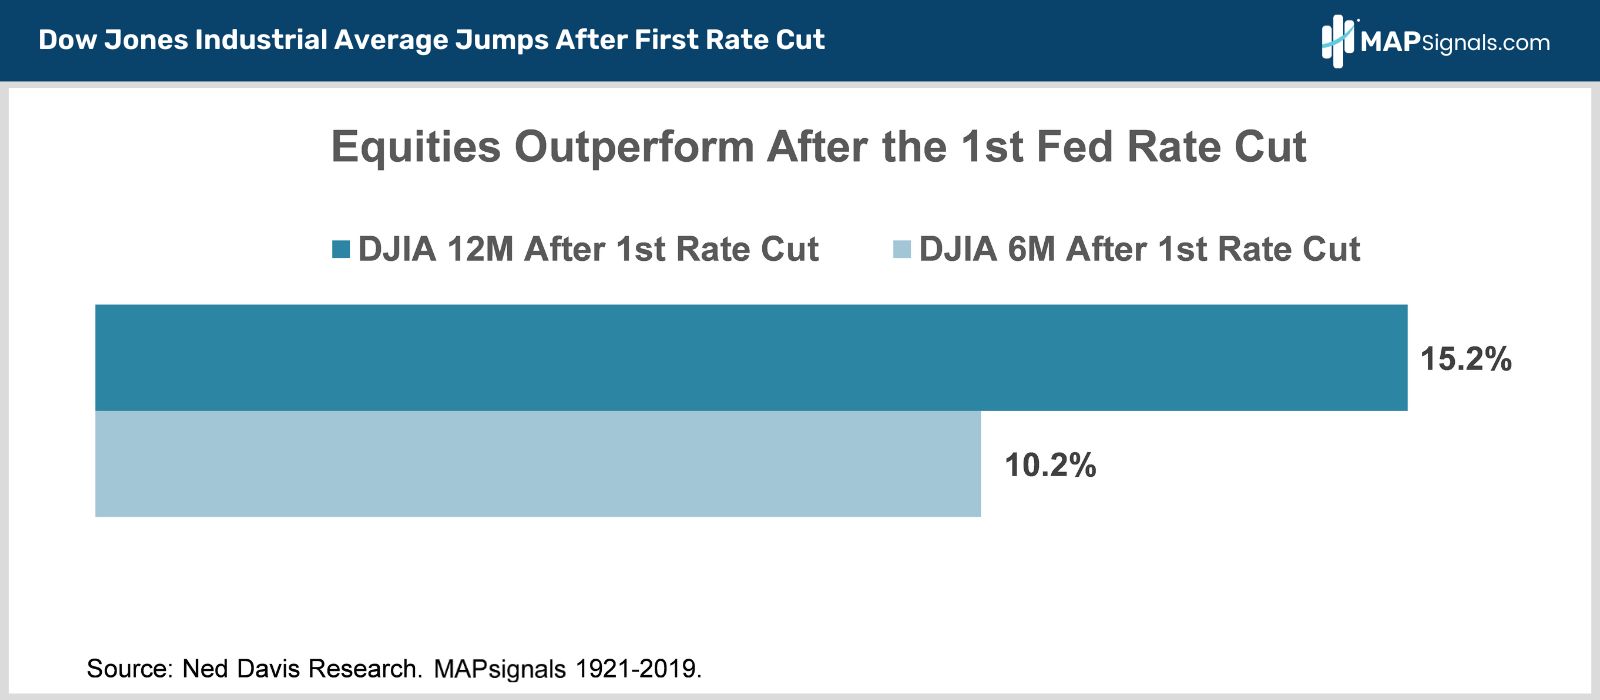
Here’s the best part. Check out this next chart.
Since 1921, the Dow has averaged 10% gains in the 6 months after the first rate cut and 15% advances after 12 months. That’s about 50% more than stocks typically gain over average 6- and 12-month periods!
While we are expecting near-term market choppiness, don’t lose sight of the bigger picture.
Rates are coming down, stimulating the equity rally:
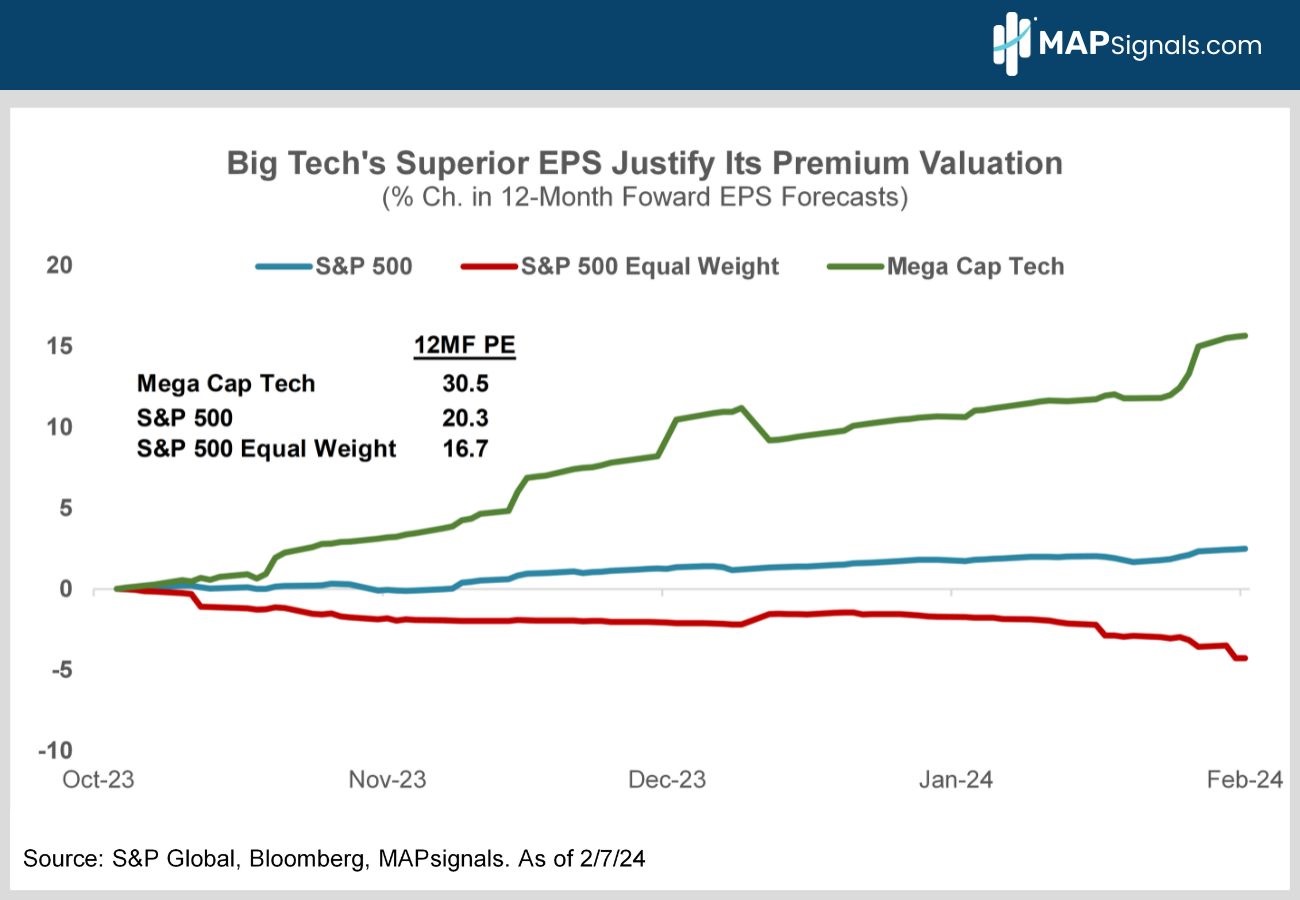
We rode the tech train hard last year. In January, we told you technology would keep outperforming on the back of a superior earnings outlook.
That’s exactly what happened. Mega cap tech’s profits are soaring.
Big tech’s 12-month forward earnings have been revised 15.6% higher since October vs. only a 2.5% upward earnings revision for the S&P 500 (chart).
The Equal Weight S&P 500 Index, which dilutes tech’s weight by weighting all 500 stocks equally, has actually seen its 12MF EPS revised 4.4% lower since October.
The bottom line is big tech’s premium valuation is easily justified by its much faster earnings growth (chart).
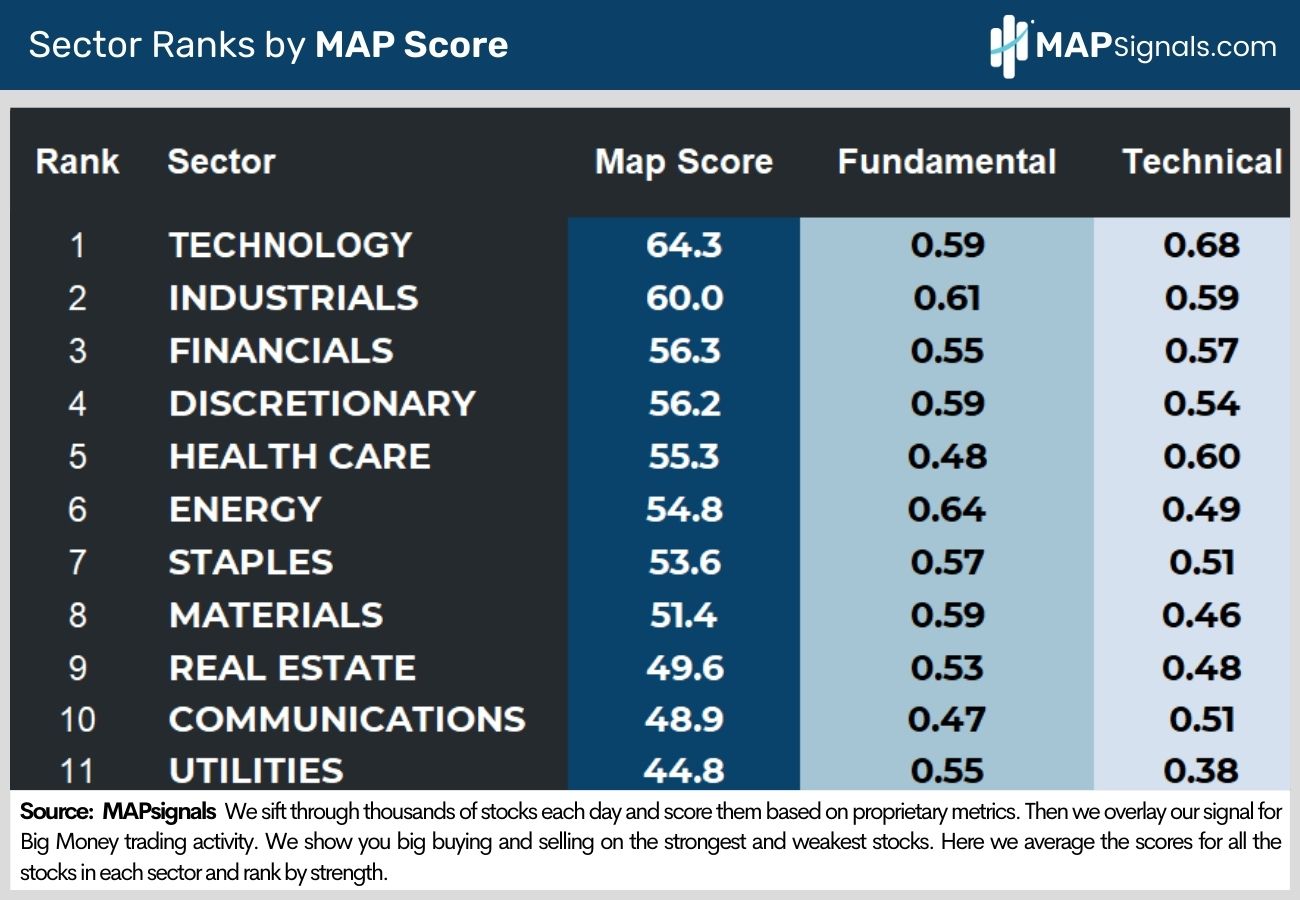
Tech is still our top ranked sector. It’s the first sector we’d buy on any material weakness.
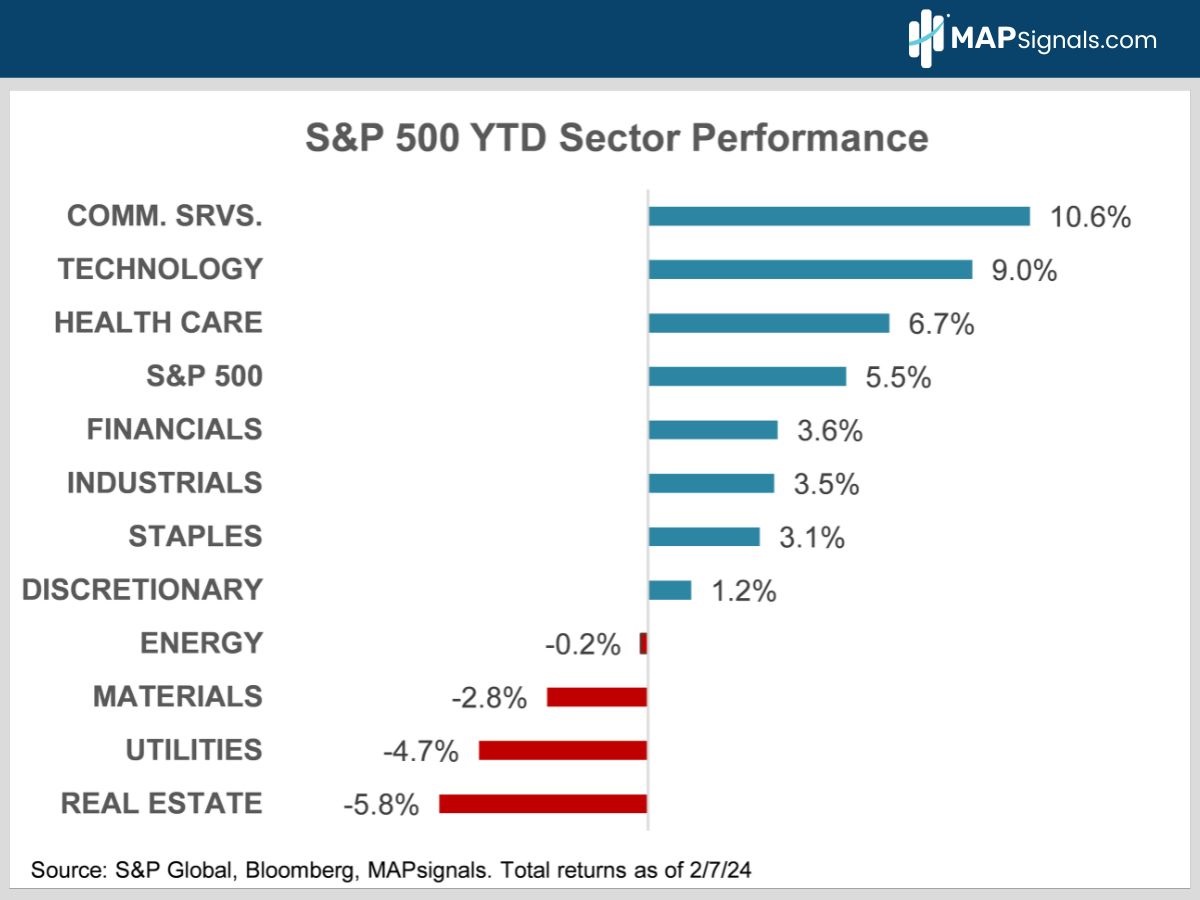
In January, we told you the rally would finally broaden out and to overweight two of 2023’s biggest laggards – health care and financials.
It’s early days but so far so good, they’re the top YTD sector performers outside of tech (chart).
Healthcare is forecast to post 15% earnings growth this year – the highest of any S&P sector. It trades at a 12-month forward PE of only 19X giving it a P/E to growth ratio of about 1.2 – the lowest of the S&P’s 11 sectors.
Regulatory worries really held health care back in 2023. The website Predict It now forecasts Trump edging out Biden by 5% in the Presidential election. Their data looked more like a toss-up a few weeks. Even though a Trump presidency is far from certain, the prospect of a GOP win is bullish for medical stocks.
As for financials, blue chip banks are holding up well despite regional bank stress. The sector’s 5% consensus estimated 2024 EPS growth forecast is likely too low.
As the Fed cuts rates, short-term bond yields will fall, steepening the yield curve.
Banks borrow short and lend long so a steeper yield curve makes their loans more profitable. It boosts banks’ net interest margins.
And the sector is home to a lot more than banks. Financial data vendors like S&P Global and MSCI, credit card companies like Amex and Visa and investment banks like Goldman Sachs and Morgan Stanley are doing very well.
The sector is also the 2nd cheapest in the market with a 14.7X 12MF PE.
As for the rest of the market, many interest rate sensitive sectors like small caps, regional banks, real estate, utilities, materials and biotech are all lagging badly. They’re all in the bottom half of our sector rankings.
They will all do better once the Fed pivots to rate cuts. Until then, expect them to keep underperforming.
Bringing It All Together
Stocks have had an amazing run.
But with economic growth continuing to shine markets are betting the Fed won’t cut rates until June.
Interest rates have perked up. That’s starting to pressure interest rate sensitive sectors.
What’s more, increasingly crowded institutional investor positioning also makes a choppier market likely.
And an overbought BMI agrees. That’s a powerful combination!
To be clear, we’re still bullish. We’re just looking for some consolidation before the next leg higher.
After all, inflation is falling. So, while rate cuts may be delayed, they won’t be denied. And strong growth is powering record S&P 500 earnings.
We’d focus on buying tech, health care and financials on weakness.
If you want to find specific technology, health care and financial stocks ramping with Big Money support, get started with a MAPsignals PRO subscription. It’ll get you access to our portal that updates every morning, showcasing the stocks getting bought and their scores.
MAP your own stocks and ETFs. AND you’ll get our prized Top 20 list in your inbox every Tuesday!
There are plenty of winning stocks to pick up on sale as the market pulls back. If you’re a Registered Investment Advisor (RIA) or are a serious investor, use a MAP to find them!
Invest well,
-Alec