
Stocks Surge Out of Oversold Conditions
Markets remain under pressure. This offers good news for investors.
Why?
Because stocks surge out of oversold conditions.
The selloff playbook has worked to a tee since late July. Extremely overbought conditions rarely result in great entry levels.
The call to prepare for a summertime pullback was prescient, as it foreshadowed a 4.56% fall in the S&P 500 since. That’s a cakewalk compared to small caps. The Russell 2000 has performed more than doubly worse with an 11.23% drubbing.
While pullbacks can be unsettling, after relentless carnage, equities are reaching more attractive levels.
Today, we’ll tackle what’s driving the selloff. Then we’ll dive into the Big Money landscape.
Even though stocks remain oversold, one historical study suggests we are getting closer to liftoff.
Rising Interest Rates Anchor Stocks
Turn on any financial news network and chances are the lead storyline will be all about rising interest rates. The 10Y yield broke out to 4.96% this morning…levels unseen since 2007:
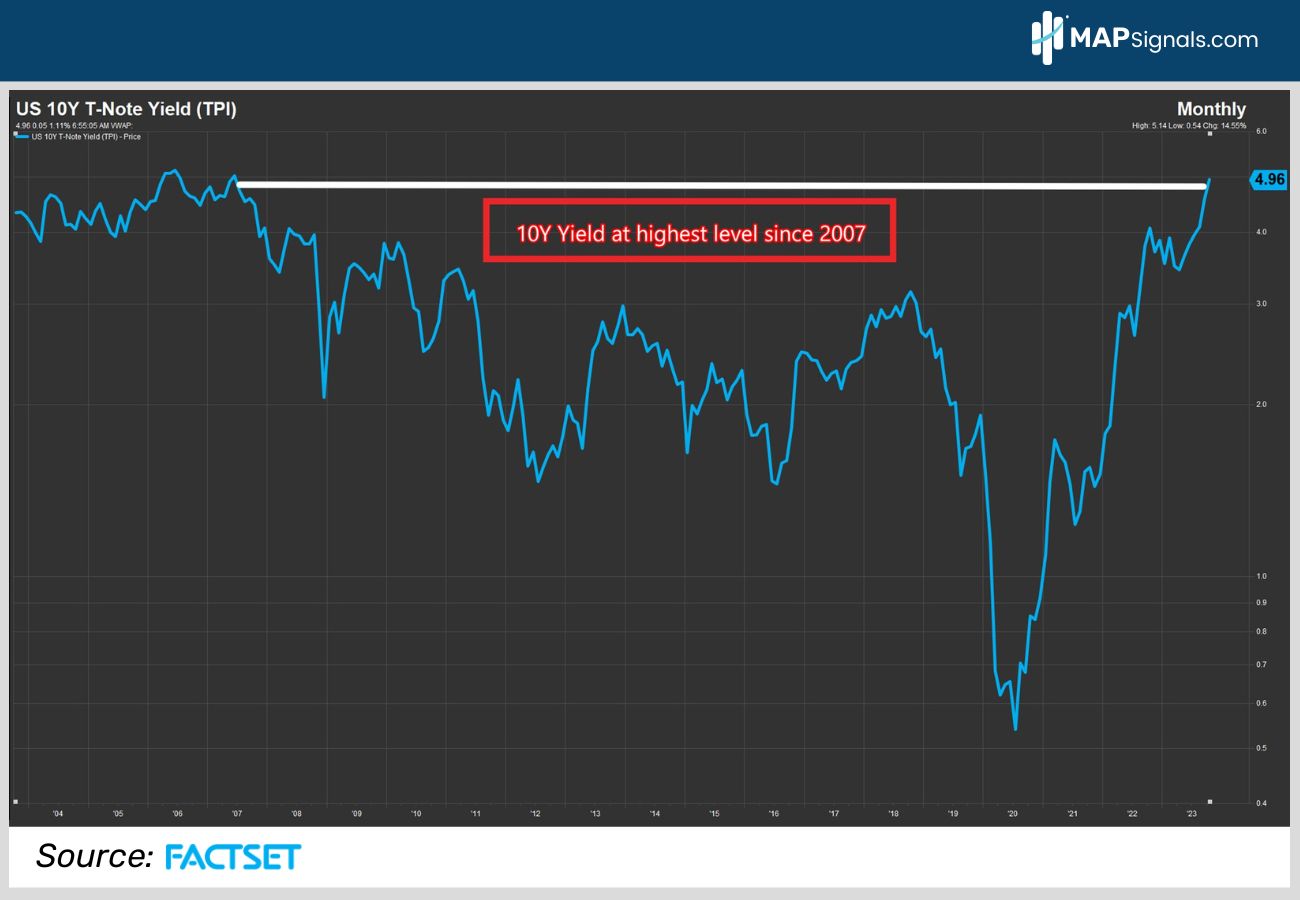
This spike in rates has caused investors to rethink their equity allocations. It’s been over a decade since treasuries offered a challenge to equity returns.
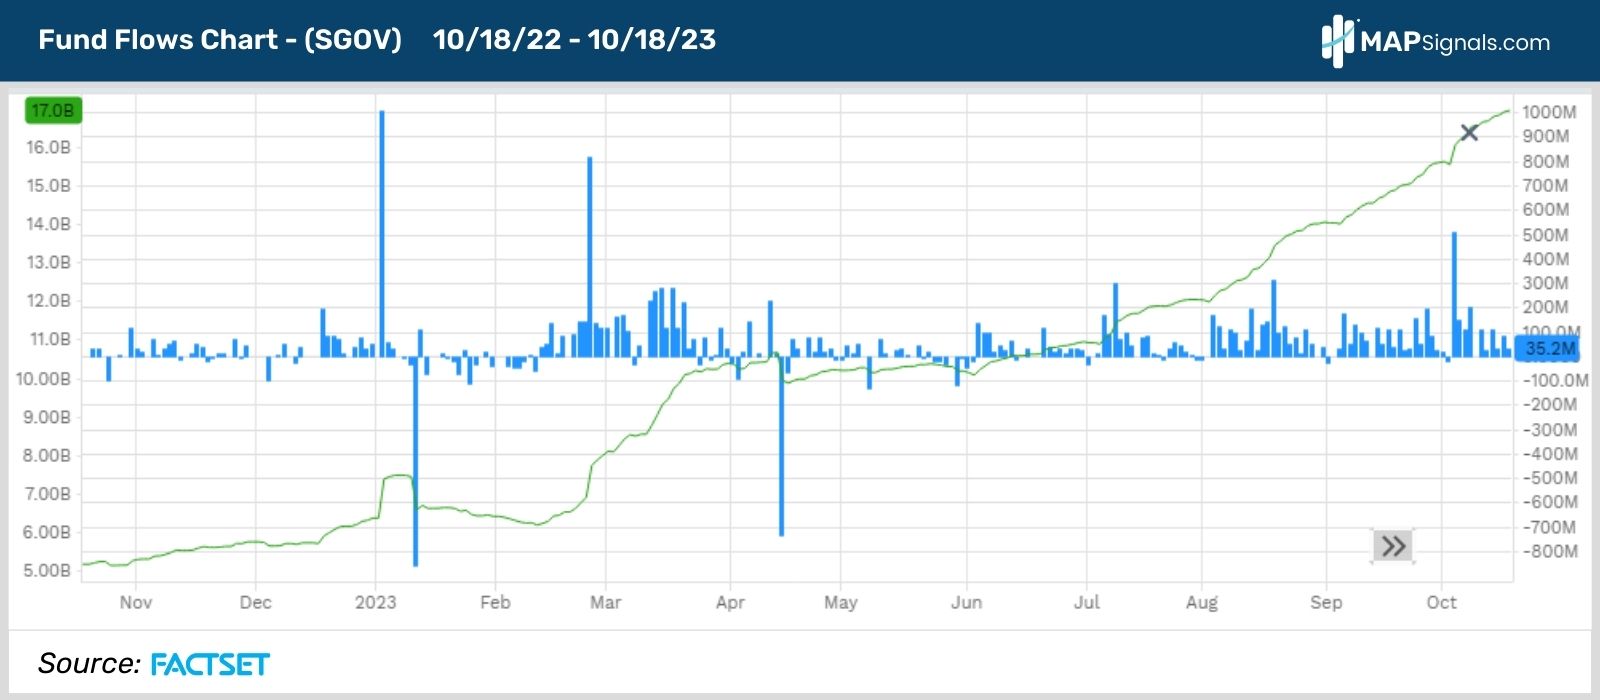
Investors are chasing yield. It’s notable that 3-month T-bills offer rates of 5.49%. That risk-free income has driven investors into popular treasury bond ETFs.
One example is the iShares 0-3 Month Treasury Bond ETF (SGOV). Below shows how AUM sat at nearly $5B a year ago and has now ballooned to $17B:
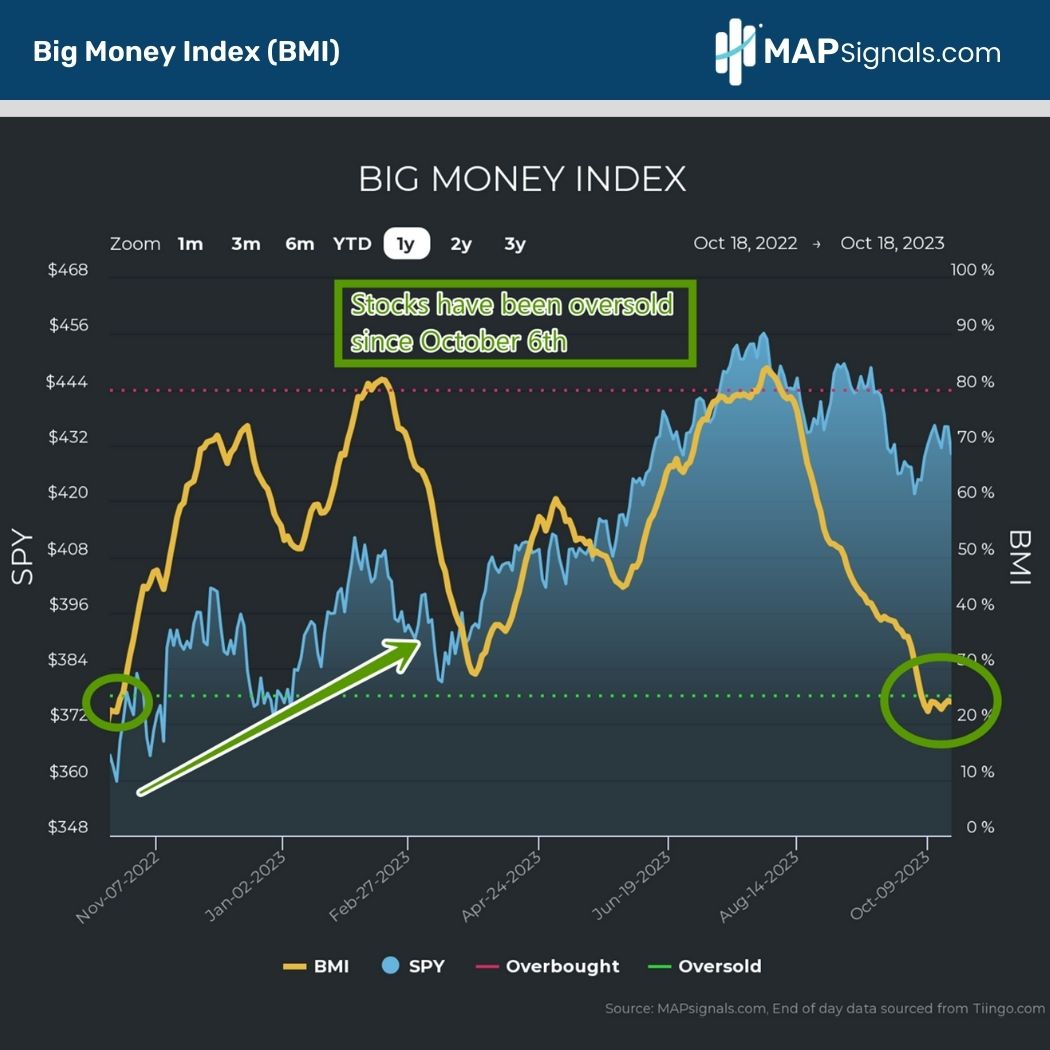
At MAPsignals, we’re all about following the money. When one spectrum attracts inflows, another must suffer. Equities bore the brunt of the capital flight.
One look at the Big Money Index (BMI) tells this story beautifully. It’s now been oversold since October 6th:
When investors sell stocks relentlessly, they fall hard. As widespread fear grips traders, they have trouble seeing any positives in the sea of red.
A great example of this happened exactly a year ago. If you recall, we were in the teeth of the bear market and Wall Street analysts were unanimous that a recession was a near certainty over the next year.
Those anointed prophecies fell flat.
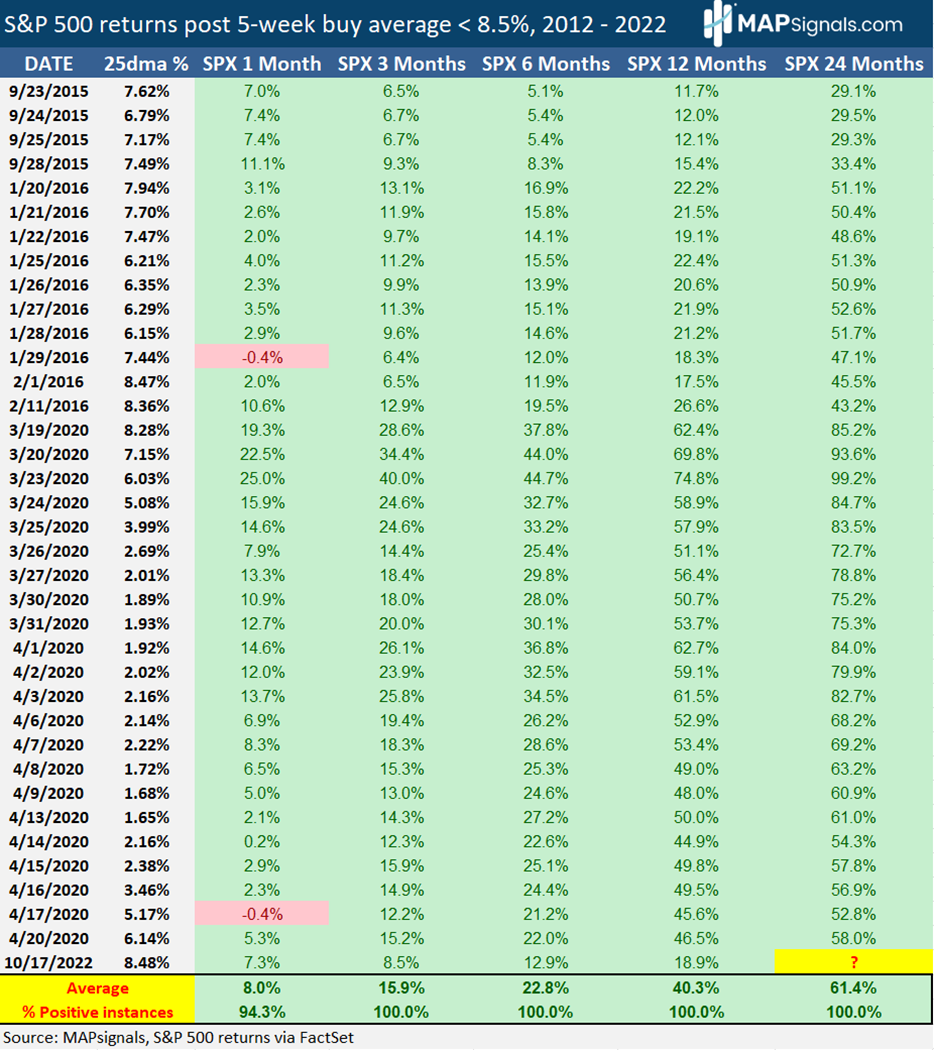
If we rewind the tape, our analysis then showed how stocks were extremely oversold, reaching breadth levels rarely recorded. We made the case that a rare bullish signal just triggered.
Back then we noted how a year after that level of selling, stocks were up 100% of the time since 2012. Guess what? The S&P 500 ramped a crowd-stunning 18.9% since October 17th, 2022, when the signal hit:
This proves the power that extreme positioning plays a vital role in forward performance. When everyone is rushing out of stocks at a breakneck pace, a bullish setup eventually develops.
Now you’re probably saying to yourself, “Ok great. That was then, what about now?”
Here’s when you can expect a bounce in stocks.
Stocks Surge Out of Oversold Conditions
When stocks get oversold, it’s a rare opportunity to accumulate outstanding companies at fire sale prices.
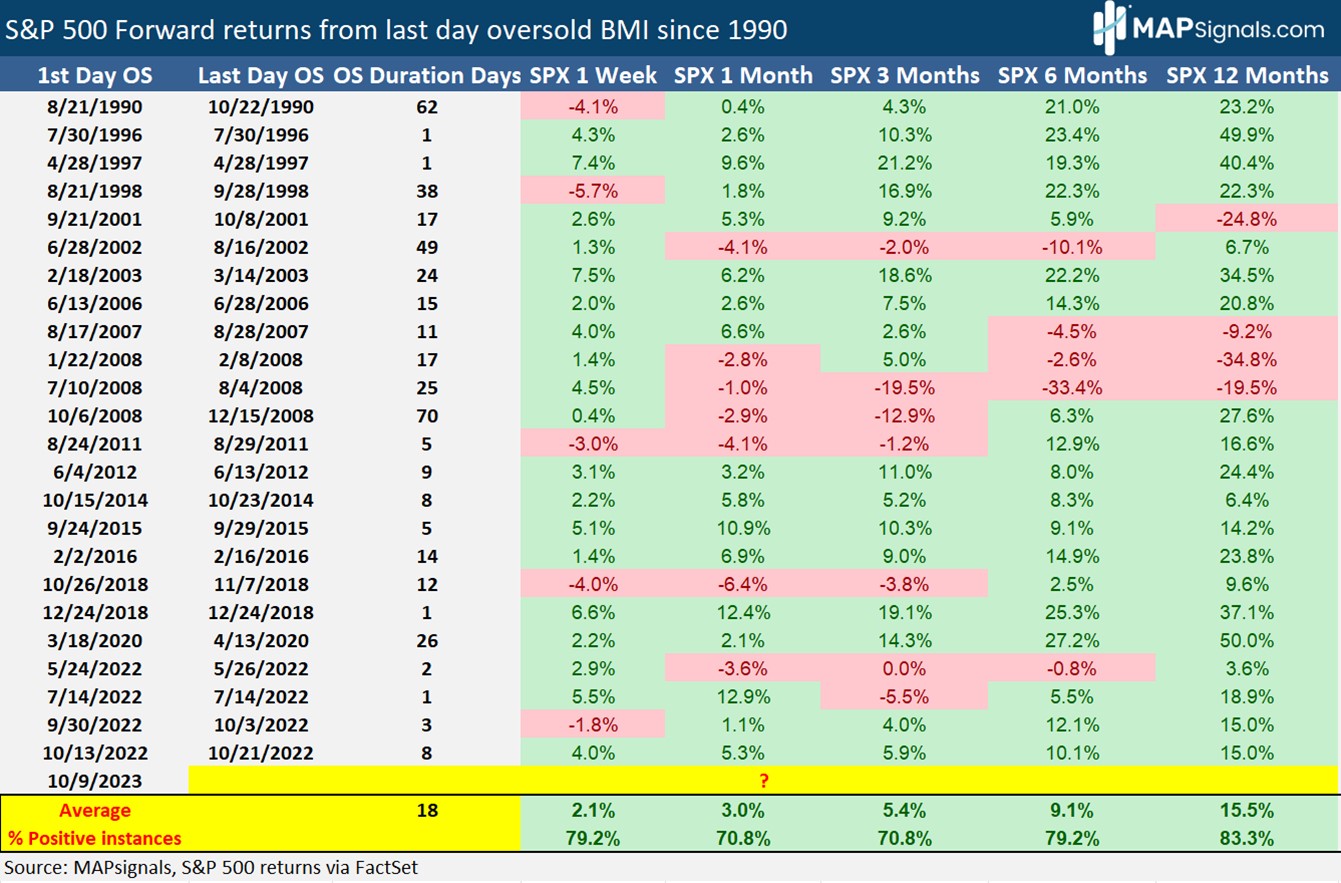
While we never know how long an oversold BMI will last, we do know that since 1990, the average duration is 18 calendar days.
Given that the latest oversold reading was October 6th, that puts October 24th as the historical average date when money will start flowing back into equities.
This begs the million-dollar question, “how do stocks fare once they break out of oversold conditions?”
If you think the answer is poorly, you’re sadly mistaken. Turns out, stocks surge out of oversold conditions.
A week after the BMI pierces above 25%, the S&P 500 rips 2.1%.
3 months later, stocks gallop 5.4%. 12 months later is the ticket with stocks advancing an average of 15.5%. Impressively, you’re looking at 83% of those instances being positive:
The time to get cautious was in late July.
The time to get proactive is in late October.
Let’s wrap up.
Here’s the bottom line: Yields are surging. Capital flight is real as investors chase treasuries and dump stocks.
Our Big Money Index remains oversold, reflecting the carnage hitting equities.
That’s the bad news.
The great news is once the BMI breaks higher, indicating a rush back into stocks, the S&P 500 rises like a phoenix from the ashes.
Since 1990, stocks rally 15.5% a year after the final oversold reading…leaving the bears in the rear-view mirror.
That’s exciting! Now’s the time to start building your buy list. Once the money wave heads north, I believe a crowd-stunning rally will ensue.
Don’t keep your bear suits zipped too tight. Stocks are going to surge again. You just need a MAP to see it!
We just listed our 5 favorite stocks to play for this coming bounce.
If you’re a professional money manager or are serious about investing, get going with a MAP subscription. Get access to real-time money flows including the stocks under institutional accumulation.
Finally, our latest white paper is out! We backtested our BMI, stocks and ETF data, asking a simple question, “Can money flows predict market prices?”
Check it out here and learn why MAPsignals is a tremendous resource for investors.