How We Nailed This Bull Run
We’ve been bullish all year. Sometimes it felt like a lonely row to hoe.
But, if look under the hood, demand for stocks has said “BE BULLISH.”
When playing poker and playing markets, you win by stacking the odds.

Below are the 3 most important charts that you won’t find anywhere else. Our data gives us an edge and paints a clear picture – the bulls are in charge.
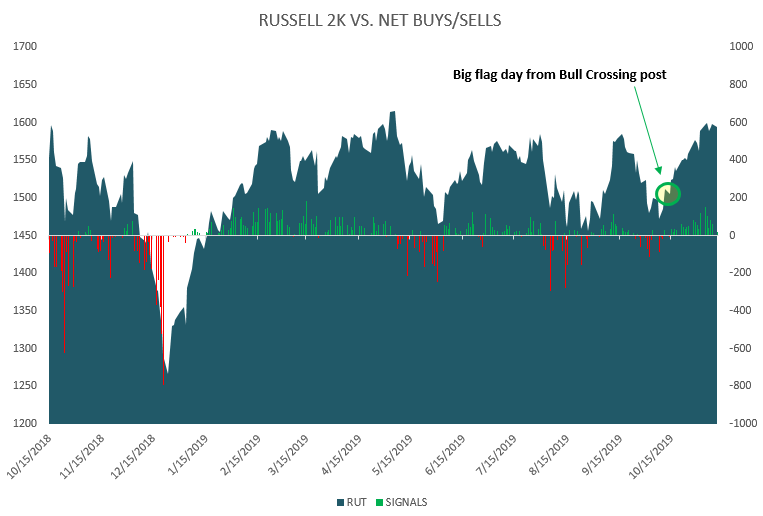
The first shows the net buys/sells overlaid on the Russell 2000. We’ve circled the date from our Bull Crossing post a month ago. Since 10/11/19 – SPY (S&P 500 ETF) is +4.07% and IWM (Russell 2000 ETF) is +5.7%.
Those green sticks are net buyers. This is a trend you don’t want to fight. Buyers are in control in a big way.
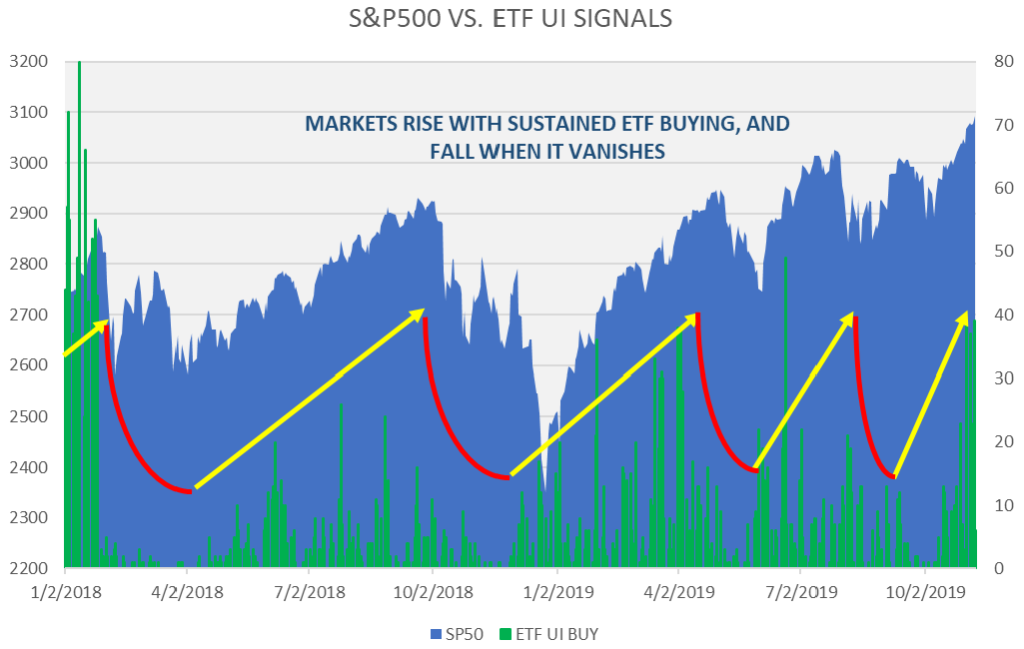
The next chart is looking at ETF buy signals in our data. Buying has been big – when it vanishes, markets soften. This is a trend you don’t want to fight. Buyers are in control.
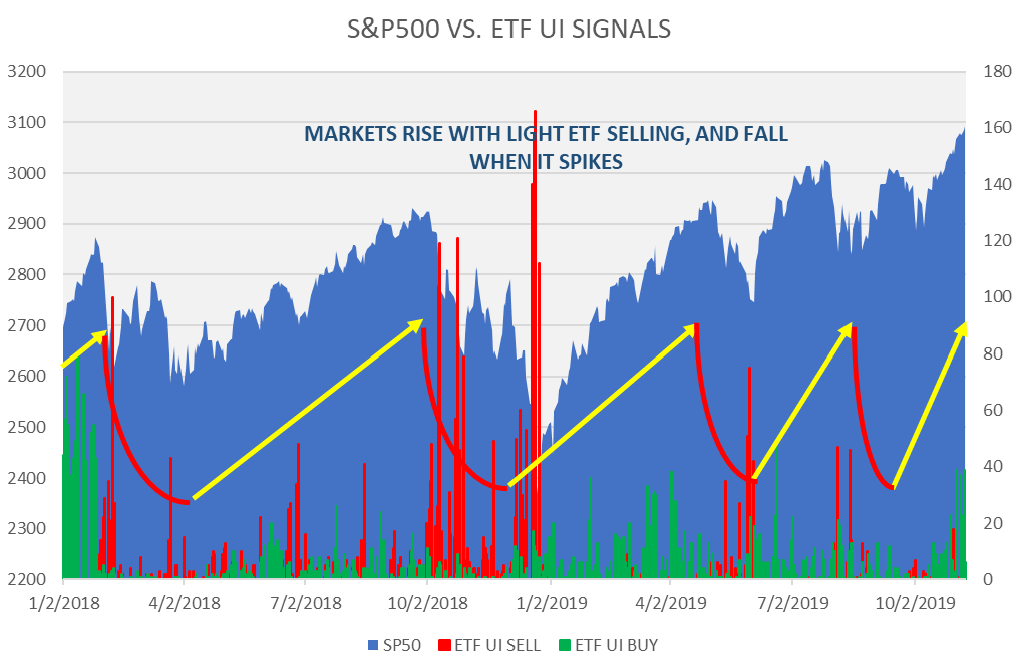
The final chart shows ETF buy and sell signals. ETF selling is small right now. When selling grows, markets fall. Again, buyers are in control.
Bottom line: stacking the odds with Mapsignals data gives investors a huge edge.