• Menu
  • Skip to right header navigation
  • Skip to main content
  • Skip to primary sidebar
  • Skip to footer

MAPsignals

We map big money.

  • Latest Insights
  • Power of MAP
    • MAP Products
    • MAP System
    • White Papers
    • Videos & Interviews
  • Profit with MAP
  • About
    • About MAP
    • MAP Team
    • Authors
    • MAP System
    • MAP Products
    • Big Money Index
  • Members
    • Get Started With MAP
    • My MAP
    • Big Money Charts
    • MAP View
    • MAP View Options
    • MAP Top 20 Weekly
    • MAP 50
    • Member Updates
    • Platinum Updates
    • Members Only Posts
    • Performance
  • Portal

Investing Bonus Level

May 21, 2020 //  by Lucas Downey//  Leave a Comment

I remember when I was kid, I played a lot of Nintendo video games.

Sometimes I thought I’d reached the end of the game. I figured the mighty boss level was next… only the fun kept going.

I found the secret bonus level!

It was a secret level designed to load up on supplies and strength before the next big battle.

The funny thing is- I think that’s where the stock market is now.

Why?

Indexes are very overbought and they are staying that way.

This is the investing bonus level!

While the market racks up a lot of points…investors can rack up a lot of gains.

Instead of cashing out and waiting for the pullback, you should enjoy the bonus level.

Keep playing.

When it ends, it may be time to face the boss, but you may be way better prepared…

investing bonus level

Welcome To The Bonus Level

Markets tend to overshoot when going up or down.

It’s like jumping into a pool. You don’t hit the water and stop immediately. Momentum keeps your body headed towards the bottom. Only once that energy dissipates can the air in your lungs float you to the top.

So, while obvious consensus is that stocks are heavily overbought, the thrust of momentum can keep us that way for a while.

It’s like the laws of motion: they exist even if we don’t want them to.

We should accept the movements of bodies and markets for what they are.

The problem comes because we are human. And humans are emotional.

Humans tend to get especially emotional with their wallets.

When it’s time to buy, many won’t out of fear.

And when it’s time to sell, many won’t out of greed.

We know that emotions can do real damage to logic. That’s why they have little, if any place in investing.

US stocks have been overbought for 2 weeks now. While it may not feel normal, it is. Markets historically have stayed overbought for a while. But take it for what it is: staying overbought is the investing bonus level.

30 Years Of Investing Bonus Levels

We went back deep into our data to see just how long overbought markets can last.

Since 1990, the Big Money Index was overbought 18.3% of the time.

This was spread across 67 instances.

The longest overbought period was 68 trading days which is more than 3 months!

The shortest was 1 day.

Here are the average returns for stocks once we reach overbought:

30 years of investing bonus levels

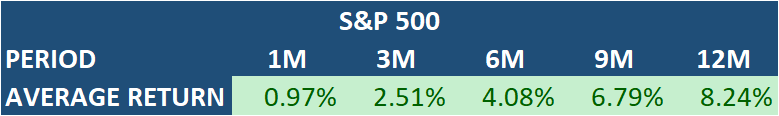
This data says that overbought markets don’t always mean lower prices.

Even if investors anticipate markets to pullback, these are really times when exuberance happens.

You don’t want to skip the investing bonus level. You can rack up a lot of points and value.

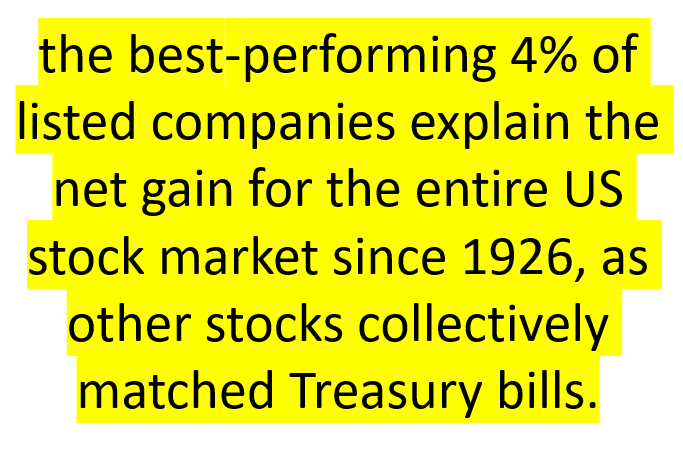
That’s because great stocks can fly to amazing heights. I don’t mean just any old stocks- I mean the outliers. The Michael Jordan, Wayne Gretzky and Tom Brady’s of stocks. History shows that 100% of the stock market’s gains above treasury bills come from only 4% of stocks.

This is from 1926 until 2018. Those are outliers.

Outlier stocks usually do especially well in overbought (bonus level) markets.

But nothing lasts forever; the bonus level always ends. There’s always a big bad boss to face.

The question is: “when?”

The Big Money Index Has Plateaued

We find all our answers in cold-hard data. The nuances are in when the data changes.

If you remember last week, we told you to always follow mama goose. That’s because we noticed that the Big Money Index had peaked: that’s a change.

But even though the BMI stopped rising, it can go sideways for a long time.

The key is to watch for when it starts to fall because it can do so just before a market cracks.

Here, let’s have a look at a zoom-in on the Big Money Index.

I’ve circled what is important.

the big money index has plateaued

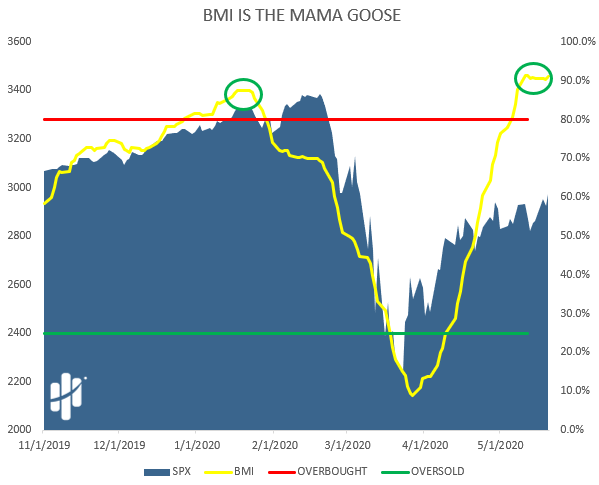
Notice how in January the BMI starts falling before markets fall.

The last time the BMI started falling after reaching a peak was January 30th.

Back then, markets were also extremely overbought.

That’s when we signaled ch-ch-ch-changes.

But if you recall, indexes kept rising for weeks while the BMI was falling.

That’s when we became cautious because the data shifted and diverged from the market.

As for what that means for now (the right side of the chart) we aren’t at a cautious point yet.

We’re still in the investing bonus level.

When the BMI starts falling from here – that’s when to prepare for a pullback.

Outlier Stocks Win The Game

Above, I mentioned outlier stocks and we’ve devoted our lives to finding them.

We succeed because we follow the big money. Big institutional money is constantly pouring into stocks with superior fundamentals. That’s where we fish for outliers.

If you want to make big money, follow the big money into the best stocks.

But don’t take my word for it, history has proven it.

Take Hendrik Bessembinder’s study, Do Global Stocks Outperform US Treasury Bills?

In this awesome huge paper, one key concept struck us speechless: 4% of stocks are responsible for all of the gains above treasury bills.

outlier stocks win the game

Taking it one step further, 1% of stocks account for 50% of the gains.

That means, if you want to be in the 1%, you gotta be in the 1%.

If you’re not in the 4% of stocks – you are making a costly mistake.

Finding them is the hard part, but luckily that’s all we do at Mapsignals.

Trading in and out of them is all well and good, but to make monster returns – you need to hold them.

Imagine if you had the chance to buy Apple or Netflix in the teens… but sold in the 30s pocketing a double. It may have felt good, but now it probably feels awful forgoing thousands of percentage gains in favor of a quick double.

Once you get some outliers in your portfolio, you’ll want to keep them. That way any year can seem like an investing bonus level. Maybe not every year, but the best stocks have one thing in common.

It’s a mantra we have here: TAGU. They all go up. They = outliers.

So, while you mentally prepare for the eventual pullback – make sure you enjoy the investing bonus level. But keep thinking long-term and focus on those outliers which can pay you big time in the investing bonus level.

Like right now…

For more information on how we find outlier stocks, and how you can get them – click right here.

Disclosure: I own shares of Netflix.

Lucas Downey
Lucas Downey

Lucas is co-founder of MAPsignals. His full bio can be found here.
Prior to MAP, he was Head of ETF Sales at Cantor Fitzgerald & SVP of Derivatives at Jefferies, LLC.

Spread the word!

Category: All, Big Money Insights Weekly, Special Reports

Previous Post: « Always Follow Mama Goose
Next Post: 6 Leaf Clover »

Reader Interactions

Leave a Reply Cancel reply

Your email address will not be published. Required fields are marked *

Primary Sidebar

Get Big Money Insights for FREE

Want to know where the Big Money is headed?

Just enter your email address below. You'll get our FREE NEWSLETTER sent directly to your inbox.

We call it Big Money Insights... It’s your weekly sneak peek at the powerful market-moving forces that are hidden from 99% of investors.

"*" indicates required fields

This field is for validation purposes and should be left unchanged.

Categories

  • All
  • Big Money Insights Weekly
  • Big Money Series
  • Macro Insights
  • MAP In The Media
  • Members Only
  • Performance
  • Podcast
  • Special Reports
  • Stocks
  • Videos & Interviews
  • White Papers

Archives

  • June 2022
  • May 2022
  • April 2022
  • March 2022
  • February 2022
  • January 2022
  • December 2021
  • November 2021
  • October 2021
  • September 2021
  • August 2021
  • July 2021
  • June 2021
  • May 2021
  • April 2021
  • March 2021
  • February 2021
  • January 2021
  • December 2020
  • November 2020
  • October 2020
  • September 2020
  • August 2020
  • July 2020
  • June 2020
  • May 2020
  • April 2020
  • March 2020
  • February 2020
  • January 2020
  • December 2019
  • November 2019
  • October 2019
  • September 2019
  • August 2019
  • July 2019
  • June 2019
  • May 2019
  • April 2019
  • March 2019
  • February 2019
  • January 2019
  • December 2018
  • November 2018
  • October 2018
  • September 2018
  • August 2018

Follow us on Twitter

MAPsignals Follow 619 842

MAPsignals is a data platform that tracks institutional money flows in and out of the market.

mapsignals
mapsignals avatar; MAPsignals @mapsignals ·
30 Jun 1542518642461384709

The first half of 2022 is in the books.

The #bearmarket has sent #stocks tumbling.

Today, @LukeDowney reviews how sectors performed YTD and highlights two #sectors primed for upside. $XLY $XLK

Read here: https://mapsignals.com/map-blog/two-sectors-are-primed-for-upside/

Image for the Tweet beginning: The first half of 2022 Twitter feed image.
Reply on Twitter 1542518642461384709 Retweet on Twitter 1542518642461384709 0 Like on Twitter 1542518642461384709 1 Twitter 1542518642461384709
Load More...

Subscribe To Our YouTube Channel

MAPsignals

MAPsignals
#Capitulation #BearMarket2022 #StockMarketSelloff
Stock market capitulation is here. In this video, Luke dives into what capitulation is and what it means for stocks. Check out our latest blog post: https://mapsignals.com/map-blog/

What does capitulation mean for markets? It is when there's no leadership and investors throw in the towel. You've heard the saying, "sell first, ask question later?" That's how Wall Street thinks.

But these rare moments often lead to bargains for stocks. Capitulation can often lead to bottoms being formed in stocks.

As Lucas Downey shows, these moments are usually when investors should focus on quality companies in this bear market environment. Long-term is the best mindset in a bear market.

The best stock market analysis we've found is following the Big Money. MAPsignals doesn't argue with data.

Learn more at www.MAPsignals.com
Remember this is not personal investment advice of any kind. This video is for entertainment purposes only. Our focus is to help investors make sense of markets with data.

Our disclaimer can be found here: https://mapsignals.com/contact/

Music by Karl Casey @ White Bat Audio
Stock Market Capitulation is Here | Bear Market 2022
YouTube Video UC4nueJix0bSLmZyilUuCVrQ_xzXHj_aJvss
Load More... Subscribe

Footer

© 2021 Mapsignals.com

  • Home
  • Contact & Disclaimer
  • Privacy Policy
  • Terms & Conditions
  • Cookie Policy (US)
  • FAQ

Copyright © 2022 · Mai Law Pro on Genesis Framework · WordPress · Log in

✕
What Happened to Risk Assets White Paper is Here

Get your copy here and take a journey through our thoughts on margin and leverage.

Enter your email address below and you'll get our FREE NEWSLETTER sent directly to your inbox. 

 We call it Big Money Insights... It’s your weekly sneak peek at the powerful market-moving forces that are hidden from 99% of investors.

Manage Cookie Consent
We use cookies to optimize our website and our service.
Functional Always active
The technical storage or access is strictly necessary for the legitimate purpose of enabling the use of a specific service explicitly requested by the subscriber or user, or for the sole purpose of carrying out the transmission of a communication over an electronic communications network.
Preferences
The technical storage or access is necessary for the legitimate purpose of storing preferences that are not requested by the subscriber or user.
Statistics
The technical storage or access that is used exclusively for statistical purposes. The technical storage or access that is used exclusively for anonymous statistical purposes. Without a subpoena, voluntary compliance on the part of your Internet Service Provider, or additional records from a third party, information stored or retrieved for this purpose alone cannot usually be used to identify you.
Marketing
The technical storage or access is required to create user profiles to send advertising, or to track the user on a website or across several websites for similar marketing purposes.
Manage options Manage services Manage vendors Read more about these purposes
View preferences
{title} {title} {title}