
It’s Hard To Beat Outlier Stocks
My message today is simple: over the long-term, it’s hard to beat outlier stocks.
Those are the ones that keep cranking higher year after year.

For MAPsignals, finding them is the holy grail of investing… that’s our main goal. And boy do we find them! More on that in a bit…
In the short-term however, stocks can swing all over the place.
As most of you know, markets routinely go through tough periods like recessions, growth scares, pandemics, rotations, summer slowdowns…you name it. They’re scary and oftentimes require antacids (me included!).
We’re going through one right now as many stocks aren’t participating in this rally. So, what’s an investor to do?
History says keep a long-term mindset because it’s hard to beat outlier stocks. I’ll show you some MAPsignals stats that points to this being true.
But first, let’s first check in on our data.
Big Money Index Hits Quiet Summer Patch
It’s quiet out there. Major indexes are at all-time highs. But, many stocks aren’t keeping up.
Let’s put on our stock market infrared goggles and see what’s really going on under the surface.
The Big Money Index tracks buying and selling in stocks. When the index ramps, breadth is wide as many stocks are getting bought. When it falls, like now, it means breadth is low:
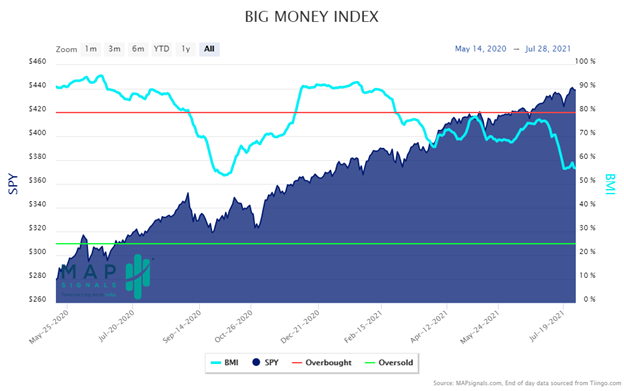
At first glance, it appears to be in a clear downtrend. But, notice how the BMI has recently been range-bound for over a week. To us that’s constructive because we want to follow the trend of the Big Money. If the decline is slowing…that’s a good sign.
And also keep in mind that we’re in the thick of summer. Seasoned traders know to expect lower liquidity in July and August. We’ve been harping to get ready for summer volatility for many weeks now.
But let’s keep going on the near-term picture because there’s another bullish sign to point out.
Looking at the daily buys and sells of stocks tells a better story of what’s going on. Two Mondays ago (July 19th) we saw the biggest day of stock selling since the pandemic lows.
I’ve circled it in green:
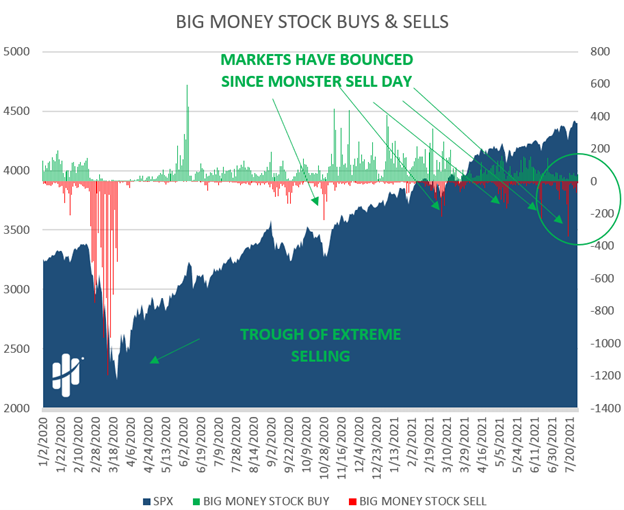
I’ve also put arrows on prior big sell days. Notice how those big red bars tend to line up with lows in the market?
And you can see the same pattern in ETFs. Since they are baskets of stocks, it makes sense that they’d also see monster selling alongside equities:
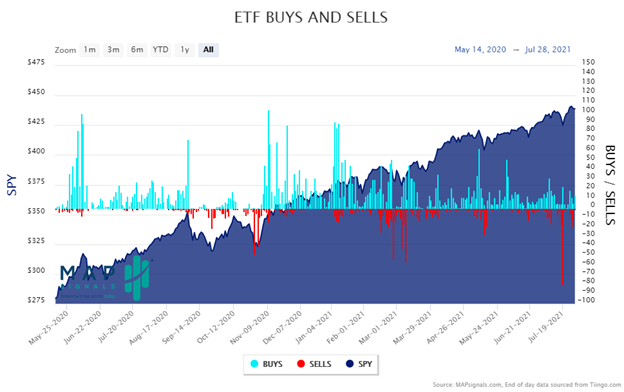
That big red bar off to the right is that Monday.
As we pointed out last week, typically when we see monster selling in stocks and ETFs, it means to prepare for a near-term ripper.
Here’s the 1-week performance of the S&P 500 (SPY) after those big sell days:
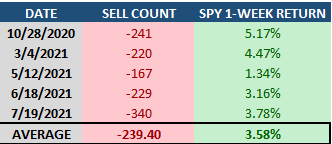
Stock dumps mean market bumps. That’s JUICE! And to us it’s another feather in the bull’s cap. So, there you have our near-term picture. Now, let’s transition to the bigger narrative…one that needs repeating often.
No matter what the market does in the short-term, over the long-term it’s hard to beat outlier stocks.
It’s Hard To Beat Outlier Stocks
MAPsignals has been in business for 7 years. And we are proud of that! We opened our doors with one simple mission: Find amazing stocks.
And we do that by sifting through mounds of data every day. Inside of all these cool charts of the BMI, stocks, ETFs, etc.… are individual stocks. And each week we highlight 1 for our subscribers in our MAP View report.
These are stocks that have 3 traits: Strong fundamentals, great technicals, and Big Money buying. I ran some numbers this morning to see how those picks have done over the years…
If you’re allergic to juice, look away now!
So, how have our weekly stock picks performed? Well, here’s how the study went. Imagine you bought each stock each week and held until yesterday’s close. How’d that do?
I researched all stocks starting from 2018 through June of 2021. I was curious how these stocks performed vs. the S&P 500.
Keep 2 things in mind.
First, the performance is calculated as if you bought the stock on the day it was profiled and hypothetically held until yesterday’s close. So, many of these stocks would be held for years. Who even does that?!
Second, there are some stocks that don’t exist anymore due to corporate actions. In those few instances, we calculated the returns up until it ceased trading…and the same goes for SPX. All efforts were made to be as accurate as possible.
Have a look:
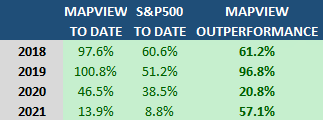
***Hypothetical performance sourced from FactSet
That’s mega juice! In other words, it’s hard to beat outlier stocks! And included in these periods was a pandemic, China fears, recession fears, election chaos…you name it (lots of near-term choppiness to deal with).
Obviously not all stocks were winners and we can’t guarantee our process will find outperformers in the future. But, we’ll keep doing our unique process to hunt the best stocks down. It only take a few outliers to transform a portfolio.
Ok, let’s wrap this all up.
Here’s the bottom line: Yes, the market is hitting a rough patch near-term. Summers tend to get bumpy. But, there are signs that the worst could be behind us since the BMI is firming and peak selling looks to have been 2 weeks ago.
That’s just the short-term picture though, which surely will change. The long-term picture is what’s important: Outlier stocks are hard to beat.
Look we’re trying to have fun by finding incredible stocks. And we have a track record that has found many of them. For us, it’s all about the long game.
If you’re curious to find out more, check out our subscriptions here.
***Lastly, check out our latest video series: Best Dividend Stocks for August 2021.
Luke clues you into how we go about finding the best outlier stocks. Leave us a comment!