
Losing Steam
Everything loses steam once in a while. We all lose momentum. How many times have you said: I need a break!
That’s what vacations are for…
Well, for weeks now, MAPsignals data has been signaling a rotation. Reopen stocks have been a magnet for capital.
Signs point to that theme stalling and losing steam.
Let’s roll back the tape for a moment:
A month ago, we pointed to a silent undertow pulling on markets. Volumes were immense as the rotation began. Small-cap and reopen stocks screamed higher, while growth names took a backseat.
Now every rotation is unique and plays out differently. But this one happened to be on the hopes of a reopening economy after a pandemic shutdown. Previously unloved sectors began gaining momentum and moving higher.
Groups like Financials, Retail, REITs, Energy, & Industrials vaulted week after week. Bids just kept pushing them higher and higher. Work-from-home (WFH) stocks began to lose their luster as hopeful investors saw visions of the world we once knew, roaring back in the near future.
But here’s the deal, rotations happen all the time. Money moves like water from one side of the tub to the other. And they don’t always point to overall market weakness.
But there is a shift that’s losing steam. Buying is slowing.
And that’s causing a tipping point to occur. Based on what we see in our data, signs point to lower prices near-term.
Stock Rally Is Losing Steam
As you’ll see, there has been notable deterioration in our data. For weeks, an increase in selling has been putting pressure on the Big Money Index.
There were still some sectors ramping higher while others faltered. This kept the BMI from falling too fast. But that is suddenly changing because buying is drying up.
When selling ramps and buying falls, we see it clearly in our data. Our BMI is losing steam:
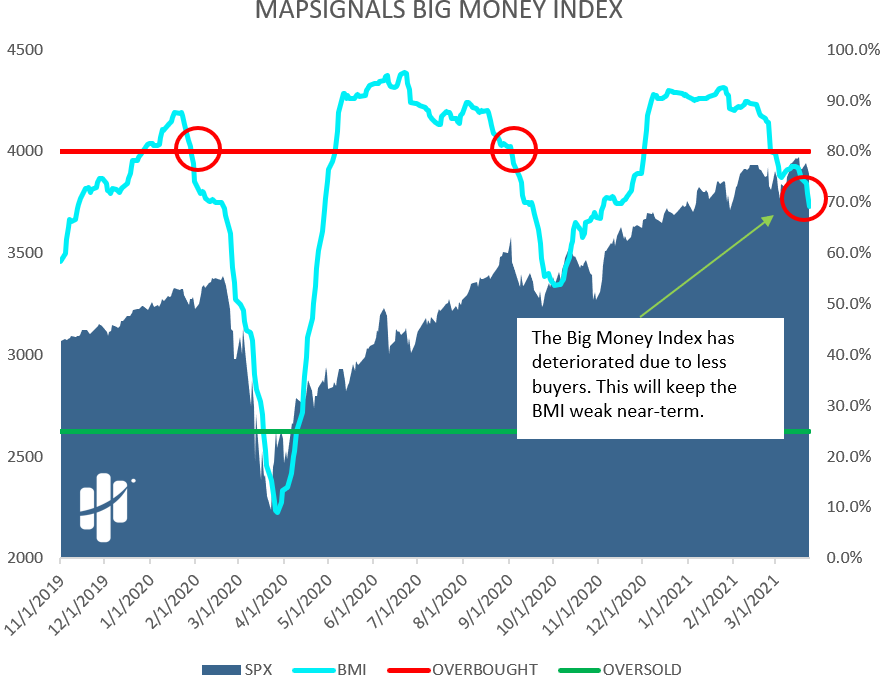
But don’t worry too much. Rest assured, stocks will resume their uptrend. But before they do we need to see either increased buying OR a nasty flush-out occur. We believe the latter is the more likely scenario.
Markets may have to retest lows made a few weeks ago, so it could get bumpy.
Now, let’s look at what stands out most in our data. Below is our Big Money Stock Buys & Sells chart. It shows the daily totals of buys and sells in our data.
Green bars are buys and red sticks are sells.
Stock buying has vanished. Or how I interpret it –buying is losing steam:
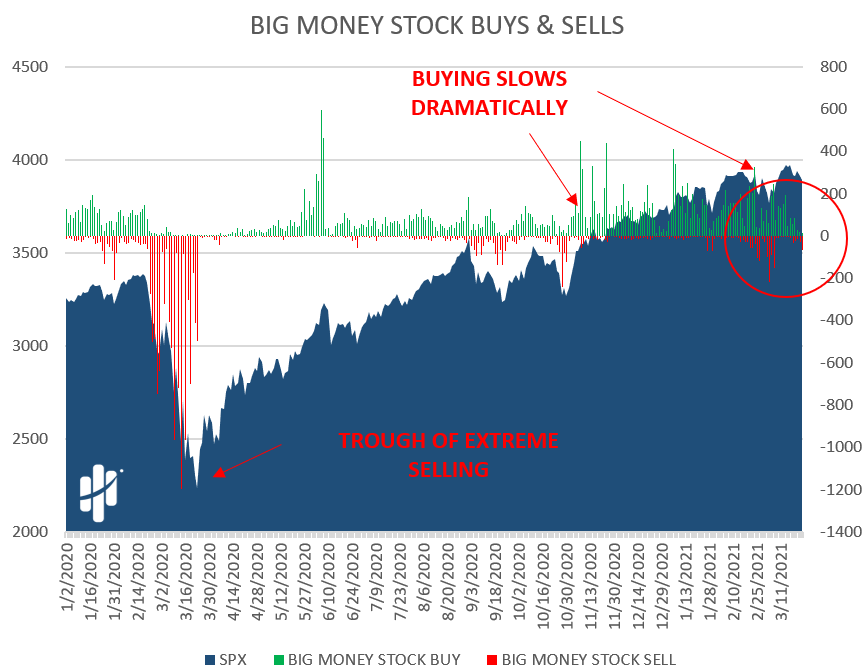
Now, on the surface it doesn’t show significant selling. But, with a falling BMI and days of nearly zero buys, it tells me all I need to know… selling will likely pickup before stocks can start a true rebound. Why do we think that?
Have a look at this.
Overall Stock Volumes Are Low
Not only does the lack of buying have me on alert, but overall stock volumes are low. That’s important because pullbacks tend to end on big volume washouts.
Tuesday and Wednesday’s data showed very low volumes even with the pullbacks. To us that clearly says that fear isn’t high. Experience tells me that can change quickly as strength loses steam, giving way to weakness.
Below is our Daily Big Money Volumes chart. It plots the daily number of stocks and ETFs trading with outsized volumes.
To my surprise, volumes were incredibly light the last 2 days:
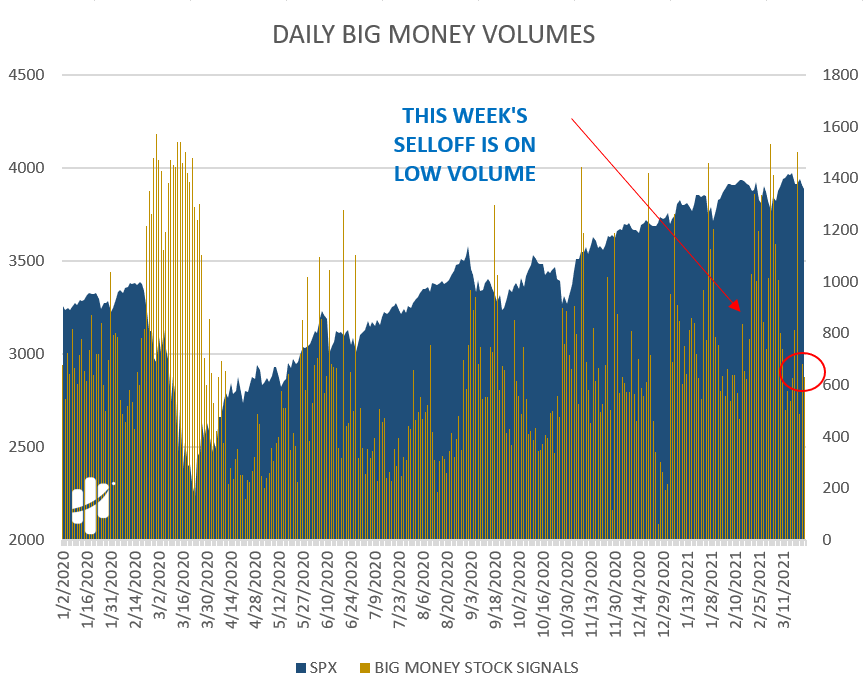
This is important because if data is shifting to near-term risk-off, bottoms tend to form with big-volume days. Basically, lows are made when fear is high: everyone sells because they feel there’s no reason to own stocks.
But there’s a silver-lining: those points are great times to go fishing for stocks.
Let’s dive into one last data point that signals the rally is losing steam and the selloff is gaining speed.
Technology And Healthcare Sector Selling Is Increasing
There’s always a group or two that paves the way for a selloff. Technology and Healthcare are the weakest links in the chain right now.
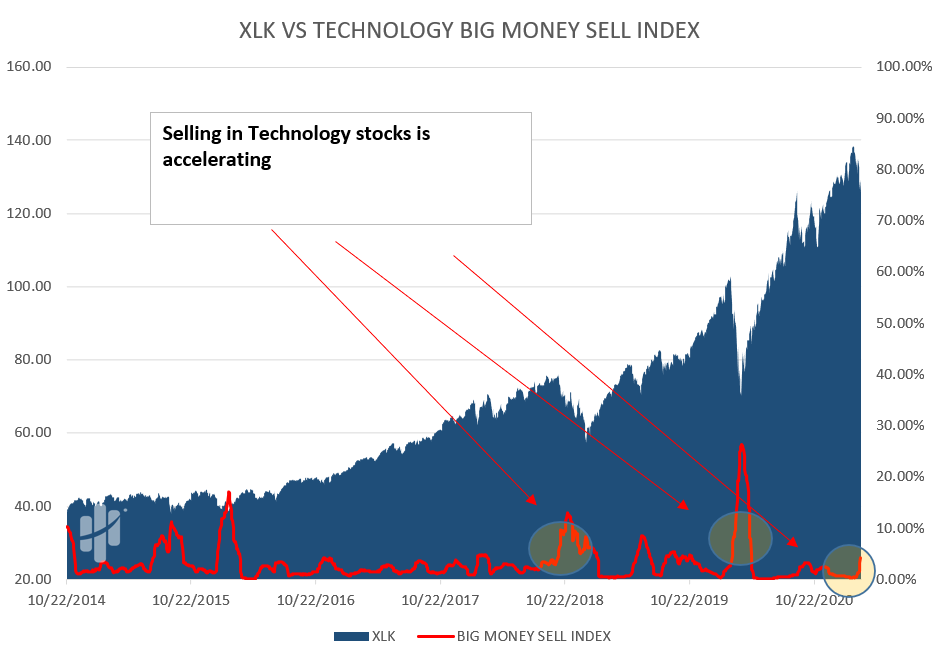
A great way to see that is by measuring the momentum of sector selling. Below are our Big Money Sector Sell Indexes for both Technology & Healthcare.
If the red line is rising, the momentum of selling is ramping. Off to the right I’ve circled what’s important: Selling is accelerating:
Here’s Tech:
And here’s Healthcare:
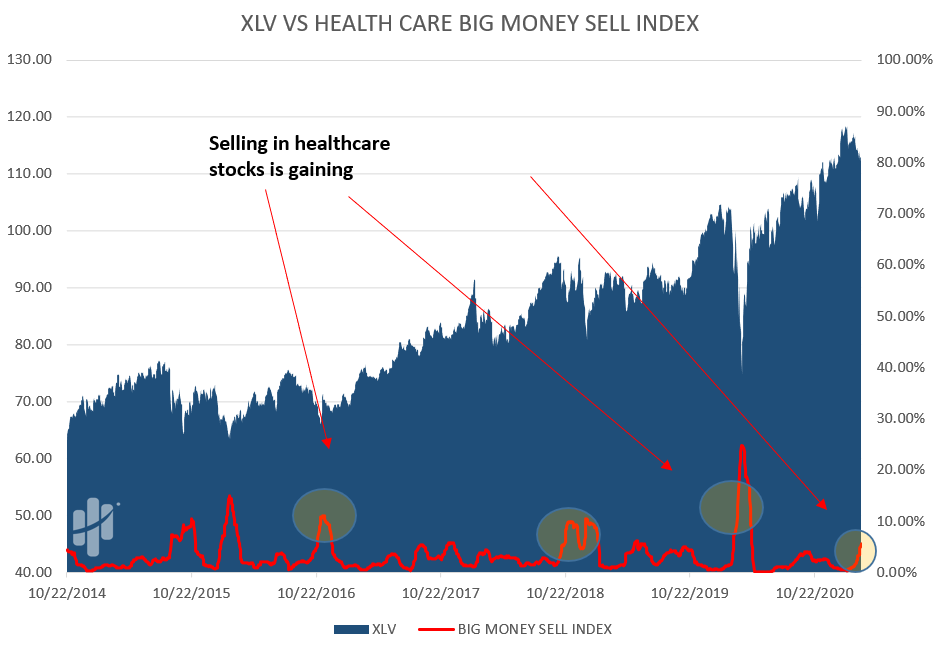
I’ve also circled prior periods when selling was big. Near-term lows tend to follow soon after.
So, let’s put this all together.
Here’s the bottom line: Our data says that stocks are likely headed lower near-term. The BMI is clearly falling, buying in stocks has vanished, and the latest pullbacks have been on low volume.
That screams to us that peak fear is not yet here… but it’s likely coming.
And while that may sound unsettling to most, an opportune time for patient investors may be right around the corner.
Like all selloffs we’ve dealt with, it will get overdone. People will rush for the exits to stop the pain. They invariably throw the baby out with the bathwater. That’s exactly the time to pick your spots. One man’s junk is another man’s treasure…
So, start making a buy list now. MAPsignals subscribers may want to peruse the MAP 50 lists and familiarize themselves with our most common names. Fire sale discounts on some of these stocks can feel great when they bounce high and far after the selling is done.
Opportunity tends to show up when emotions are high and it feels the least comfortable.
Hang in there, folks – this too shall pass, but this time try not to let it pass without turning it into an opportunity. Losing steam means a pause. But pauses refresh and re-energize.
The coming year should be far better economically and stocks are still the best game in town. We try to win by tilting the odds in our favor. Focusing on outlier stocks. But they too- go on sale.
A flash-sale may be coming soon to a market near you…