Lucid Dream Market
Did you know that when you dream, part of your brain shuts down?
It’s true. Often, things don’t make sense.
But for some, dreams can be controlled… lucid dreamers.
Last week felt like a dream.
Shares of HD were in the 140s…UNH below 200…V in the 130s!
It’s easy to tune out when things get crazy – it’s easy to give up.
Don’t. Stay lucid because dreams don’t last forever.

Markets Are Deeply Oversold
We went oversold on Thursday morning, March 19th. Since then, markets have rocketed:
IWM +13.89%
SPY +7.83%
QQQ +7.02%
Here’s where the Mapsignals Big Money Index stands. The index should hit lows this week. When it begins to lift…look out above!
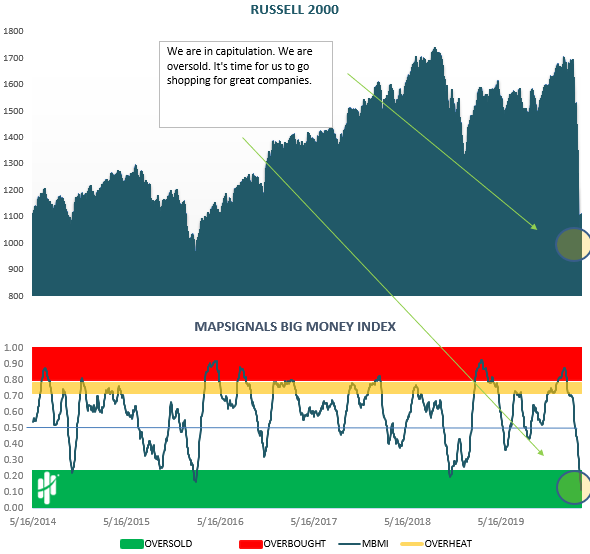
Was March 23rd the low?
It could be. On March 4th, we wrote Get In There – our data suggested that a market low would be on March 20th.
That’s not too bad. Since being oversold, selling appears to be slowing. These are good signs, folks.
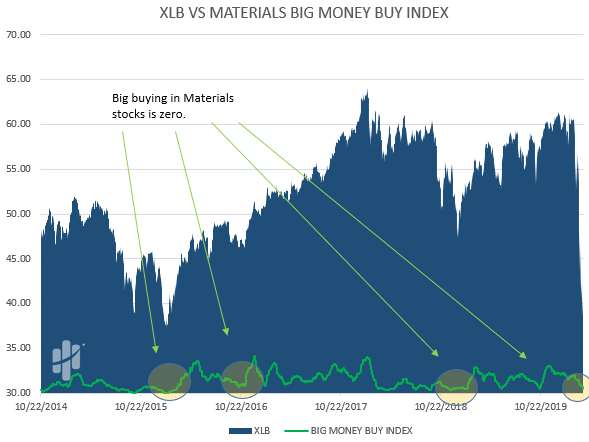
Sector Buying Is Zero
Last week we looked at extreme selling in sectors. It was off the charts.
This week let’s look at buying in sectors and what we can glean from the data.
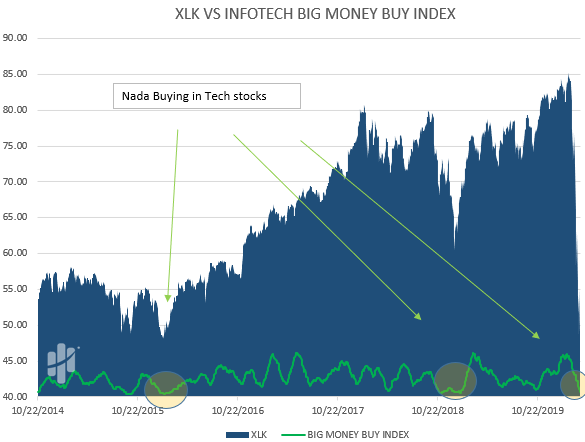
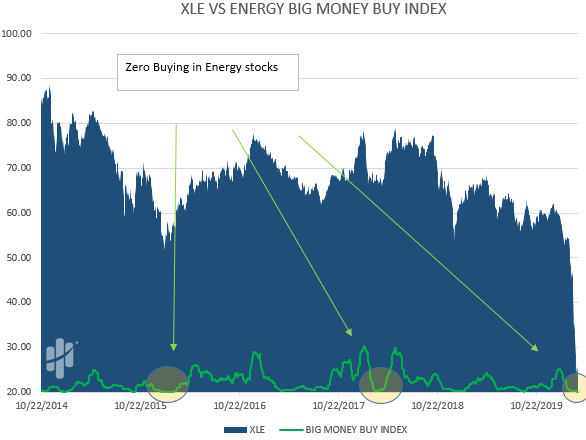
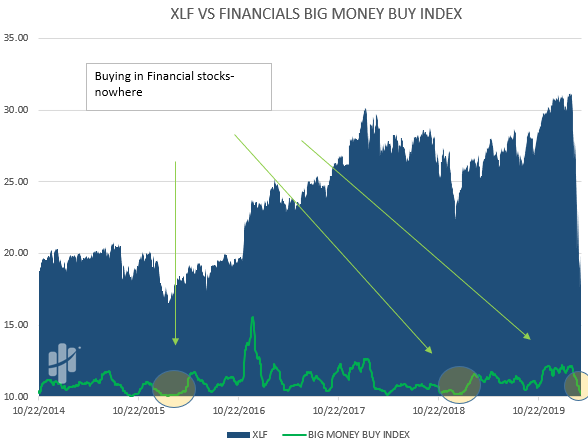
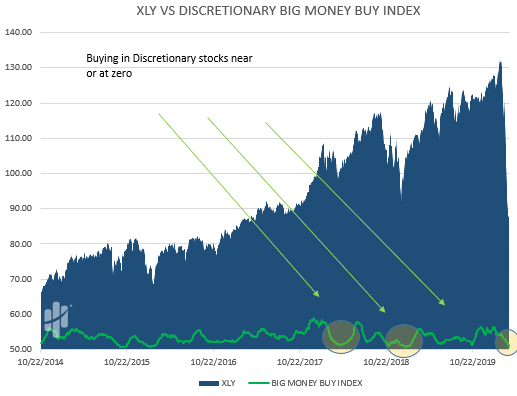
If the sector index is going up it means more buying. If the index is near zero, it means there are no buyers.
Look how zero buys usually marks the lows for sectors:
Materials:
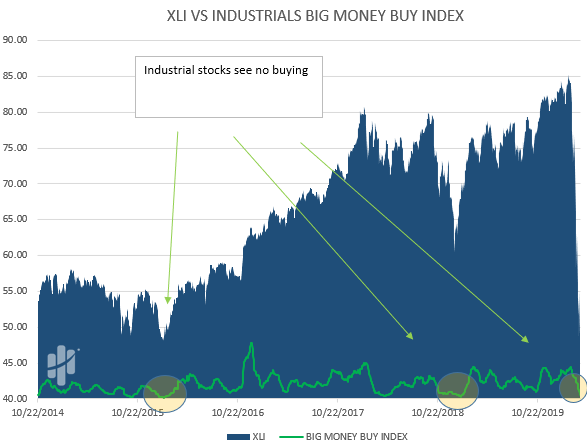
Industrials:
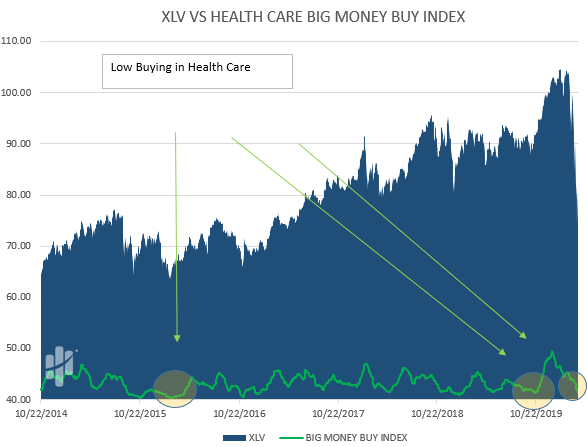
Here’s Health Care:
Tech:
Energy:
Financials:
And lastly, discretionary:
Oversold In Bear Markets
When we go oversold, it means selling is unsustainable and a bounce should follow. But when?
Looking back through 1990. Excluding last week, there were 18 oversold periods. The following table sums up what happened:
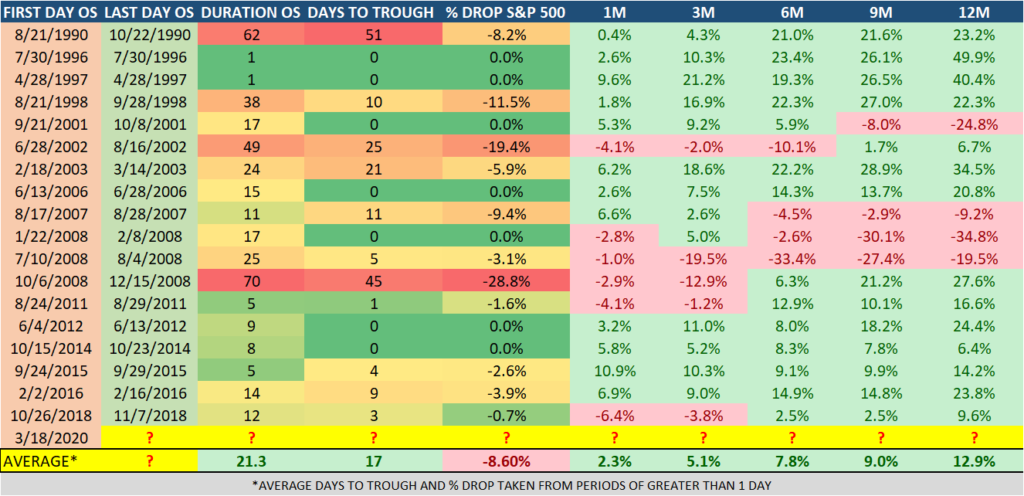
The table above includes the bear markets since 1990. This includes the internet bubble pop, tech-wreck, 9/11 which led to many high-profile bankruptcies, the Global Financial Crisis, and several other turbulent patches.
We have already eclipsed the largest prior trough on record: -28.8% October -December of 2008 taking 45 days to get there. That was a dark time.
So, where’s the good? Forward returns of the S&P 500 1, 3, 6, 9, and 12-months were positive on average.
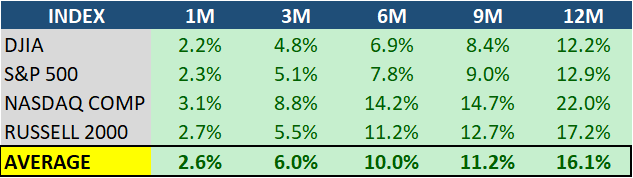
Here I summarize all 4 major indices’ forward returns:
Bottom line: last week felt like a dream – a good dream.
We sent the marines – and they got things under control.
Our data indicates things are getting better since Friday. Selling is slowing.
Next time you have a market dream that doesn’t make sense – get lucid. Dreams don’t last forever.
(Disclosure: Mapsignals is long HD, UNH, & V.)