
Macro: Disregard the Rate Scare and Buy Stocks Now
It’s getting ugly out there. Equity selling pressure is intensifying.
We are reaching the point to disregard the rate scare and buy stocks now.
In late July, we initiated our pullback narrative when our Big Money Index (BMI) peaked out at a scorching 83.9. Stocks never do well in the short-term when the BMI gets that hot.
Fast forward two months and the S&P 500 is down 8% from its summer peak. Relative strength in tech and energy, our top-ranked sectors, has helped limit market downside.
Our two least favored sectors, utilities and real estate, have corrected more than twice as much as the S&P.
It’s been a tough stretch. The good news is stocks are fast approaching deeply oversold levels.
A major tactical buying opportunity looms.
Today, we’ll recap what’s driving this sell-off. Then we’ll use the Big Money Index (BMI) to show you when to buy stocks and which sectors to lean into.
Tightening Financial Conditions Spark Panic Selling
You don’t need me to tell you Wall Street’s worry list is a mile long right now. Whether it’s surging interest rates, sticky inflation and oil prices, a strong dollar, lofty valuations or widening credit spreads, there’s no shortage of bearishness spooking investors these days.
All these macro boogeymen have one thing in common – they tighten financial conditions.
Here’s why that matters. Pros are increasingly worried tighter financial conditions will spark a nasty, profit killing recession. As the cost of capital has surged recently, the big money has rushed for the exits, kicking the sell-off into high gear.
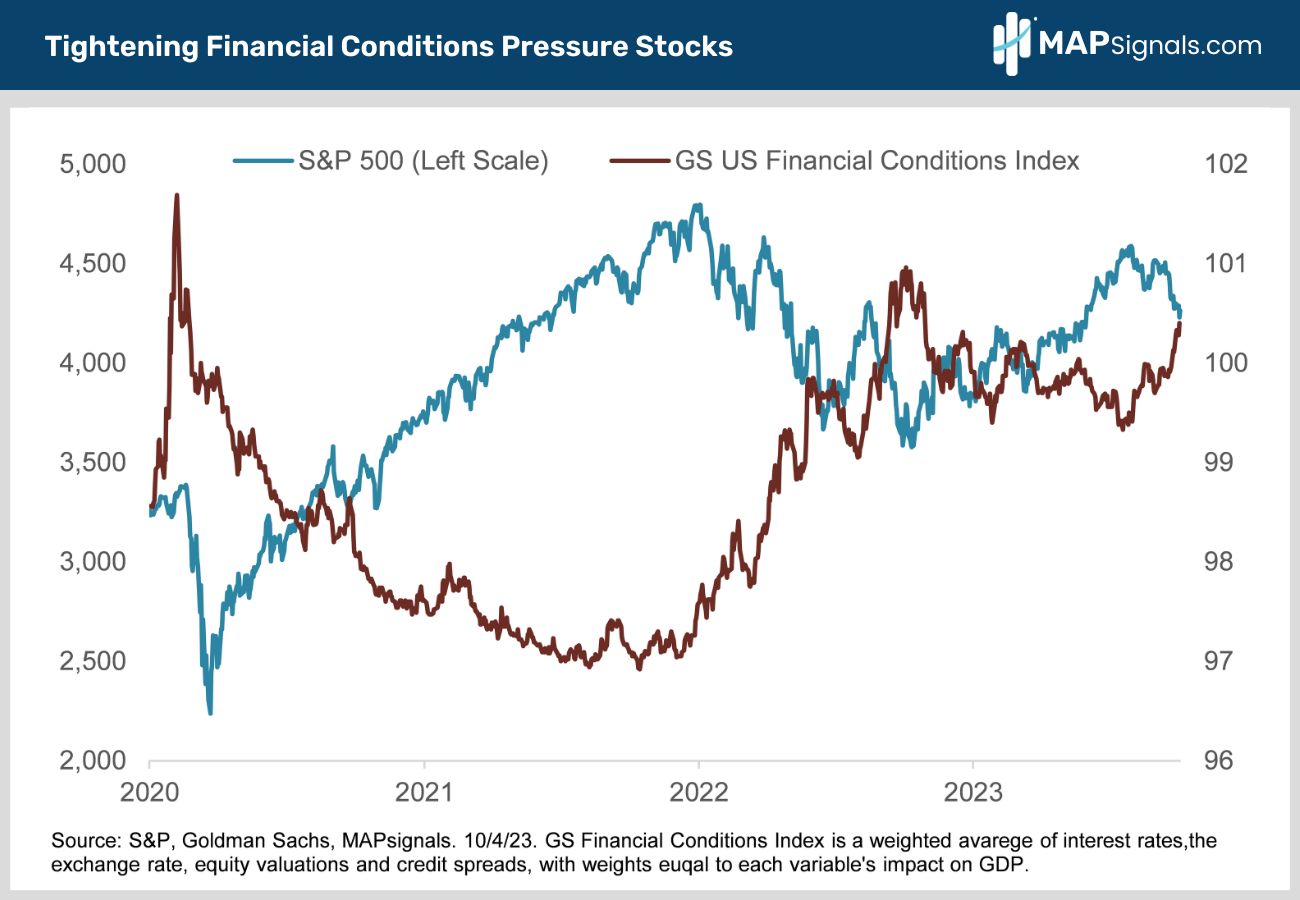
Check out this chart. The Goldman Sachs US Financial Conditions Index rolls up all these spooky macro inputs into a single indicator. Notice how the S&P 500 started falling more sharply as Goldman’s index began spiking in mid-September:
OK. Now you’re probably wondering how all this can help you make money. Read on.
Disregard the Rate Scare and Buy Stocks Now
Stocks and bonds have both been hammered. Institutional investors are starting to panic. The fear in the market is palpable.
Times like this may not be much fun, but if you follow MAPsignals, you know volatility creates opportunity!
I could have picked any of 10 widely followed sentiment indicators to show how bearish investors are. They all tell the same story. Investor sentiment sucks. People are scared.
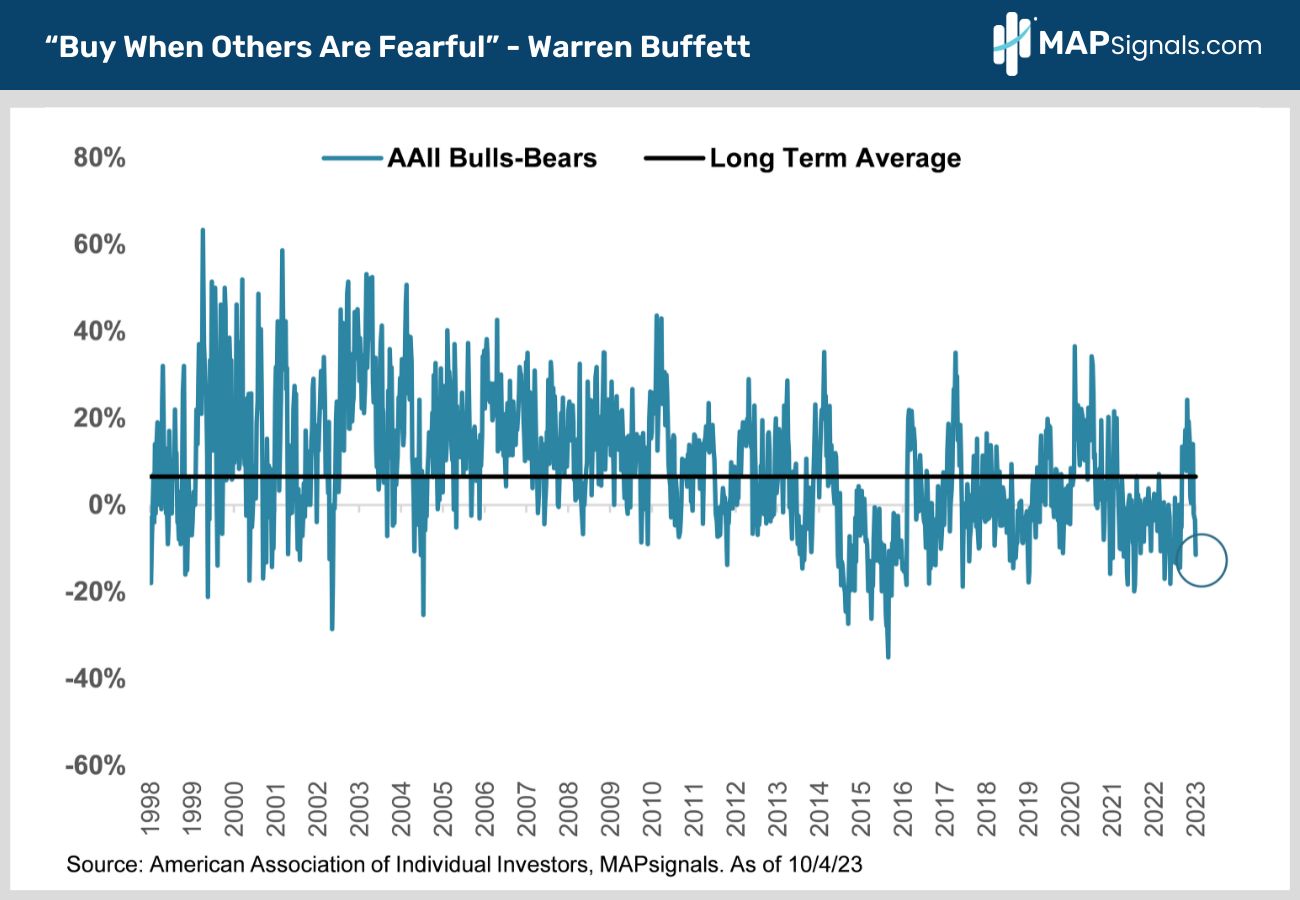
Check out the widely watched American Association of Individual Investors (AAII) weekly sentiment poll. The pros watch the bulls minus bears spread.
Most of the time bulls outnumber bears by a wide margin. Negative readings mean there are more bears than bulls. The latest reading is -11.5%, way below the +6.5% 40-year average:
Remember, it’s always darkest before dawn.
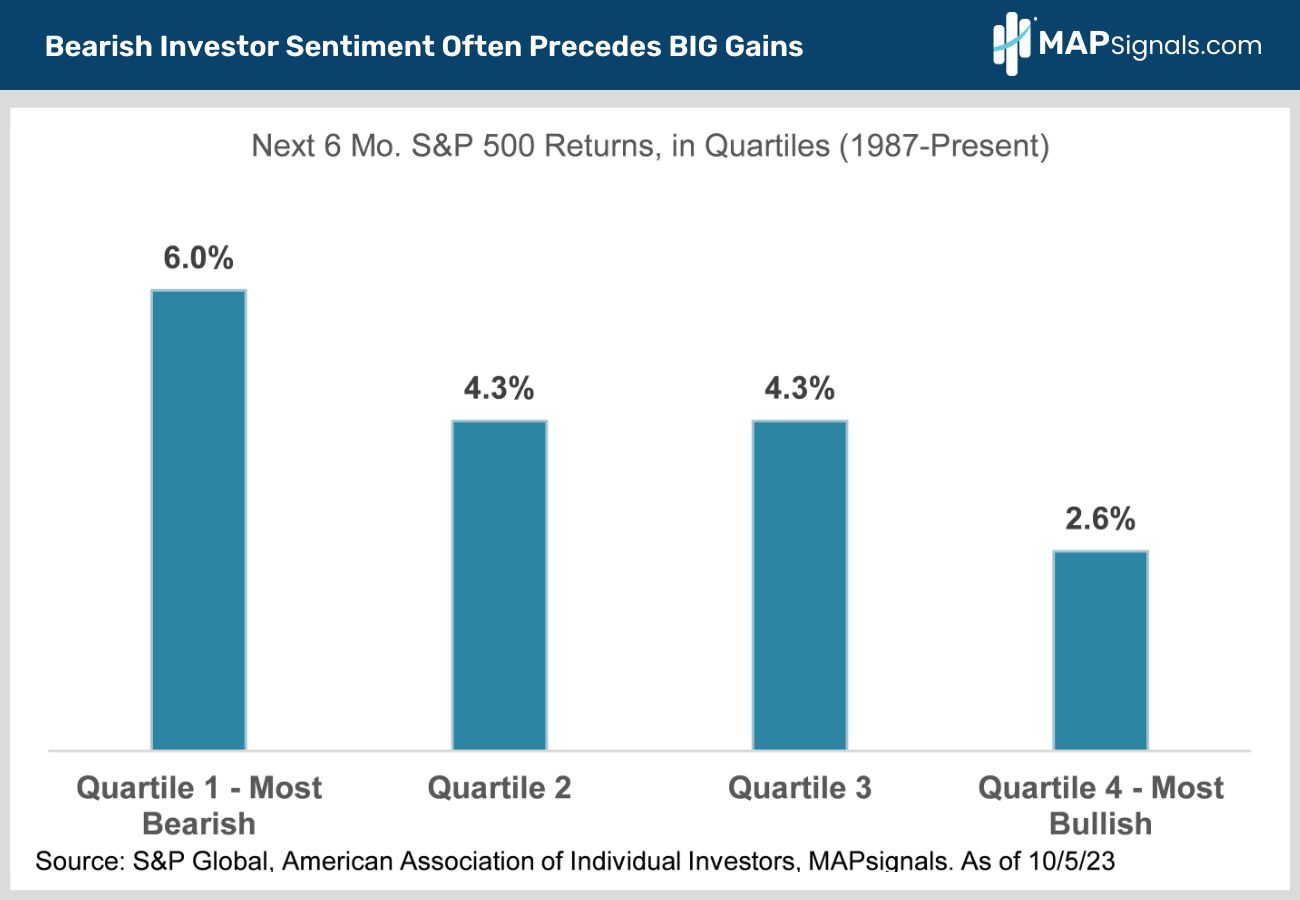
Check out this next chart. It pays to buy when you see extreme bearishness all around you.
Historically, the S&P 500 has posted above-average 6% returns in the six-month periods following bottom quartile bullish sentiment readings like October 5th’s 30% reading:
OK let’s dig deeper to see if we’re getting the same bullish message from MAPsignals’ Big Money Index.
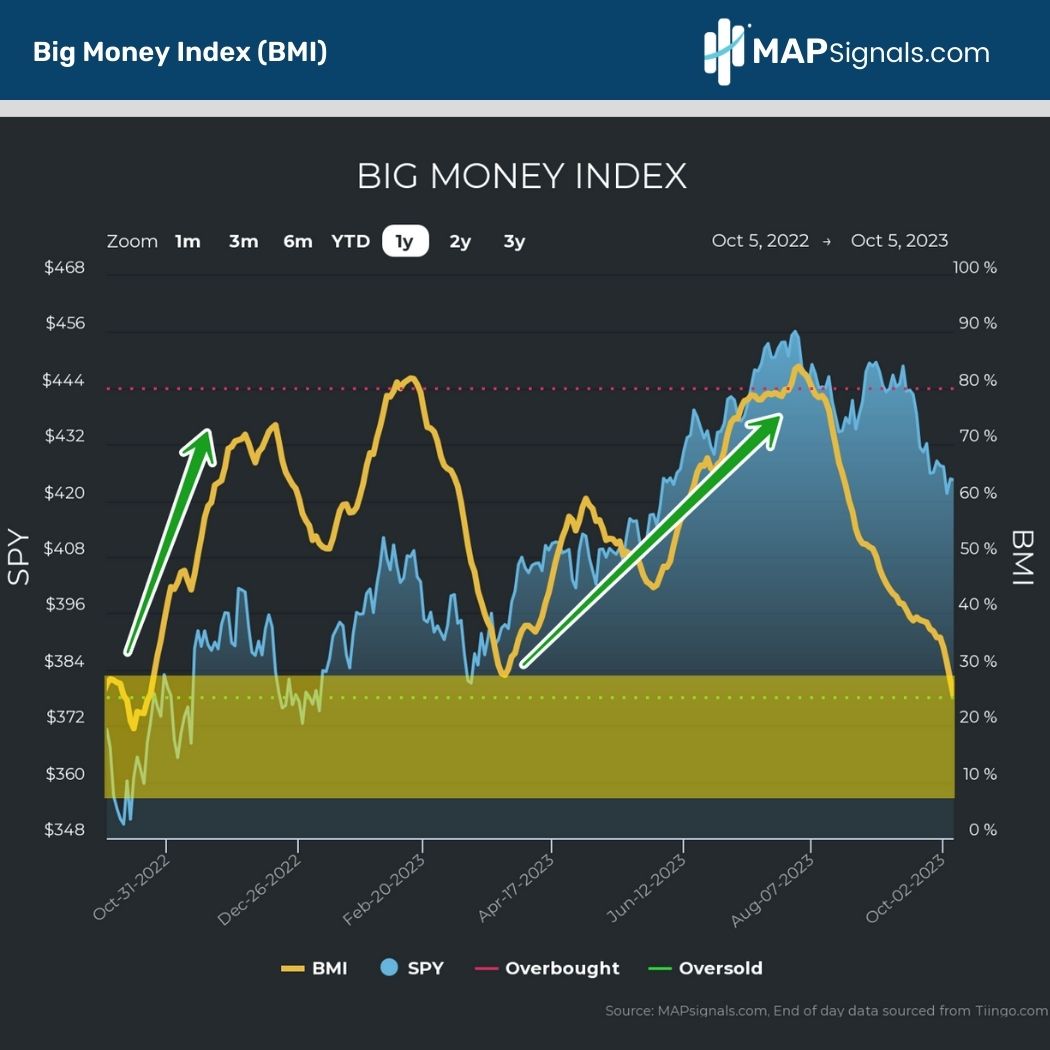
The BMI is a fantastic timing tool. Readings under 30 are rare and indicate stocks are nearing oversold levels. Said in plain English, it’s time to buy.
Conversely, readings over 80 mean stocks are overbought and traders should lighten up.
The BMI rightly told you to buy stocks last October at the bear market bottom when it went oversold at 25. Then it told you to buy the dip in March when it tanked to 29. Then it nailed the July peak when it said to sell stocks as it went overbought at 84.
Let’s face it, the BMI has an amazing batting average!
The BMI just slumped down to the mid-20s. It’s telling you stocks are oversold. It’s time to buy!
How to Play It
The best move when the BMI goes oversold is to buy stocks aggressively. THAT you buy is more important than what you buy.
Rips off oversold BMI levels tend to be very powerful and last for months. We expect a rising tide to lift most boats.
Again, disregard the rate scare and buy stocks now.
If all you do is buy an S&P 500 ETF like Vanguard’s VOO you’ll do fine (VOO’s ER is 1/3 the price of SPY).
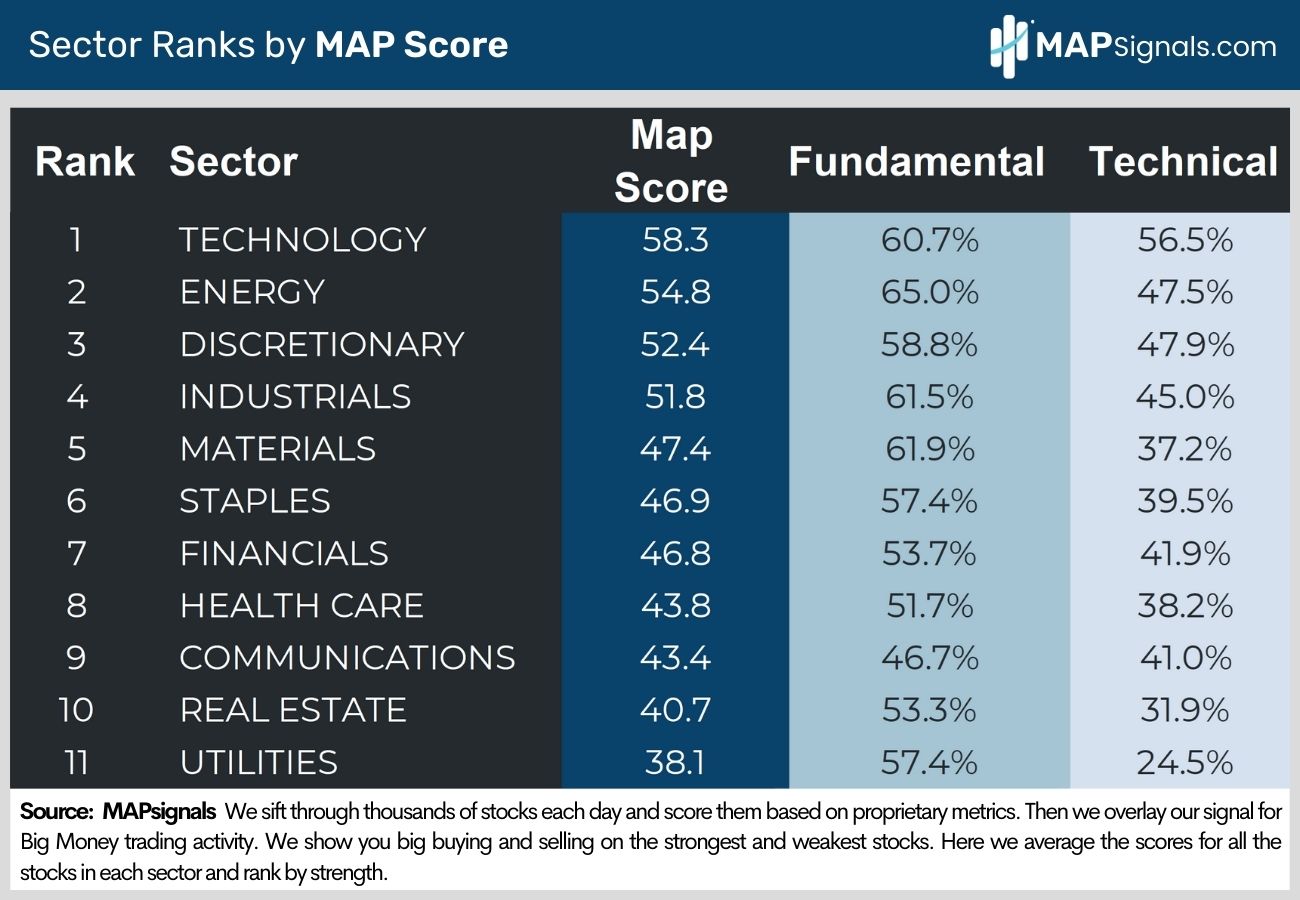
But if you want to do even better, check out MAPsignals’ top ranked sectors – energy and technology.
See how they tower in our sector rankings.
Note that while both have been outperforming nicely, neither are overbought. Recent panicky profit taking amid all the macro handwringing means you can buy energy and tech winners on sale.
Meet the S&P 500’s Cash Kings
We’ve talked a lot about what’s driving big money buying in tech and energy all year.
Here’s a fresh angle.
As rates rise, the huge cash hoards on the books of mega cap tech and big oil are increasingly attracting institutional flows.
That’s because their hefty corporate cash is earning 5.5% in T-bills. High yielding cash acts as a healthy shock absorber that can cushion earnings if macro uncertainty ultimately winds up denting profits.
Think of cash as an insurance policy in uncertain times.
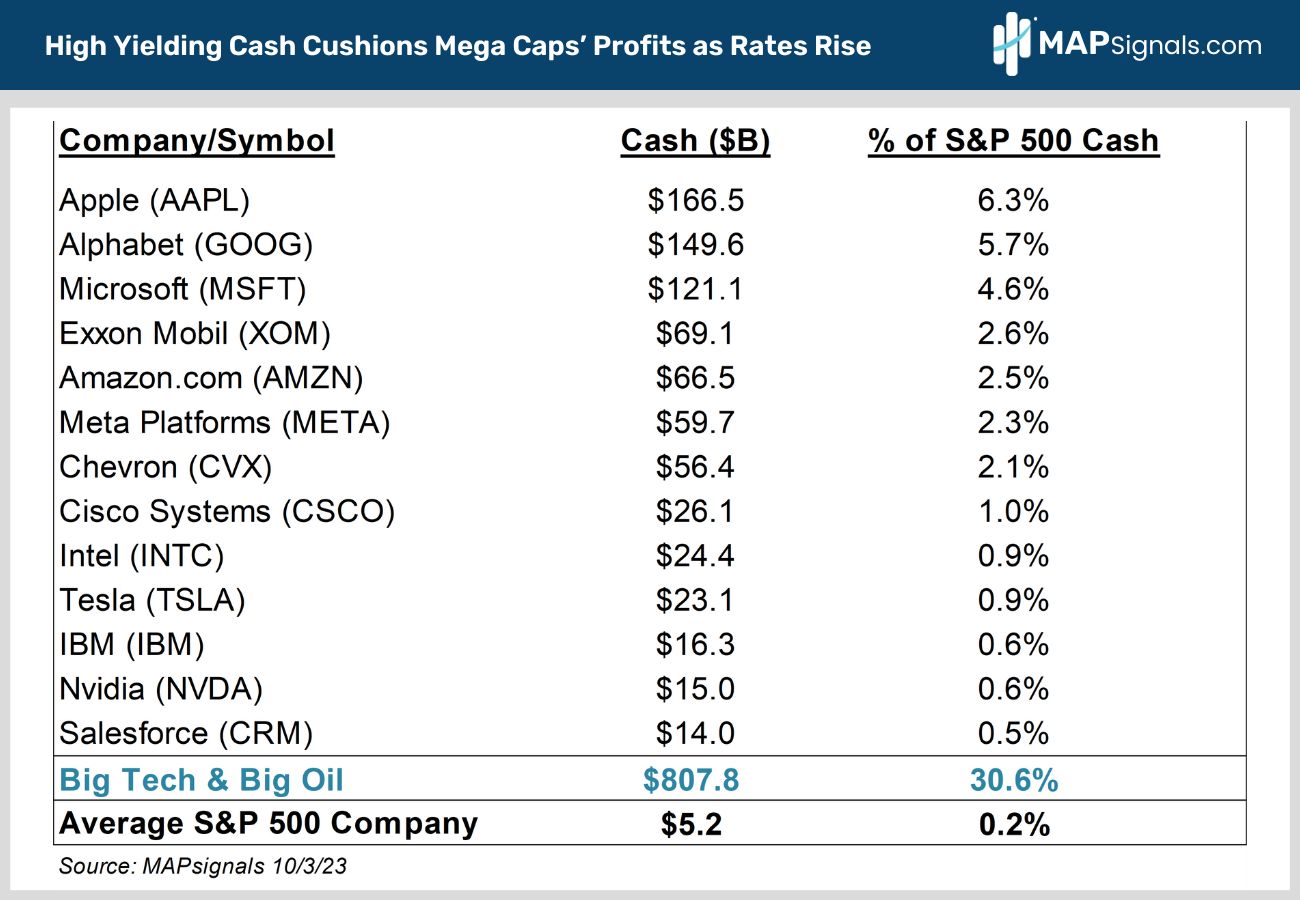
Let’s dig deeper. Check this out.
13 huge tech and oil names are collectively sitting on $807B. That’s 30% of the $2.6T in total cash held by all 500 S&P companies. They’ll earn roughly $42B on that money over the next 12 months!
Apple (AAPL), Google (GOOGL) and Microsoft (MSFT) alone own a combined $477B! That’s 17% of all S&P 500 cash concentrated in just 3 mega cap tech names.
As for big oil, Exxon (XOM) and Chevron (CVX), who together comprise 45% of the S&P 500 energy sector’s market cap, have a combined $125B on their books.
Compare that to the relatively paltry $5.2B held by the average S&P 500 company and you can see how huge, high-yielding cash piles can help the S&P’s cash kings outperform in a murky macro environment.
On the flip side, MAPsignals’ lowest ranked sectors, real estate and utilities are still lagging badly.
Bond proxies with high dividend yields like utilities and real estate have been hit hardest as rising, risk-free 5% bond yields make their 4% payouts significantly less attractive. Plus, high rates increase their financing costs, a headwind to profit growth.
Defensive, counter-cyclical sectors like staples and health care have also underperformed as the economy continues to dodge recession. Their relatively high dividend yields are also undermined by rising rates.
The good news is all these lagging sectors are super-oversold and ripe to rebound when the market turns up soon.
That said, we think higher beta, cyclicals like tech and energy offer the best bang for your buck.
Bringing It All Together
Stocks are being marked down as investors worry tightening financial conditions will make weaker economic and earnings growth inevitable moving forward.
But here’s what the bears miss. All the negativity that’s been mounting for weeks is finally driving panic selling. That’s why the BMI is waving the green flag. That means all the doom and gloom is already priced into depressed stock prices. Everyone who wants to sell already has.
Historically, the S&P 500 has posted above-average 6% returns in the six-month periods following bottom quartile bullish sentiment readings like October 5th’s 30% reading.
So, there you have it. The macro doom and gloom is already baked in the cake and an oversold BMI agrees! That’s a powerful 1, 2 punch!
Don’t fear the doom loop. Buy into it!
If you’re wanting to get specific tech and energy stocks ramping with Big Money support, get started with a MAPsignals PRO subscription. It’ll get you access to our portal that updates every morning, showcasing the stocks getting bought and their scores.
There are plenty of stocks poised to rip off the lows. Use a MAP to find them!
Invest well,
-Alec