• Menu
  • Skip to right header navigation
  • Skip to main content
  • Skip to primary sidebar
  • Skip to footer

MAPsignals

We map big money.

  • Latest Insights
  • Power of MAP
    • MAP Products
    • MAP System
    • MAP White Papers
    • Videos & Interviews
  • Profit with MAP
  • About
    • About MAP
    • MAP Team
    • Authors
    • MAP System
    • MAP Products
    • Big Money Index
  • Members
    • Get Started With MAP
    • My MAP
    • Big Money Charts
    • MAP View
    • MAP View Options
    • MAP Top 20 Weekly
    • MAP 50
    • Member Updates
    • Platinum Updates
    • Members Only Posts
    • Performance
  • Portal

Massive Selling Slows

June 9, 2022 //  by Lucas Downey//  Leave a Comment

Markets move like waves. Money is the current.

Follow that flow and you’ll have an edge. Stocks are rising as massive selling slows.

Massive Selling Slows

Look, I get it. Investing has been a rough ride in 2022. Investors are dealing with an onslaught of non-stop macro headwinds. Inflation is running hot, interest rates keep rising, we have a war in Ukraine, and recession fears echo daily in the headlines.

It’s been choppy waters for months. The selloff has been epic.

Recently though, that’s changing. Our data signals that market pain has died down considerably, sending equities higher. As de-risking grinds to a halt, the latest money current is a tailwind for stocks.

Today I’ll walk you through the Big Money landscape and zero-in on why stocks keep bouncing. Odds are there’s still more near-term upside.

Alright, let’s dive in!

Massive Selling Slows

Just two weeks ago, stocks briefly reached oversold levels. Since then, markets have juiced higher.

Since May 25th, the S&P 500 (SPY) and the tech-heavy NASDAQ gained 3.49% and 5.62% respectively. As I’ve said repeatedly, oversold markets create attractive valuations and are epically bullish for stocks.

You can see the Big Money Index has gone straight up since:

BMI rallies as de-risking stops | Big Money Index

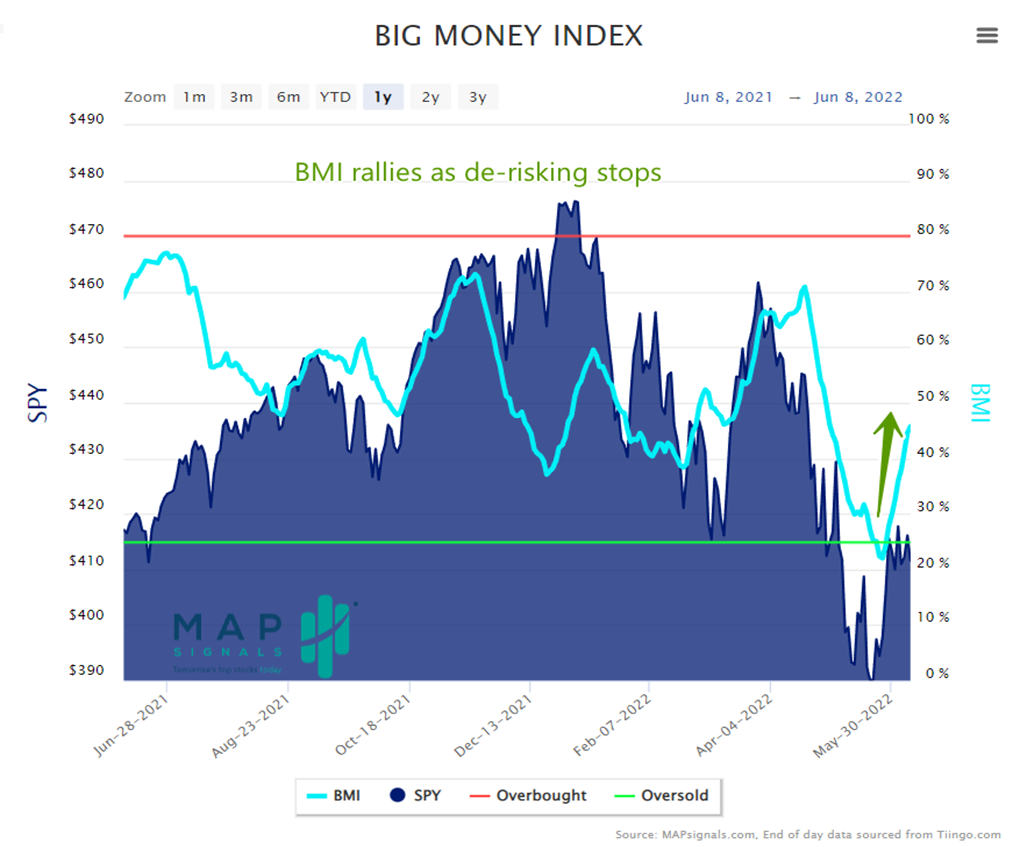
That’s a wicked move higher. The BMI’s latest reading is 46%. Clearly something major is happening under the surface to launch the BMI 24 points higher in 2 weeks. Massive de-leveraging that sent stocks crashing has stopped. The wave of selling crested.

Below you’ll see what I mean. Check out the Big Money Stock Buys and Sells chart. These are the daily buy and sell signals that make up the BMI. When stock selling evaporates, stocks rocket. I’ve outlined in yellow today’s data and marked prior times this similar pattern happened:

Big Money stock buys and sells | When selling stops stocks rocket higher


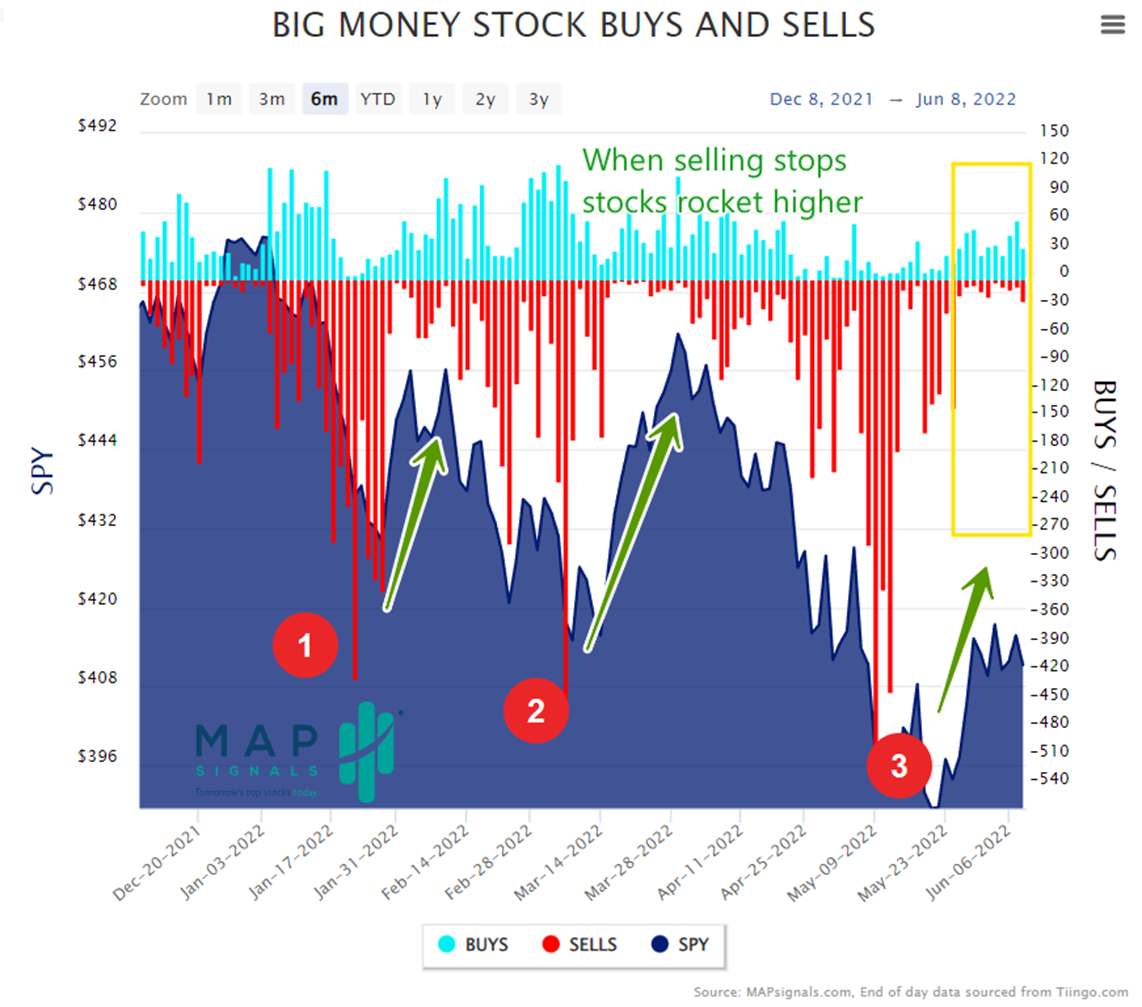
The lack of selling in equities is enough to buoy markets. And looking above, it’s a repeatable pattern, similar to waves in the ocean. As selling picks up, markets fall. When it peaks, they bounce. Using our data you can literally surf these market waves.

But let’s keep going. The buying that we’re witnessing recently is very concentrated. Below is a pie chart breaking down all buy signals via sector since May 25th. Amazingly, Energy makes up nearly half of all the buying:

Percent Buys from Universe | MAPsignals

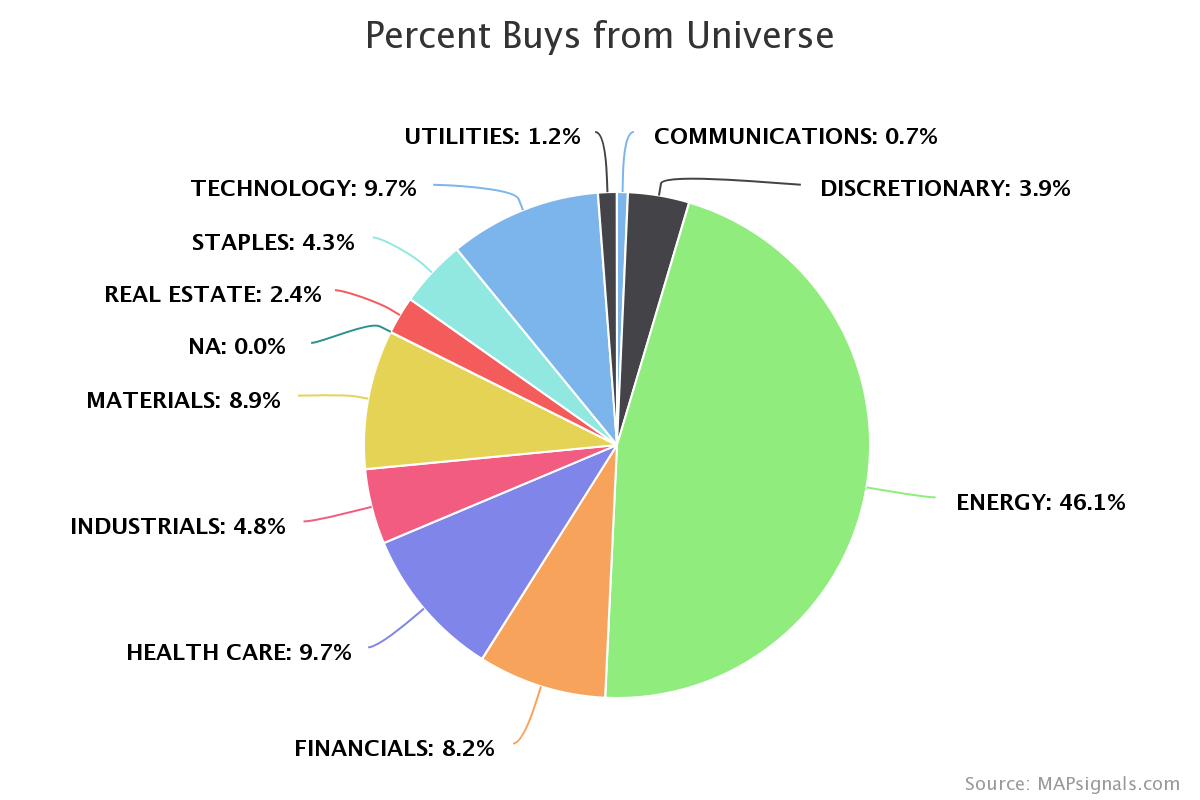
Normally when markets shoot out of oversold areas, I’d expect multiple sectors to participate in the rally. But, in 2022 Energy has been top dog in terms of Big Money flows. Nearly 25% of all buy signals this year have been concentrated in the energy group.

In the next chart, you’ll see the energy buys and sells this year. It’s been a massive non-stop wave of buying:

Energy vs XLE | Big Money Signals

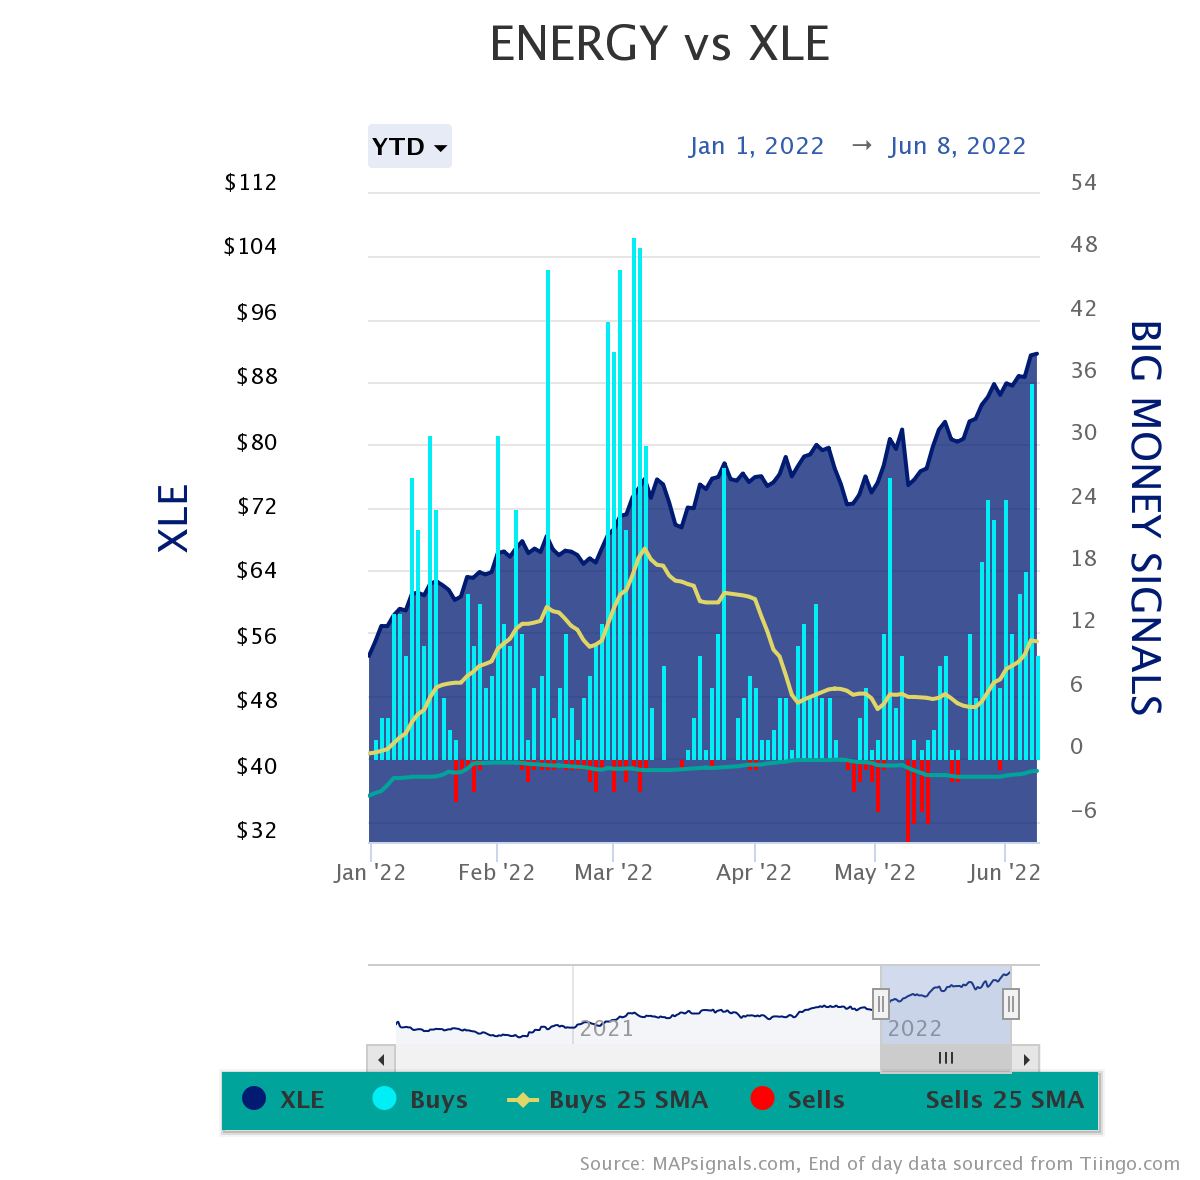
Our data has been all over that move. Now let’s talk stocks.

Oversold Stock Opportunities

Each time the Big Money Index triggers oversold, it’s an opportunity to go shopping for great stocks on sale. History shows that those rare moments don’t last forever.

And on May 23rd we sent a list of 15 stocks to our members, primed for gains once the selling stopped. And boy did they. Below is a screenshot of their performance since. I’ve blurred out the names and returns since this list is for paying members:

Oversold Stock List | Returns to date
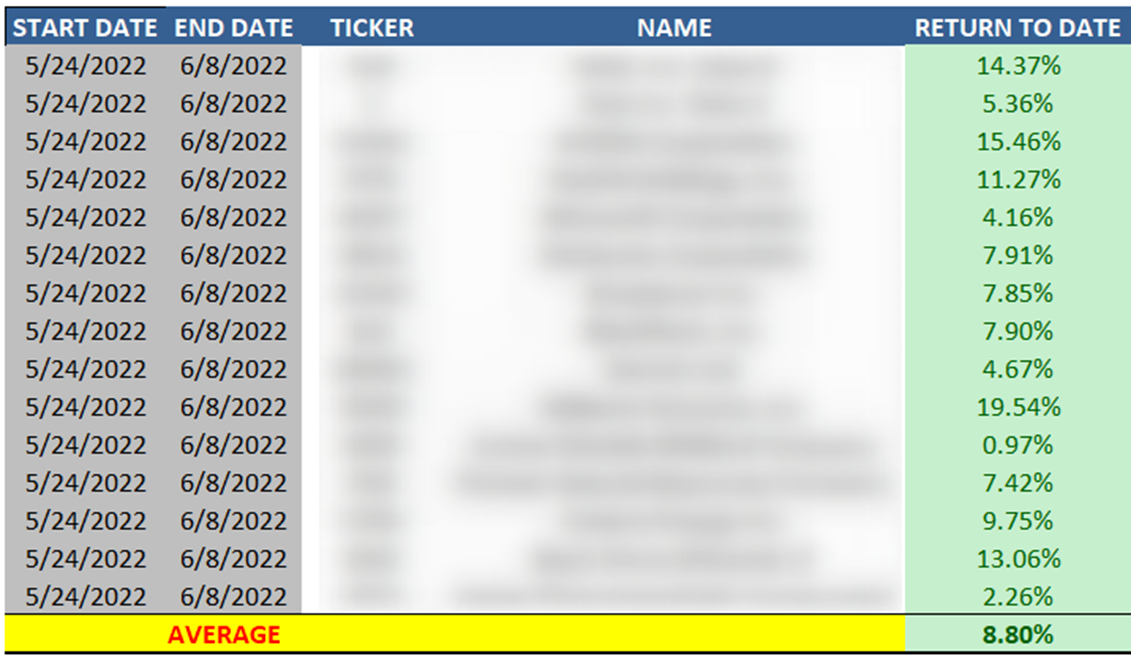
Returns source: FactSet

Those 15 stocks doubled the market with an average gain of 8.8% vs the S&P 500 (SPY) of 4.4%. In a sea of red, we’re proud of that!

Let’s wrap up.

Here’s the bottom line: stocks move like waves in the ocean. Data allows you to follow trends…and ride them. It’s supply and demand 101.

Our data has been signaling a change in trend for 2 weeks. As massive selling slows, stocks are rising. That’s near-term constructive.

We’re still not out of woods yet. For the bulls to take charge we’ll need evidence that buyers are stepping in across the board. I believe the Big Money Index will lead the way.

As Jon Kabat-Zinn said, “You can’t stop the waves, but you can learn to surf.”

I say, surf market waves with MAPsignals! Get started on your investing journey today.

Lucas Downey
Lucas Downey

Lucas is co-founder of MAPsignals. His full bio can be found here.
Prior to MAP, he was Head of ETF Sales at Cantor Fitzgerald & SVP of Derivatives at Jefferies, LLC.

Spread the word!

Category: All, Big Money Insights Weekly

Previous Post: « Best Growth Stocks to Buy Now for June 2022
Next Post: Market Volatility Update 6-10-2022 Market Volatility Update»

Reader Interactions

Leave a Reply Cancel reply

Your email address will not be published. Required fields are marked *

Primary Sidebar

Get Big Money Insights for FREE

Want to know where the Big Money is headed?

Just enter your email address below. You'll get our FREE NEWSLETTER sent directly to your inbox.

We call it Big Money Insights... It’s your weekly sneak peek at the powerful market-moving forces that are hidden from 99% of investors.

"*" indicates required fields

This field is for validation purposes and should be left unchanged.

Categories

  • All
  • Big Money Insights Weekly
  • Big Money Series
  • Macro Insights
  • MAP In The Media
  • Members Only
  • Performance
  • Podcast
  • Special Reports
  • Stocks
  • Videos & Interviews
  • White Papers

Archives

  • February 2023
  • January 2023
  • December 2022
  • November 2022
  • October 2022
  • September 2022
  • August 2022
  • July 2022
  • June 2022
  • May 2022
  • April 2022
  • March 2022
  • February 2022
  • January 2022
  • December 2021
  • November 2021
  • October 2021
  • September 2021
  • August 2021
  • July 2021
  • June 2021
  • May 2021
  • April 2021
  • March 2021
  • February 2021
  • January 2021
  • December 2020
  • November 2020
  • October 2020
  • September 2020
  • August 2020
  • July 2020
  • June 2020
  • May 2020
  • April 2020
  • March 2020
  • February 2020
  • January 2020
  • December 2019
  • November 2019
  • October 2019
  • September 2019
  • August 2019
  • July 2019
  • June 2019
  • May 2019
  • April 2019
  • March 2019
  • February 2019
  • January 2019
  • December 2018
  • November 2018
  • October 2018
  • September 2018
  • August 2018

Follow us on Twitter

MAPsignals Follow 1,434 1,061

MAPsignals is a data platform that tracks institutional money flows in stocks and ETFs. Sign up for free insights here: https://t.co/SaAVHjKC9J

mapsignals
mapsignals avatar; MAPsignals @mapsignals ·
58m 1621476848990359552

Pendulum has swung

Helene Meisler @hmeisler

Highest volume for the QQQs since 12/13

Reply on Twitter 1621476848990359552 Retweet on Twitter 1621476848990359552 0 Like on Twitter 1621476848990359552 0 Twitter 1621476848990359552
Load More...

Footer

© 2021 Mapsignals.com

  • Home
  • Contact & Disclaimer
  • Privacy Policy
  • Terms & Conditions
  • Opt-out preferences
  • FAQ

Copyright © 2023 · Mai Law Pro on Genesis Framework · WordPress · Log in

✕
What Happened to Risk Assets White Paper is Here

Get your copy here and take a journey through our thoughts on margin and leverage.

Enter your email address below and you'll get our FREE NEWSLETTER sent directly to your inbox. 

 We call it Big Money Insights... It’s your weekly sneak peek at the powerful market-moving forces that are hidden from 99% of investors.

MAPsignals
Manage Cookie Consent
We use cookies to optimize our website and our service.
Functional Always active
The technical storage or access is strictly necessary for the legitimate purpose of enabling the use of a specific service explicitly requested by the subscriber or user, or for the sole purpose of carrying out the transmission of a communication over an electronic communications network.
Preferences
The technical storage or access is necessary for the legitimate purpose of storing preferences that are not requested by the subscriber or user.
Statistics
The technical storage or access that is used exclusively for statistical purposes. The technical storage or access that is used exclusively for anonymous statistical purposes. Without a subpoena, voluntary compliance on the part of your Internet Service Provider, or additional records from a third party, information stored or retrieved for this purpose alone cannot usually be used to identify you.
Marketing
The technical storage or access is required to create user profiles to send advertising, or to track the user on a website or across several websites for similar marketing purposes.
Manage options Manage services Manage vendors Read more about these purposes
View preferences
{title} {title} {title}