• Menu
  • Skip to right header navigation
  • Skip to main content
  • Skip to primary sidebar
  • Skip to footer

MAPsignals

We map big money.

  • Latest Insights
  • Power of MAP
    • MAP Products
    • MAP System
    • White Papers
    • Videos & Interviews
  • Profit with MAP
  • About
    • About MAP
    • MAP Team
    • Authors
    • MAP System
    • MAP Products
    • Big Money Index
  • Members
    • Get Started With MAP
    • My MAP
    • Big Money Charts
    • MAP View
    • MAP View Options
    • MAP Top 20 Weekly
    • MAP 50
    • Member Updates
    • Platinum Updates
    • Members Only Posts
    • Performance
  • Portal

Valuations are Becoming Attractive

May 25, 2022 //  by Lucas Downey//  4 Comments

The bears are out in full force. And I don’t blame them – there’s a lot to be worried about on the economic front.

But there’s also reason to be hopeful and bullish. Markets are officially oversold, and valuations are becoming attractive.

Valuations are Becoming Attractive

It’s hard to find reasons to buy stocks right now. Inflation is raging at 40-year highs, interest rates are on the upswing, and the S&P 500 briefly entered a bear market last week. These are just a few of a never-ending onslaught of negative headlines.

Add to the list of ugly, new homes sales plunged 16.6% in April. Ugh.

There’s no denying the murky outlook for stocks. But on the flipside, when all hope is lost, opportunity emerges. Today I’ll make the case why we could be looking at higher stock prices in the months ahead.

Let’s now turn to data.

Big Money Index is Oversold

To start off, we’ll check in on the big event: The Big Money Index has finally hit oversold levels.

Last week the memo went out. I suggested how the Big Money Index should hit oversold within days. We pierced through the rare green line Wednesday morning.

The BMI sits at a 2+ year low of 22%:

Big Money Index | 1ST day oversold since March 18th 2020

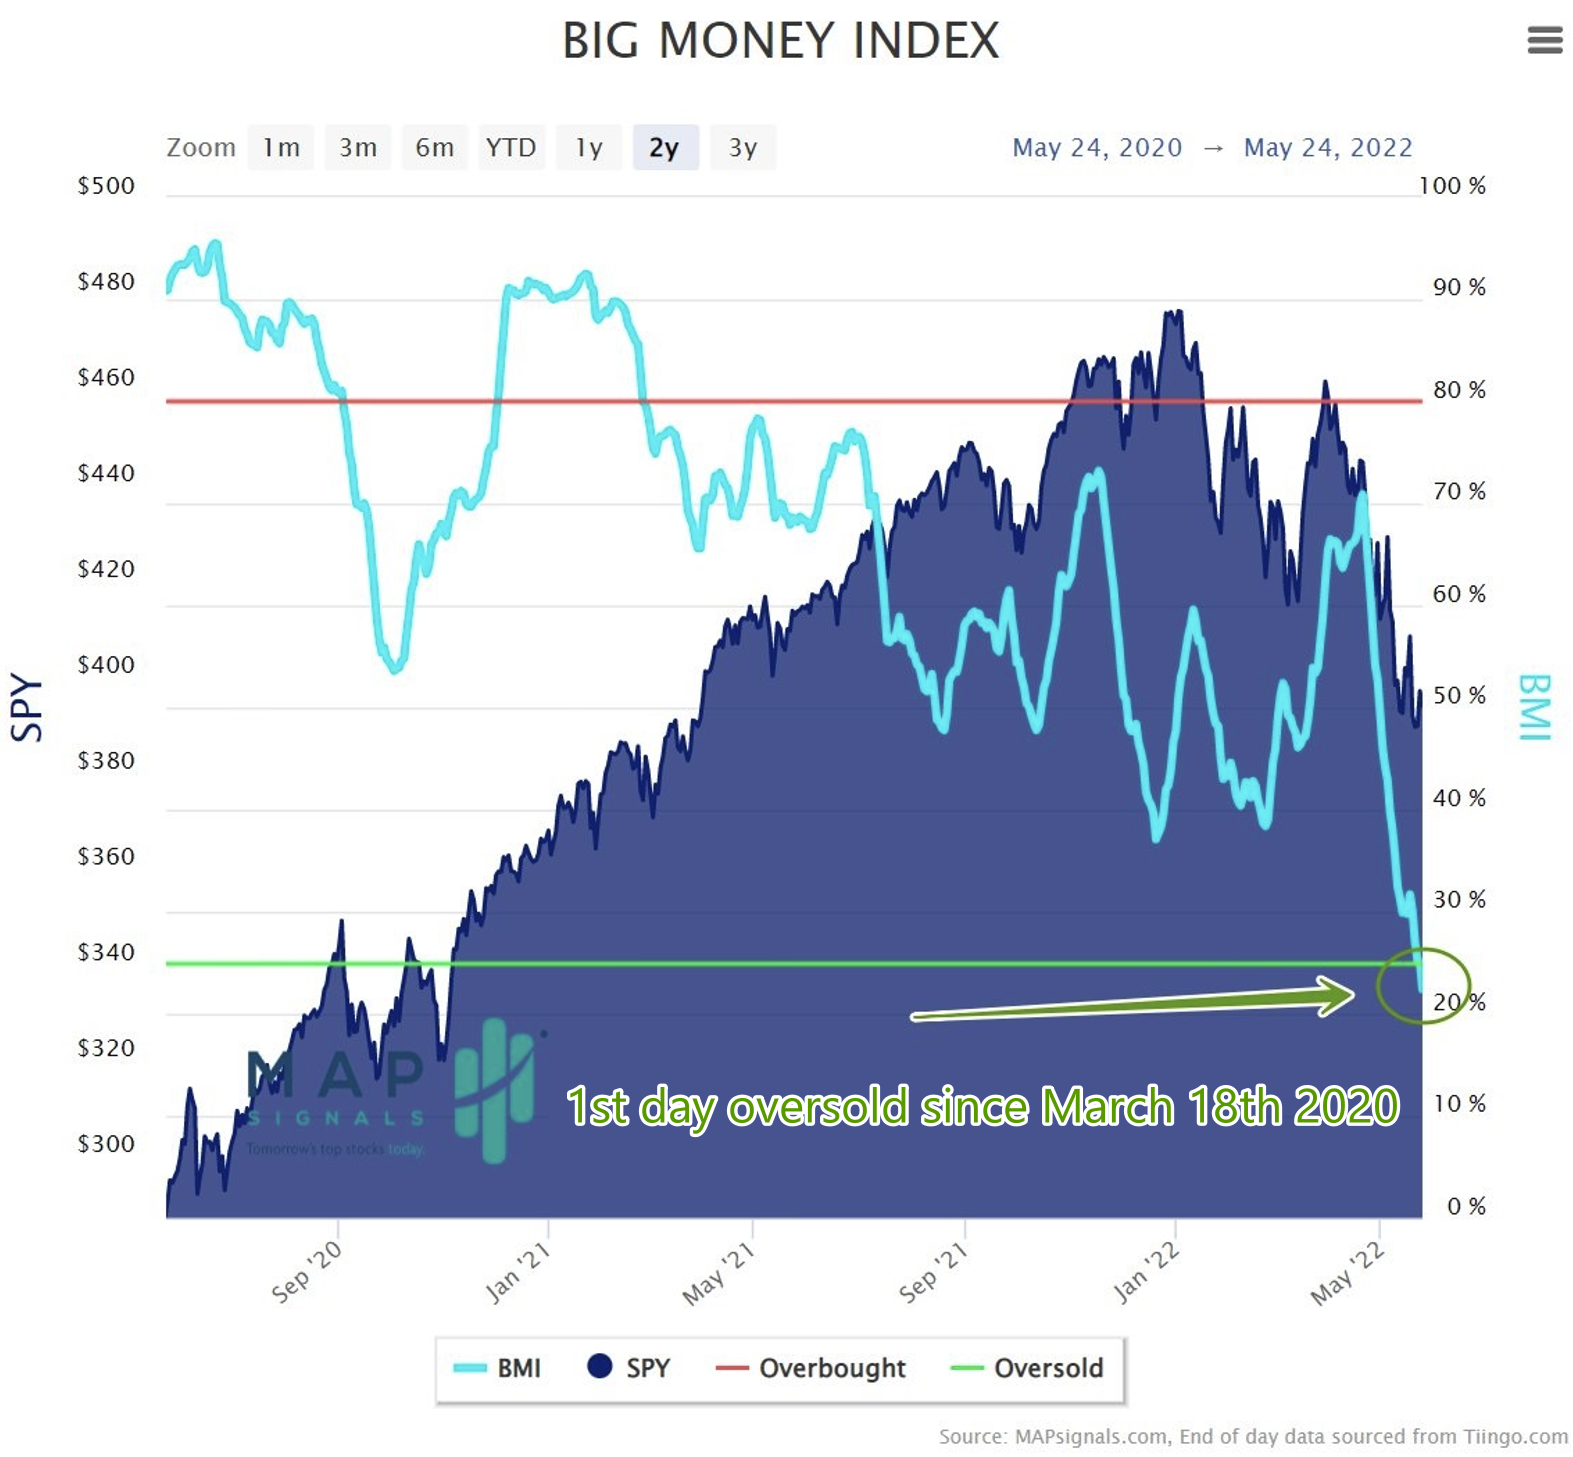
We are in rare times folks. It’s not often that I get to opine on moments like now. Only when the market reaches a tipping point does this signal flash. You can bet when the BMI is oversold, most investors have given up. But you shouldn’t.

It’s usually when there’s zero reason to own stocks that the biggest bargains appear. That’s why when headlines are a never-ending death spiral, I turn to data. I search for opportunity.

If the BMI could speak it’d probably say to “Expect better days ahead. Selling like this rarely lasts.”

I’d agree. Below are all oversold instances the last 10 years. Notice how when the electric blue line dips below the horizontal green line, markets are often near lows:

9 oversold instances in 10 years | Big Money Index

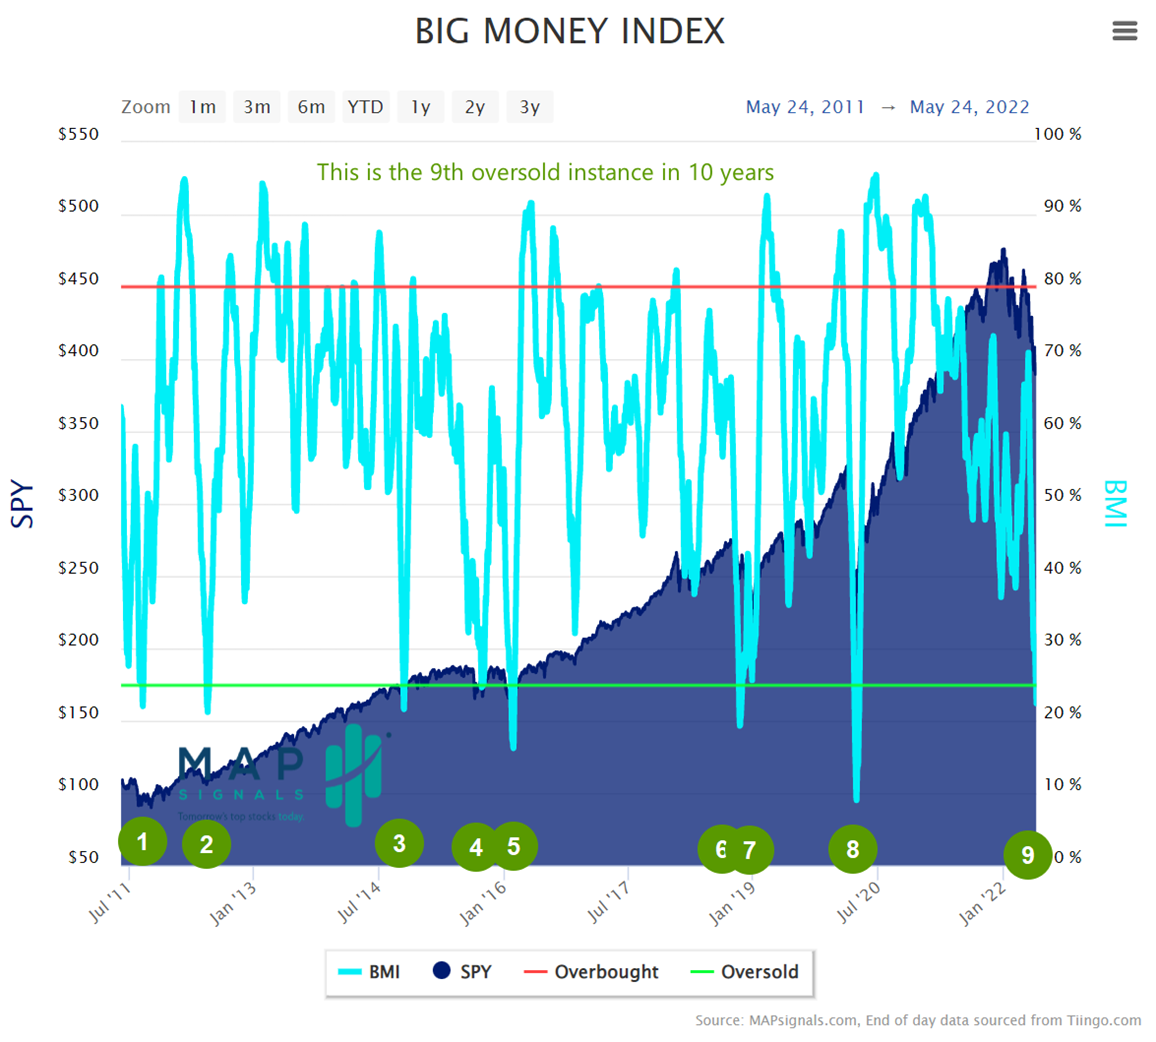
Each of those green bubbles represent depressed periods for stocks, very similar to today. Included is the pandemic lows of March 2020. Prior to that was October – December 2018. Those were dire times indeed. But as it relates to stocks, they were massive buy opportunities.

Get this, since 2011, the 8 oversold triggers prefaced the S&P 500 gaining an average of 22.8% a year later. Two years later saw stocks rally 39.2%!

So, while today’s environment is facing headwinds, the fact remains that selling of this magnitude rarely lasts. To prove that point, notice in the chart above how the BMI has tended to reach overbought soon after falling in the green zone. That’s right, often once massive de-risking stops, buyers swoop in…fast.

That’s why I’m focused on the small window of opportunity right now rather than fear.

You should be too.

And finally, when stocks are pushed lower month-after-month, week-after-week, and day-after-day – it means valuations are becoming attractive.

Check it out.

Valuations are Becoming Attractive

There are plenty of valuation metrics out there. But one of the most widely followed is the price to earnings ratio (P/E). To calculate it, simply take a stock’s price and divide it by its earnings. This simple ratio tells us what investors are willing to pay for an asset based on what it earns.

You can plot the P/E of the market as well. Just divide the index price by its earnings.

Below is a chart of the trailing 12-month P/E ratio of the S&P 500 from FactSet. Notice how the ratio has collapsed:

S&P 500 trailing PE

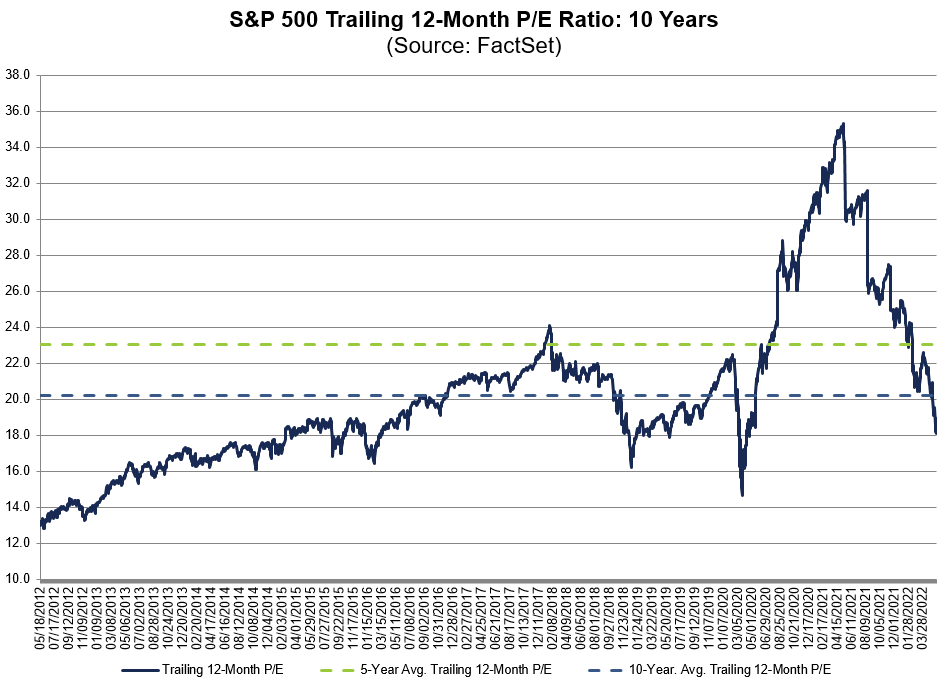
Currently the P/E sits at 18.1 which is below the 5-year average of 23.1 and 10-year average of 20.2. Value hunters should be getting giddy right about now. Keep in mind, this ratio is looking backwards at the prior year of earnings.

Now let’s look forward.

Below plots the 12-month forward P/E ratio for the market. This takes the price of the S&P 500 index and divides it by the expected earnings next year:

S&P 500 forward PE

Currently, the forward P/E sits at 16.4, which is below the 5-year average of 18.6 and 10-year average of 16.9. Keep in mind, forward earnings are an estimate which can change. But there’s no denying that as assets fall in dramatic fashion, valuations are becoming attractive.

Marrying an oversold BMI and valuation contraction could set us up for a big relief rally soon. It wouldn’t surprise me one bit.

Let’s wrap up.

Here’s the bottom line: Ladies and gentlemen, the Big Money Index is oversold. It’s our rarest buy signal. History shows that moments like now are often when investors can win big.

Add to it the falling P/E ratio of the market, and you’ve got an attractive picture being painted for stocks.

Look, I don’t have a crystal ball. I’ve just sat through plenty of pullbacks to know that relentless selling in stocks is a chance to pick up great stocks at bargain prices.

I’m not buying into the fear.

I’m buying into great businesses.

The BMI has steered me right many times in the past. I’m willing to bet on it again.

What about you?

***And if you want a fresh list of oversold stocks on our radar that we believe will thrive in the months and years ahead, check out this members only post. It’s available to all MAPsignals subscribers.

Included are 5 oversold growth stocks, 5 dividend growth opportunities, and 5 stocks that benefit in the current inflationary environment.

Lucas Downey
Lucas Downey

Lucas is co-founder of MAPsignals. His full bio can be found here.
Prior to MAP, he was Head of ETF Sales at Cantor Fitzgerald & SVP of Derivatives at Jefferies, LLC.

Spread the word!

Category: All, Big Money Insights Weekly

Previous Post: «Best Oversold Stocks to Buy for June 2022 Best Oversold Stocks to Buy for June 2022
Next Post: Best Energy ETFs to Buy Now for 2022 Best Energy ETFs to Buy Now for 2022»

Reader Interactions

Comments

  1. Greg K.

    May 26, 2022 at 10:25 am

    This is really important and relevant data. Thank you! I’m retired and, of course, nervous about the current state of the market. This puts it in perspective.

    Reply
    • MAPsignals Staff

      May 26, 2022 at 10:29 am

      Thanks for the comment, Greg. There’s many positives shaping up in the next few months+. If the macro picture gets better, even slightly, the investing world could look a lot stronger.

      Eventually buyers will show up again…Odds are our data will see them 🙂

      Reply
  2. tom

    May 26, 2022 at 5:42 pm

    you guys are great. i look forward to your posts like religion.

    Reply
    • MAPsignals Staff

      May 26, 2022 at 6:00 pm

      Thank you! Spread the word!

      Reply

Leave a Reply Cancel reply

Your email address will not be published. Required fields are marked *

Primary Sidebar

Get Big Money Insights for FREE

Want to know where the Big Money is headed?

Just enter your email address below. You'll get our FREE NEWSLETTER sent directly to your inbox.

We call it Big Money Insights... It’s your weekly sneak peek at the powerful market-moving forces that are hidden from 99% of investors.

"*" indicates required fields

This field is for validation purposes and should be left unchanged.

Categories

  • All
  • Big Money Insights Weekly
  • Big Money Series
  • Macro Insights
  • MAP In The Media
  • Members Only
  • Performance
  • Podcast
  • Special Reports
  • Stocks
  • Videos & Interviews
  • White Papers

Archives

  • June 2022
  • May 2022
  • April 2022
  • March 2022
  • February 2022
  • January 2022
  • December 2021
  • November 2021
  • October 2021
  • September 2021
  • August 2021
  • July 2021
  • June 2021
  • May 2021
  • April 2021
  • March 2021
  • February 2021
  • January 2021
  • December 2020
  • November 2020
  • October 2020
  • September 2020
  • August 2020
  • July 2020
  • June 2020
  • May 2020
  • April 2020
  • March 2020
  • February 2020
  • January 2020
  • December 2019
  • November 2019
  • October 2019
  • September 2019
  • August 2019
  • July 2019
  • June 2019
  • May 2019
  • April 2019
  • March 2019
  • February 2019
  • January 2019
  • December 2018
  • November 2018
  • October 2018
  • September 2018
  • August 2018

Follow us on Twitter

MAPsignals Follow 619 842

MAPsignals is a data platform that tracks institutional money flows in and out of the market.

mapsignals
mapsignals avatar; MAPsignals @mapsignals ·
30 Jun 1542518642461384709

The first half of 2022 is in the books.

The #bearmarket has sent #stocks tumbling.

Today, @LukeDowney reviews how sectors performed YTD and highlights two #sectors primed for upside. $XLY $XLK

Read here: https://mapsignals.com/map-blog/two-sectors-are-primed-for-upside/

Image for the Tweet beginning: The first half of 2022 Twitter feed image.
Reply on Twitter 1542518642461384709 Retweet on Twitter 1542518642461384709 0 Like on Twitter 1542518642461384709 1 Twitter 1542518642461384709
Load More...

Subscribe To Our YouTube Channel

MAPsignals

MAPsignals
#Capitulation #BearMarket2022 #StockMarketSelloff
Stock market capitulation is here. In this video, Luke dives into what capitulation is and what it means for stocks. Check out our latest blog post: https://mapsignals.com/map-blog/

What does capitulation mean for markets? It is when there's no leadership and investors throw in the towel. You've heard the saying, "sell first, ask question later?" That's how Wall Street thinks.

But these rare moments often lead to bargains for stocks. Capitulation can often lead to bottoms being formed in stocks.

As Lucas Downey shows, these moments are usually when investors should focus on quality companies in this bear market environment. Long-term is the best mindset in a bear market.

The best stock market analysis we've found is following the Big Money. MAPsignals doesn't argue with data.

Learn more at www.MAPsignals.com
Remember this is not personal investment advice of any kind. This video is for entertainment purposes only. Our focus is to help investors make sense of markets with data.

Our disclaimer can be found here: https://mapsignals.com/contact/

Music by Karl Casey @ White Bat Audio
Stock Market Capitulation is Here | Bear Market 2022
YouTube Video UC4nueJix0bSLmZyilUuCVrQ_xzXHj_aJvss
Load More... Subscribe

Footer

© 2021 Mapsignals.com

  • Home
  • Contact & Disclaimer
  • Privacy Policy
  • Terms & Conditions
  • Cookie Policy (US)
  • FAQ

Copyright © 2022 · Mai Law Pro on Genesis Framework · WordPress · Log in

✕
What Happened to Risk Assets White Paper is Here

Get your copy here and take a journey through our thoughts on margin and leverage.

Enter your email address below and you'll get our FREE NEWSLETTER sent directly to your inbox. 

 We call it Big Money Insights... It’s your weekly sneak peek at the powerful market-moving forces that are hidden from 99% of investors.

Manage Cookie Consent
We use cookies to optimize our website and our service.
Functional Always active
The technical storage or access is strictly necessary for the legitimate purpose of enabling the use of a specific service explicitly requested by the subscriber or user, or for the sole purpose of carrying out the transmission of a communication over an electronic communications network.
Preferences
The technical storage or access is necessary for the legitimate purpose of storing preferences that are not requested by the subscriber or user.
Statistics
The technical storage or access that is used exclusively for statistical purposes. The technical storage or access that is used exclusively for anonymous statistical purposes. Without a subpoena, voluntary compliance on the part of your Internet Service Provider, or additional records from a third party, information stored or retrieved for this purpose alone cannot usually be used to identify you.
Marketing
The technical storage or access is required to create user profiles to send advertising, or to track the user on a website or across several websites for similar marketing purposes.
Manage options Manage services Manage vendors Read more about these purposes
View preferences
{title} {title} {title}