• Menu
  • Skip to right header navigation
  • Skip to main content
  • Skip to primary sidebar
  • Skip to footer

MAPsignals

We map big money.

  • Latest Insights
  • Power of MAP
    • MAP Products
    • MAP System
    • MAP White Papers
    • Videos & Interviews
  • Profit with MAP
  • About
    • About MAP
    • MAP Team
    • Authors
    • MAP System
    • MAP Products
    • Big Money Index
  • Members
    • Get Started With MAP
    • My MAP
    • Big Money Charts
    • MAP View
    • MAP View Options
    • MAP Top 20 Weekly
    • MAP 50
    • Member Updates
    • Platinum Updates
    • Members Only Posts
    • Performance
  • Portal

Massive Stock Selloff In January

January 20, 2022 //  by Lucas Downey//  6 Comments

I’ll be blunt. Stock portfolios are getting destroyed.

The data is ugly. Today we’ll cover the massive stock selloff in January.

Massive Stock Sell Off In January

To say this market’s been difficult to navigate is an understatement. What goes up one week gets pounded the next. Headlines change on a dime. Since February, we’ve had constant violent sector rotations.

Growth stocks go up, then down. Reopen stocks go down, then up. Heads have been spinning.

But what’s happening this week specifically is a different tone. As I’ll show you, we’ve seen the most ETF selling since the pandemic lows.

That’s right. There’s incredible turmoil. Descriptive words like carnage and de-risking come to mind.

The seasonally strong January isn’t helping investors. Heck, I made the case where stocks can rally in 2022. So far, the opposite is true.

When you’re a die-hard bull like me, you search for positives in data.

Buying dips worked handsomely in 2021… And for years, it’s worked more than not. I’ve conditioned myself to buy when there’s panic. More on that in a bit.

So, what’s an investor to do in 2022? That’s what I’ll cover today.

But first, we’ve got to cover the massive stock selloff in January. There’s only one way to do it…with data.

Let’s strap in.

Big Money Index Points To Nasty Sector Rotations

The BMI was designed to spot extreme points in the market. When there’s too much buying, it signals overbought. When selling gets nasty, markets get oversold.

On the surface, the BMI doesn’t show how painful the selloff is:

overbought oversold rangebound BMI

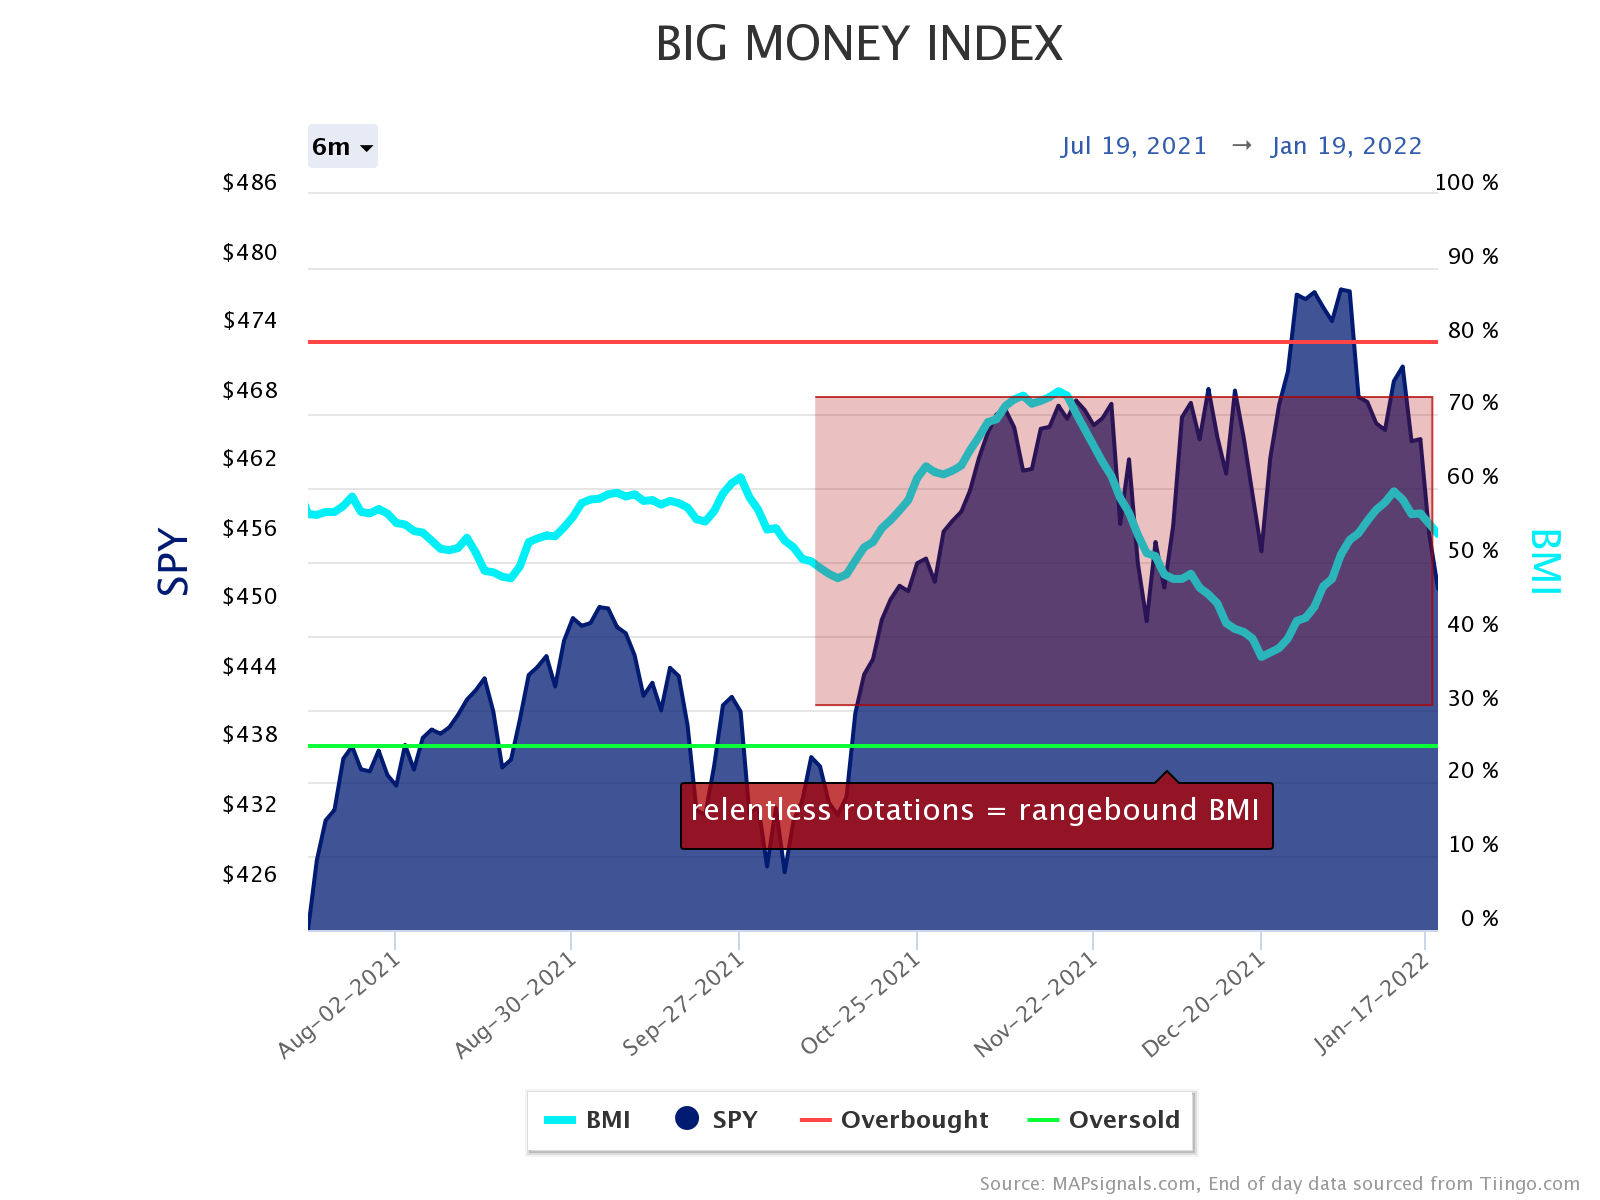
This is because, when the BMI gets overbought and oversold, it signals that the trend of buying or selling is extreme. When buying and selling changes directions all the time, we get choppy data.

That’s what’s been going on for the better part of a year. Looking at the daily action in stocks shows that clearly.

I’ve drawn arrows showing that big selling rarely lasts:

Massive stock sell off in January

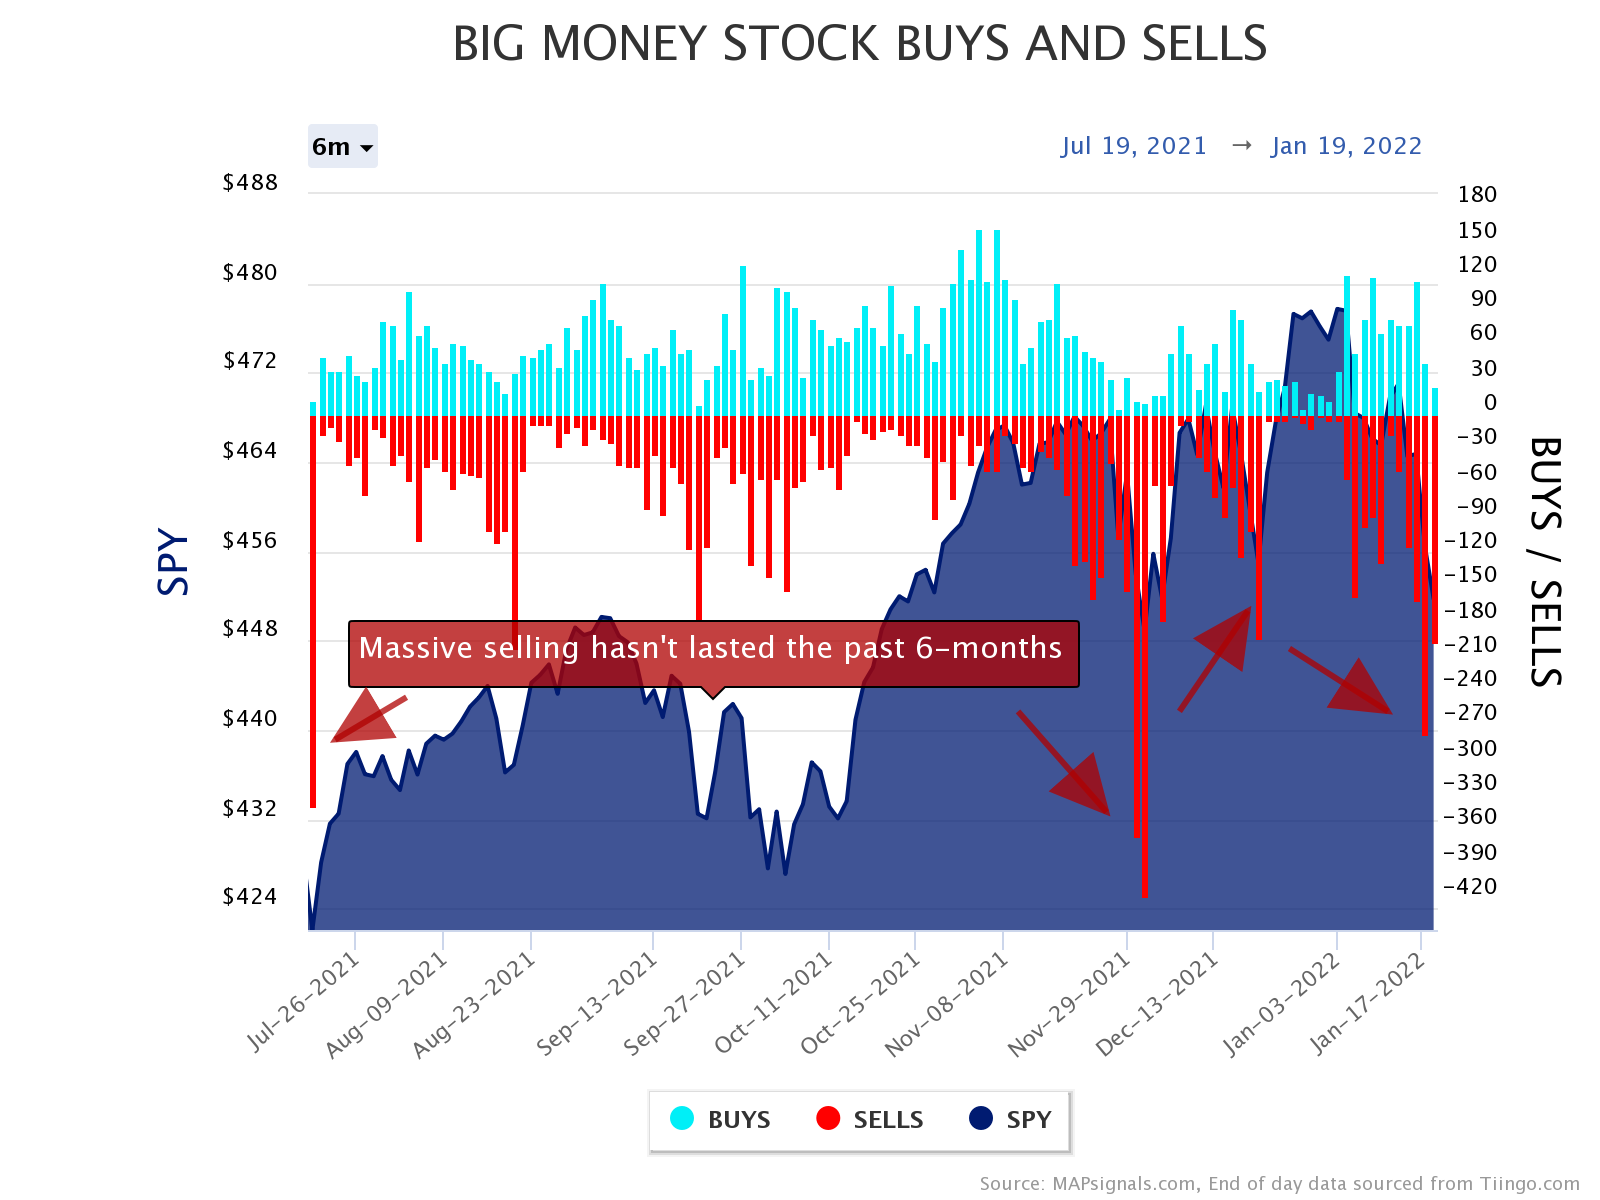
The last arrow to the right is Tuesday’s data. It was a nasty selloff. By all accounts, it looks similar to prior big sell days that didn’t last long.

But the massive stock selloff in January has been more ETF driven. Below, are the daily buys and sells of ETFs. Tuesday rang up monster ETF sell counts:

Massive ETF selling in January

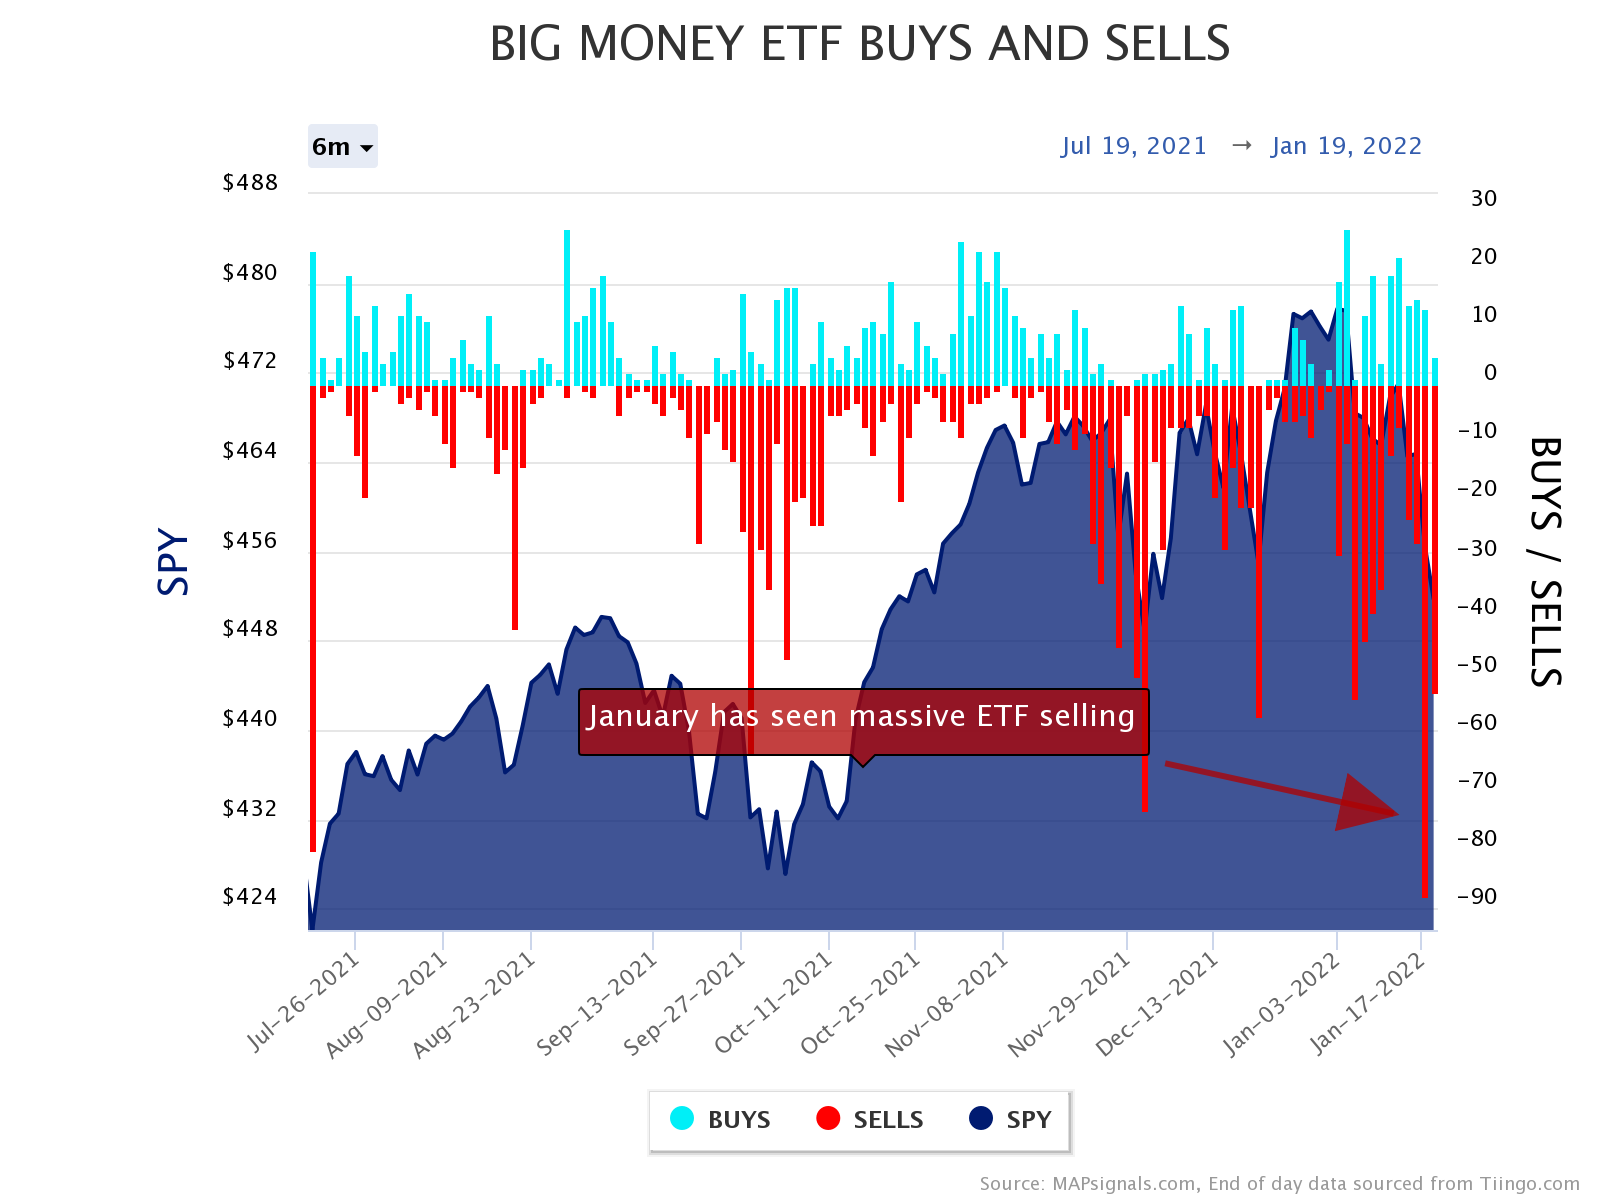
In fact, we haven’t seen this level of selling since the pandemic low on March 23rd 2020:

most ETF selling since the pandemic

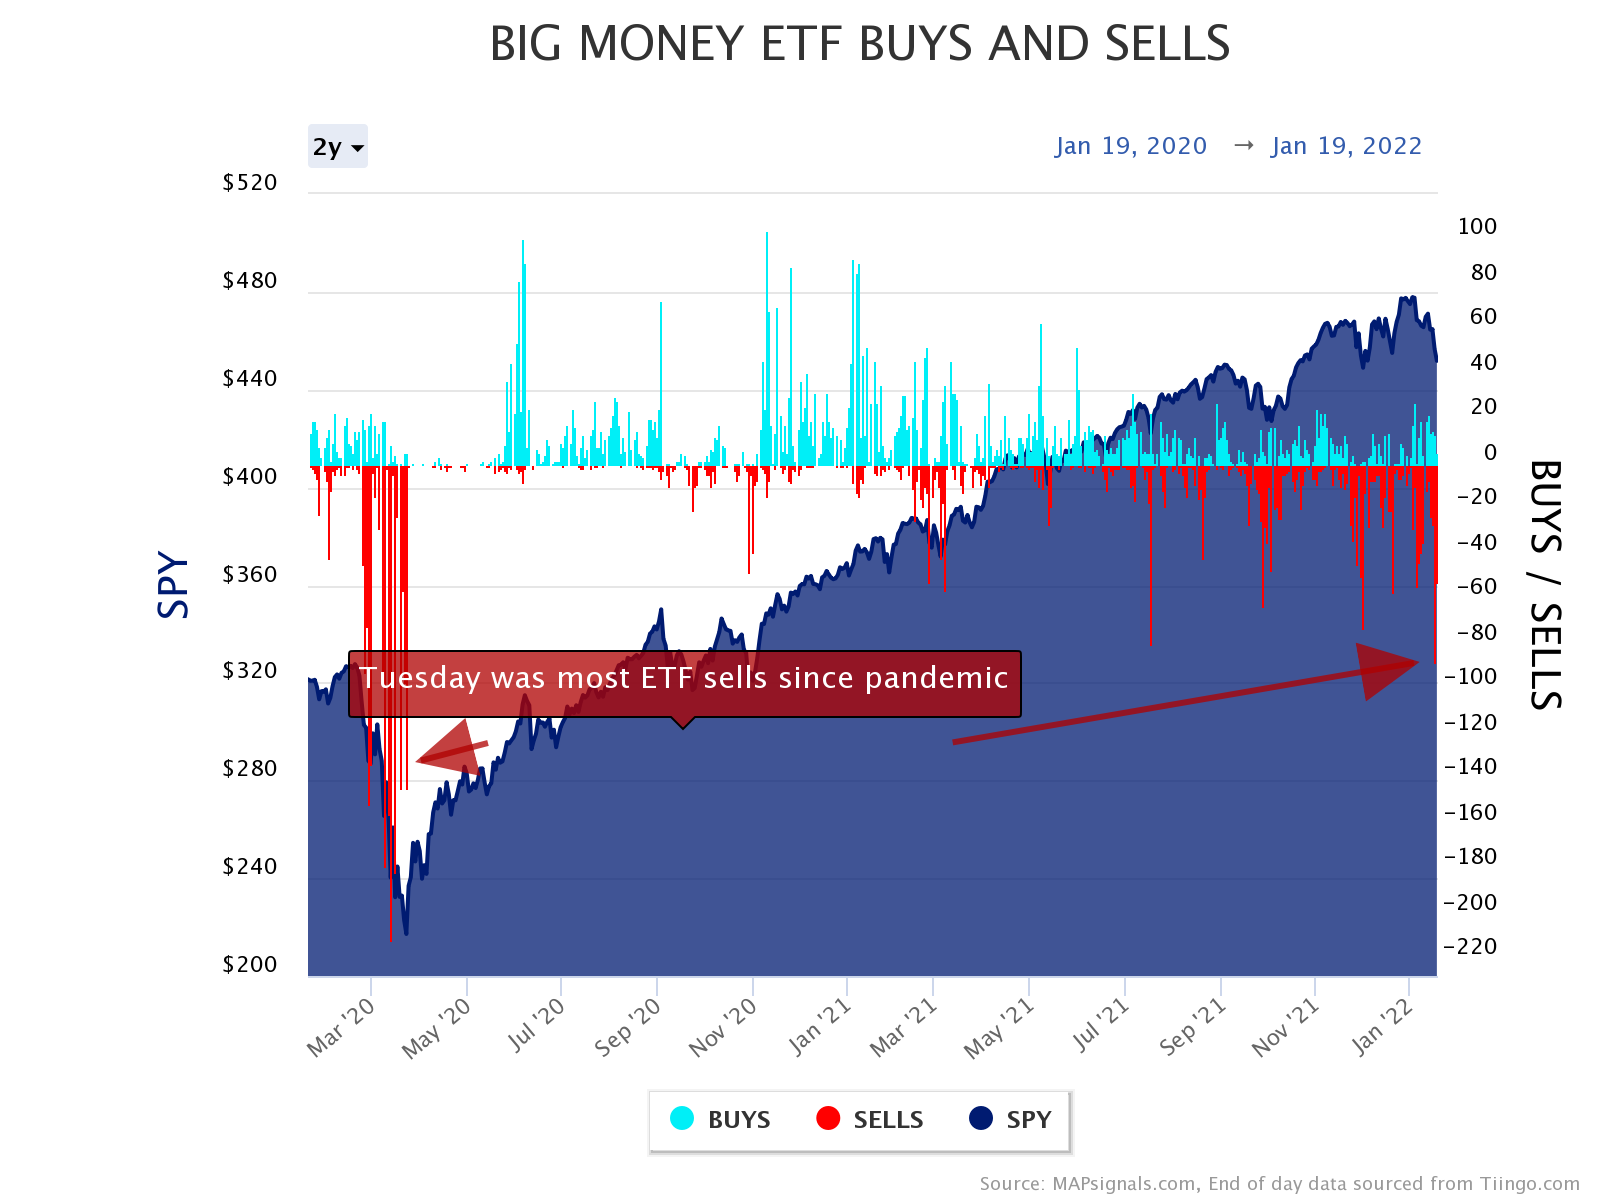
This is off the charts action. Equity and bond ETFs have been sold into oblivion.

Tuesday was bad, but nothing compared to the pain we saw in March 2020…so, let’s keep this week in perspective. Yes it’s bad…but we’ve seen much worse.

Now let’s view the massive stock selloff in January through the lens of sectors. Believe it or not, there are a few areas seeing green.

Massive Stock Selloff In January 2022

Last week I showed how Financials and Energy stocks are seeing relentless buying. That’s still the case. And looking at all of the buys of stocks in 2022, it’s clear as day where the Big Money is flowing.

Nearly 50% of all stocks getting bought are Financials and Energy stocks:

percent buys from universe | energy | financials

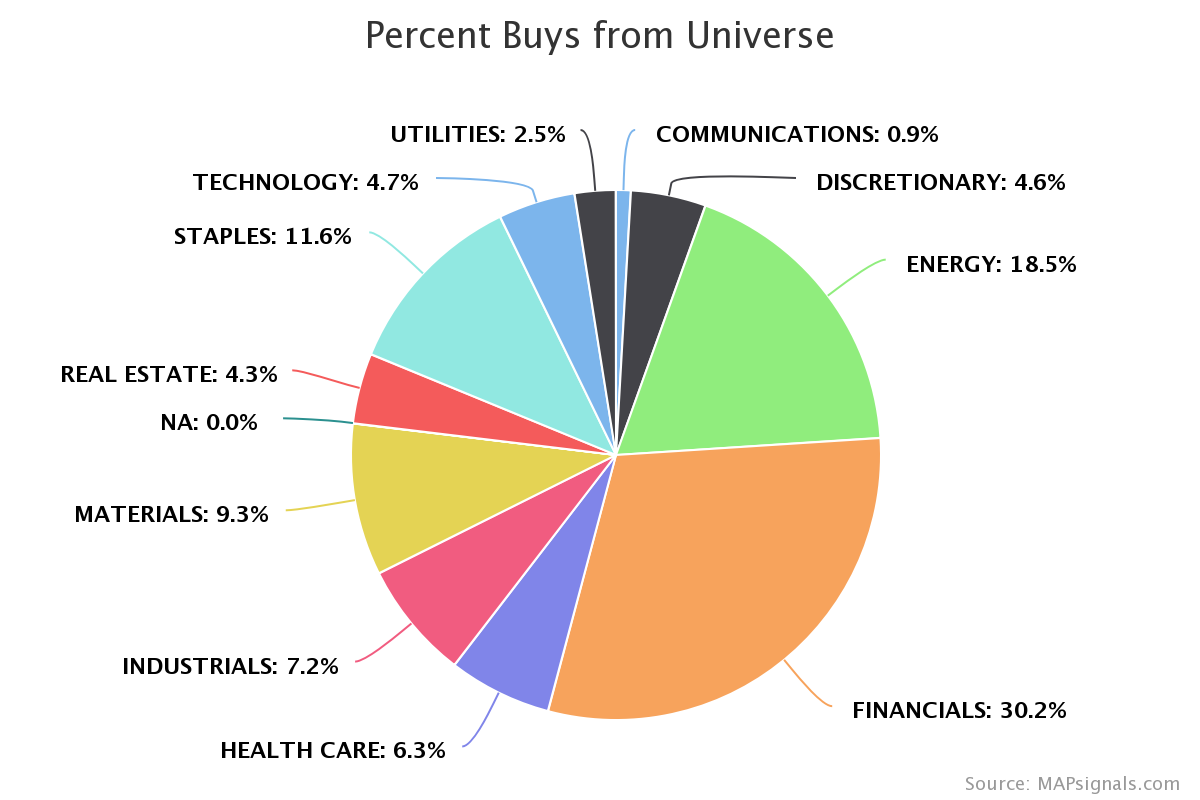
In a rising inflationary environment with rates and commodity prices soaring, this intuitively makes sense.

On the flipside, look at where the pain has been YTD. The massive stock selloff in January is concentrated in Healthcare and Technology shares.

Nearly 50% of all stocks sold were Healthcare and Technology stocks:

percent sells from universe | technology | healthcare

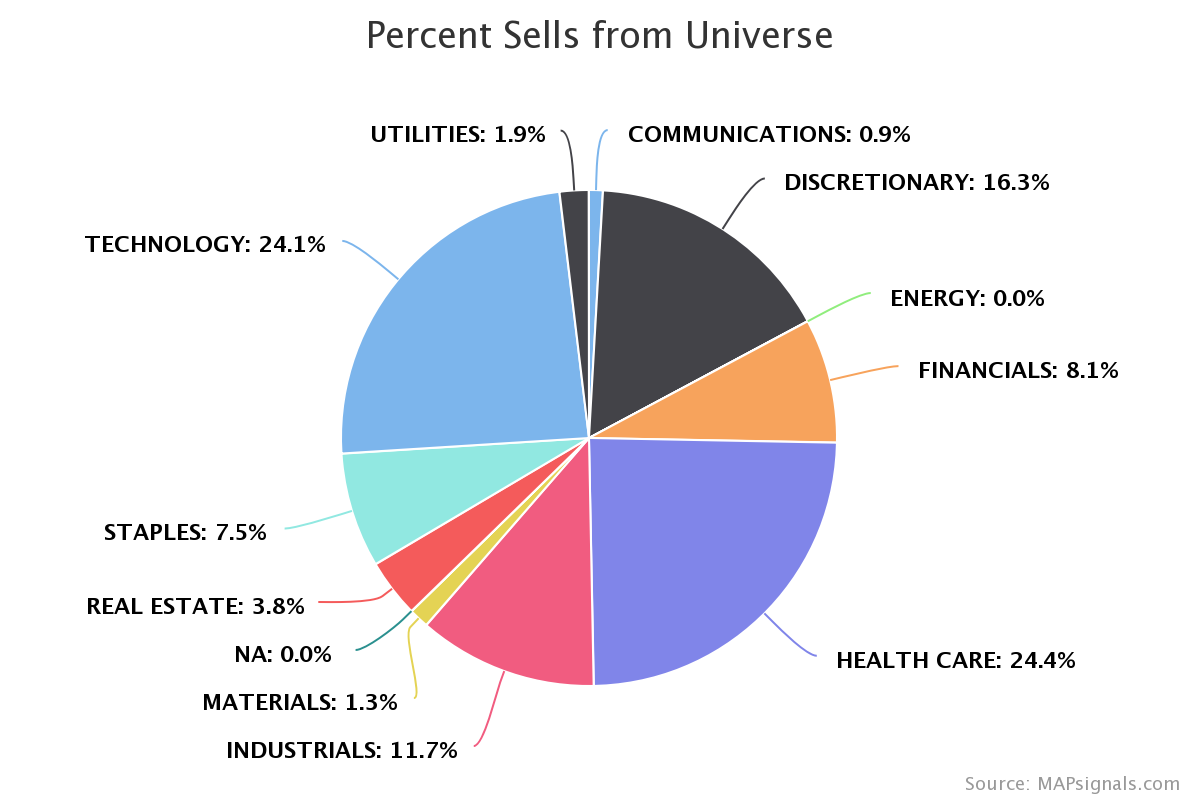
Rising rates creates rough waters for debt-ladened Healthcare groups like Biotech and hyper-growth areas like Technology.

So, should investors run for the hills? Should we freak out and rush for the exits like the crowd is doing right now? NO!

Believe it or not, some of the best opportunities arise during the depths of despair. Now let’s talk about that.

Focus On Great Stocks During Market Meltdowns

Look, the easy thing to do right now is to be fearful. I’ve found that it rarely pays off in the long-run to sell when stocks are in free-fall.

The hard thing to do is stay grounded. My bet is one day this pullback will be viewed as a massive long-term buying opportunity. Selling like this rarely lasts long. And you better believe that great companies are getting swept up in this meltdown.

Earnings season is just now getting started. Winners will emerge. Don’t give up.

Personally, I sat through many pullbacks: ’08 crisis, October 2014, August 2015, December 2018, & March 2020. Today it’s time to add the massive stock selloff in January 2022 to this list.

Sitting through each of these periods was painful. But you know what? Great stocks eventually rose to the top…and they will again. Odds are it’ll happen when people least expect it.

And some more good news – our latest portal enhancements now allow our platinum subscribers to see the actual stocks getting bought and sold each day, and their scores.

This is huge because one day selling will stop. Our data will flip. Buyers will rush into stocks again. This is the environment to prepare for that moment rather than buying into an end of days scenario.

That’s where my focus will be in the coming days and weeks.

To our members, if you missed my latest video update released late yesterday, check it out here. There is opportunity…hang in there!

Here’s the bottom line: We are in the midst of a massive stock selloff in January. ETFs saw the most selling since the pandemic lows. Looking at the charts today, selling of this magnitude rarely lasts.

Focus on quality. Selling will eventually pass. Here’s my question to you: Will you be ready?

***And if you want to get more awesome thoughts on this market, check out our latest video: Best Oversold Stocks To Buy Now 2022

When there’s lots of pain, I use our data to search for opportunity.

One video isn’t enough on a week like this. Just to show how there are pockets of stocks rallying, check out : Best Stocks Breaking Out Now 2022

I showcase 5 stocks rising right now.


Make sure to follow our YouTube channel here so you never miss any of our videos.

Also, you can find our other videos here.

Lucas Downey
Lucas Downey

Lucas is co-founder of MAPsignals. His full bio can be found here.
Prior to MAP, he was Head of ETF Sales at Cantor Fitzgerald & SVP of Derivatives at Jefferies, LLC.

Spread the word!

Category: All, Big Money Insights Weekly

Previous Post: «Best Stocks Rising Right Now Best Stocks Breaking Out Now 2022
Next Post: Which Sectors Perform Well When Rates Rise which sectors perform well when rates rise»

Reader Interactions

Comments

  1. Matthias

    January 20, 2022 at 10:58 am

    Hey guys,

    don’t know if I am the only one who noticed it, but your BMI was absolutely useless over the last year or so. There is absolutely no forecast. The BMI is either changing same time like the indexes or even later.

    Reply
    • MAPsignals Staff

      January 20, 2022 at 11:05 am

      Hey Matthias –

      It was a difficult market the past year in terms of the BMI. We tried to explain in today’s post why the BMI has not been as helpful recently. That’s because of the constant rotational market. The BMI was designed to alert us of extreme points with high correlation (meaning all sectors moving in unison). When there is high dispersion under the surface, the BMI will be trendless.

      But here’s the good news. Markets won’t always be in a constant rotation. The pandemic will eventually pass. The BMI has an incredible track record prior to this past year. Our belief is it’ll shine again.

      Reply
  2. James S.

    January 20, 2022 at 12:52 pm

    Just a technical comment about the pie chart you present. As I point out in my book on charts, the critical information in charts should be immediately perceived, While I’m not a fan of pie charts, it helps with the viewer if you stack the slices in order of their quantity. That way the viewer can immediately see the larger segments and the smaller segments without having to visually jump around the chart. Just a thought…..

    Reply
    • MAPsignals Staff

      January 20, 2022 at 12:58 pm

      That’s a great idea. We will let the developers know this!

      Reply
  3. Alan

    January 23, 2022 at 10:59 am

    Hi Luke

    Can you do a video on your portfolio creator tool in your portal? Maybe you can run a sample portfolio just to get an idea of the features.

    When we talk about a portfolio, how should I weight my individual stocks? Your MAP report is sent every week, so should I rebalance my portfolio every week? Should it be equal dollar or should the top stocks get more capital allocation?

    Overall, I am finding it difficult to align your report with my investment decisions.

    Reply
    • MAPsignals Staff

      January 23, 2022 at 11:26 am

      Hey Alan –

      Yes we can do a video discussing some of your questions. Expect a member video this week.

      Since the market has gotten extremely volatile lately, we want to make more videos on how to best navigate and approach everything.

      We spent time this weekend looking back at prior periods similar to now from a data standpoint. A lot of it is discussed in tonight’s Sunday MAP View report.

      Thanks for this feedback.

      Reply

Leave a Reply Cancel reply

Your email address will not be published. Required fields are marked *

Primary Sidebar

Get Big Money Insights for FREE

Want to know where the Big Money is headed?

Just enter your email address below. You'll get our FREE NEWSLETTER sent directly to your inbox.

We call it Big Money Insights... It’s your weekly sneak peek at the powerful market-moving forces that are hidden from 99% of investors.

"*" indicates required fields

This field is for validation purposes and should be left unchanged.

Categories

  • All
  • Big Money Insights Weekly
  • Big Money Series
  • Macro Insights
  • MAP In The Media
  • Members Only
  • Performance
  • Podcast
  • Special Reports
  • Stocks
  • Videos & Interviews
  • White Papers

Archives

  • February 2023
  • January 2023
  • December 2022
  • November 2022
  • October 2022
  • September 2022
  • August 2022
  • July 2022
  • June 2022
  • May 2022
  • April 2022
  • March 2022
  • February 2022
  • January 2022
  • December 2021
  • November 2021
  • October 2021
  • September 2021
  • August 2021
  • July 2021
  • June 2021
  • May 2021
  • April 2021
  • March 2021
  • February 2021
  • January 2021
  • December 2020
  • November 2020
  • October 2020
  • September 2020
  • August 2020
  • July 2020
  • June 2020
  • May 2020
  • April 2020
  • March 2020
  • February 2020
  • January 2020
  • December 2019
  • November 2019
  • October 2019
  • September 2019
  • August 2019
  • July 2019
  • June 2019
  • May 2019
  • April 2019
  • March 2019
  • February 2019
  • January 2019
  • December 2018
  • November 2018
  • October 2018
  • September 2018
  • August 2018

Follow us on Twitter

MAPsignals Follow 1,449 1,070

MAPsignals is a data platform that tracks institutional money flows in stocks and ETFs. Sign up for free insights here: https://t.co/SaAVHjKC9J

mapsignals
mapsignals avatar; MAPsignals @mapsignals ·
13h 1622987016957820928

One of my favorite #dividend #stocks having a day - Skyworks Solutions $SWKS - owned it for years

The $2B buyback is pretty significant given the market cap is sub $19B

#Semiconductors continue to see major inflows

Reply on Twitter 1622987016957820928 Retweet on Twitter 1622987016957820928 0 Like on Twitter 1622987016957820928 2 Twitter 1622987016957820928
Load More...

Footer

© 2021 Mapsignals.com

  • Home
  • Contact & Disclaimer
  • Privacy Policy
  • Terms & Conditions
  • Opt-out preferences
  • FAQ

Copyright © 2023 · Mai Law Pro on Genesis Framework · WordPress · Log in

✕
What Happened to Risk Assets White Paper is Here

Get your copy here and take a journey through our thoughts on margin and leverage.

Enter your email address below and you'll get our FREE NEWSLETTER sent directly to your inbox. 

 We call it Big Money Insights... It’s your weekly sneak peek at the powerful market-moving forces that are hidden from 99% of investors.