• Menu
  • Skip to right header navigation
  • Skip to main content
  • Skip to primary sidebar
  • Skip to footer

MAPsignals

We map big money.

  • Latest Insights
  • Power of MAP
    • MAP Products
    • MAP System
    • MAP White Papers
    • Videos & Interviews
  • Profit with MAP
  • About
    • About MAP
    • MAP Team
    • Authors
    • MAP System
    • MAP Products
    • Big Money Index
  • Members
    • Get Started With MAP
    • My MAP
    • Big Money Charts
    • MAP View
    • MAP View Options
    • MAP Top 20 Weekly
    • MAP 50
    • Member Updates
    • Platinum Updates
    • Members Only Posts
    • Performance
  • Portal

Money Is Flowing Into Stocks

August 11, 2022 //  by Lucas Downey//  Leave a Comment

Markets tend to move from one extreme to another.

After a brutal start to 2022, bulls are finally in the driver’s seat. Money is flowing into stocks.

Money is Flowing Into Stocks

The last few weeks have seen stocks reprice in dramatic fashion. Since our oversold signal flashed on July 14th, the S&P 500 has gained 11.08%. In those 4 short weeks, markets were given the green light as capitulation selling ground to a halt.

Add in yesterday’s CPI print, which showed inflation came in cooler than expected, and you have a playbook for money managers to add risk… especially those on the sidelines waiting on a positive macro development.

For weeks money’s been put to work in dramatic fashion.

So, you may be wondering if this massive shift to risk-on post oversold is a fluke or normal. Today we’ll look at prior oversold periods and calculate how long it takes for markets to reach overbought territory. Believe it or not, extreme selloffs often preface rapid climbs in stocks.

But first, let’s check in on the one-way action of Big Money flows. The bull train has left the station.

Money Is Flowing Into Stocks

As noted last week, signs of a new bull market were forming. Our most popular indicator, the Big Money Index, has exploded higher. It’s now breaking above 70% as money is flowing into stocks.

In fact, this latest lift has pushed the BMI to YTD highs. We could be weeks away from reaching the red overbought area of 80%. Check it out:

BMI is at YTD highs as money is finally being put to work across the board | Big Money Index

This massive pendulum swung from a 25% reading (green line) to today’s 71% is massive. But get this, steep moves higher in the BMI are natural after bear market pivot points. When the crowd is positioned one way (short), a stampede higher can ensue… and often does.

To prove this, let’s look at recent prior oversold periods pre-2022. You all remember the Pandemic market crash. Our BMI went oversold on March 19th, 2020, and the rally started days later. The BMI went overbought in less than 2 months:

Pandemic oversold signal led to explosive rally and quick overbought conditions | Big Money Index

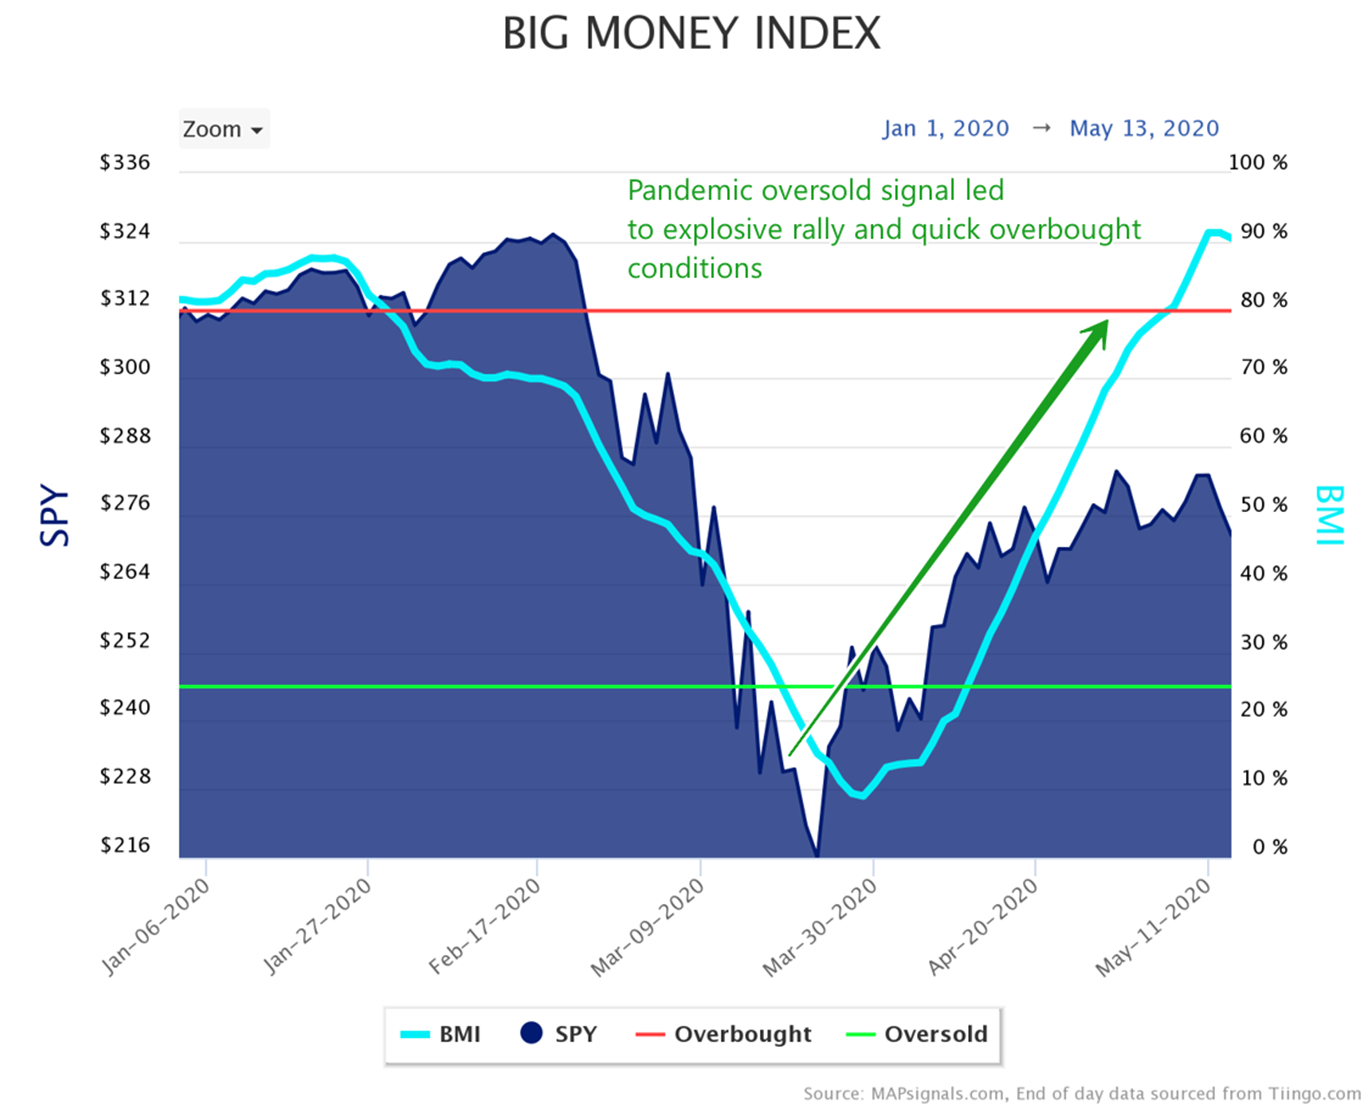
An oversold BMI often explodes out of oversold conditions like a coiled spring being released. Intuitively that makes sense. As most market participants are underweight stocks during crashes, demand eventually returns prefacing a wicked rally.

That’s how the stock market works.

Let’s keep going. In Q4 of 2018, the BMI reached oversold twice… eerily similar to today’s market environment.

Below you’ll notice how we breached oversold in October and had a swift near-term rally, but then it failed. The 2nd oversold reading hit on Christmas Eve.

Christmas 2018 came right on time for the stock market. Conditions became overbought nearly 6 weeks later:

2 oversold periods in Q4 2018 | Big Money Index

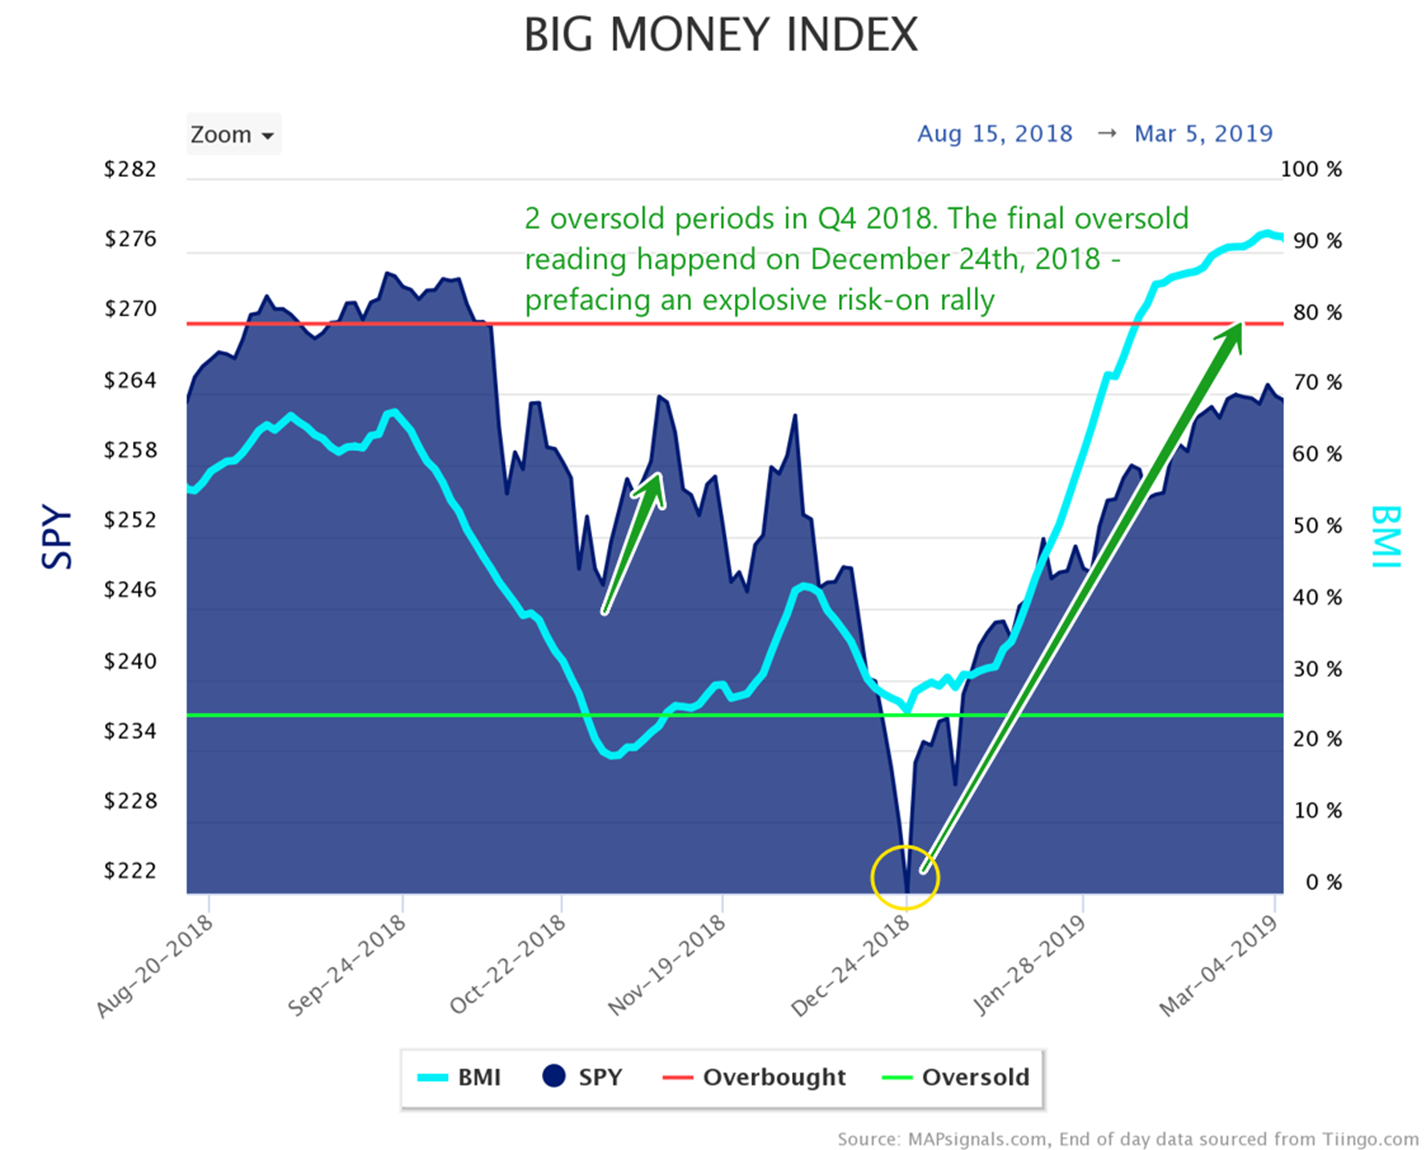
This is another case in point where extreme down-moves often trigger explosive up-moves.

Let’s do another example. In early 2016, stocks were creamed sending the BMI into the rare green zone. Just 6 weeks later markets were overbought:

Oversold conditions prefaced a monster rally within weeks | Big Money Index

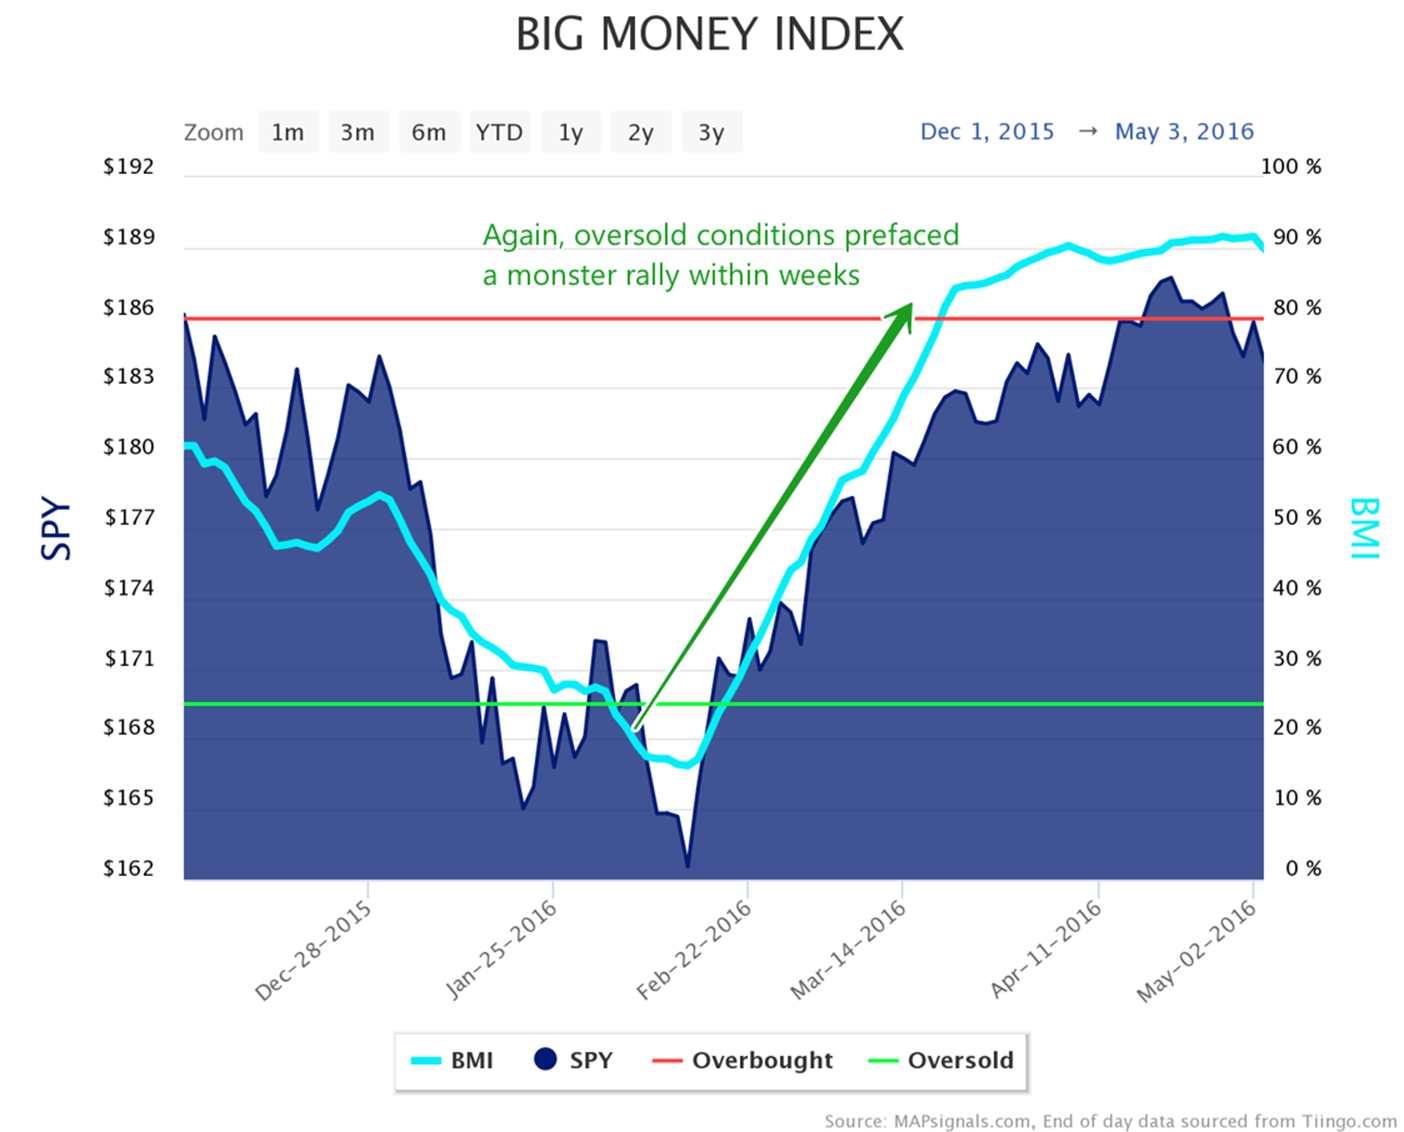
Clearly money flows flipped, and fast! The window of opportunity can close quickly. That’s exactly what’s going on right now. Extreme bearishness and positioning created quite a bullish setup.

But let’s drive home the point one last time. I went back and isolated all 22 oversold periods going back to 1990. I calculated how long it took on average for an oversold market to become overbought. I was surprised at the findings.

Check it out. Below, started from left to right you’ll see the first day the BMI hit oversold. The next column lists the first day the BMI reached overbought post an oversold reading. Next, you’ll see how many days and months it took for each oversold period to flip to overbought. Finally, off to the right details the return of the S&P 500 throughout each period:

How long does it take for oversold markets to reach overbought

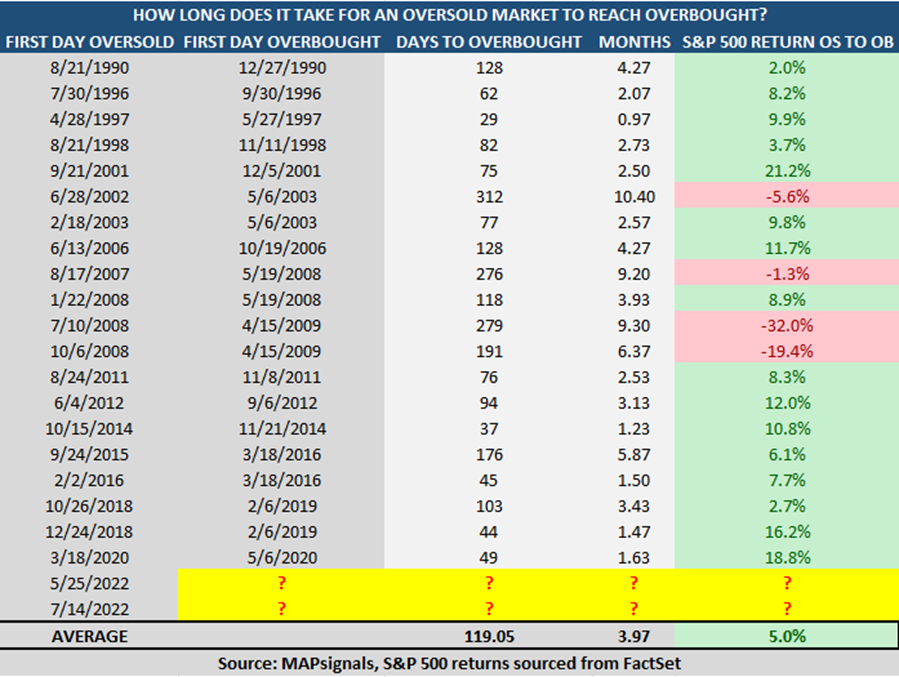
Based on 20 oversold instances, it takes nearly 4 months for the market to become overbought. Also, the market tends to gain 5% on average during those periods.

But I want to point something out. Half of all oversold instances took less than 3 months to reach overbought. So, be careful getting too bearish for too long.

While the BMI is rising like a phoenix from the ashes right now, it’s behaving in-line with history. Money is flowing into stocks. And it’s completely expected!

Let’s wrap up.

Here’s the bottom line: The latest rally isn’t surprising based on history. Oversold conditions often preface monster rallies – many times within a few months.

Equities are being accumulated. Money is flowing into stocks. It’s not popular, but the odds were stacked in the bulls’ favor for many weeks.

Data has a way of cutting through the noise.

When the macro is hard to follow, trust in data.

***Finally, our buy lists are full of growth stocks getting accumulated. If you’re a stock picker or a professional looking for unique data insights, consider a MAPsignals subscription today. Analyze and become a better investor.

Lucas Downey
Lucas Downey

Lucas is co-founder of MAPsignals. His full bio can be found here.
Prior to MAP, he was Head of ETF Sales at Cantor Fitzgerald & SVP of Derivatives at Jefferies, LLC.

Spread the word!

Category: All, Big Money Insights Weekly

Previous Post: «Best Discretionary Stocks to Buy for August 2022 Best Discretionary Stocks to Buy for August 2022
Next Post: The MoneyShow in Orlando – Jason Bodner Finding the Biggest Stocks for 2023»

Reader Interactions

Leave a Reply Cancel reply

Your email address will not be published. Required fields are marked *

Primary Sidebar

Get Big Money Insights for FREE

Want to know where the Big Money is headed?

Just enter your email address below. You'll get our FREE NEWSLETTER sent directly to your inbox.

We call it Big Money Insights... It’s your weekly sneak peek at the powerful market-moving forces that are hidden from 99% of investors.

"*" indicates required fields

This field is for validation purposes and should be left unchanged.

Categories

  • All
  • Big Money Insights Weekly
  • Big Money Series
  • Macro Insights
  • MAP In The Media
  • Members Only
  • Performance
  • Podcast
  • Special Reports
  • Stocks
  • Videos & Interviews
  • White Papers

Archives

  • February 2023
  • January 2023
  • December 2022
  • November 2022
  • October 2022
  • September 2022
  • August 2022
  • July 2022
  • June 2022
  • May 2022
  • April 2022
  • March 2022
  • February 2022
  • January 2022
  • December 2021
  • November 2021
  • October 2021
  • September 2021
  • August 2021
  • July 2021
  • June 2021
  • May 2021
  • April 2021
  • March 2021
  • February 2021
  • January 2021
  • December 2020
  • November 2020
  • October 2020
  • September 2020
  • August 2020
  • July 2020
  • June 2020
  • May 2020
  • April 2020
  • March 2020
  • February 2020
  • January 2020
  • December 2019
  • November 2019
  • October 2019
  • September 2019
  • August 2019
  • July 2019
  • June 2019
  • May 2019
  • April 2019
  • March 2019
  • February 2019
  • January 2019
  • December 2018
  • November 2018
  • October 2018
  • September 2018
  • August 2018

Follow us on Twitter

MAPsignals Follow 1,449 1,070

MAPsignals is a data platform that tracks institutional money flows in stocks and ETFs. Sign up for free insights here: https://t.co/SaAVHjKC9J

mapsignals
mapsignals avatar; MAPsignals @mapsignals ·
19h 1622987016957820928

One of my favorite #dividend #stocks having a day - Skyworks Solutions $SWKS - owned it for years

The $2B buyback is pretty significant given the market cap is sub $19B

#Semiconductors continue to see major inflows

Reply on Twitter 1622987016957820928 Retweet on Twitter 1622987016957820928 0 Like on Twitter 1622987016957820928 2 Twitter 1622987016957820928
Load More...

Footer

© 2021 Mapsignals.com

  • Home
  • Contact & Disclaimer
  • Privacy Policy
  • Terms & Conditions
  • Opt-out preferences
  • FAQ

Copyright © 2023 · Mai Law Pro on Genesis Framework · WordPress · Log in

✕
What Happened to Risk Assets White Paper is Here

Get your copy here and take a journey through our thoughts on margin and leverage.

Enter your email address below and you'll get our FREE NEWSLETTER sent directly to your inbox. 

 We call it Big Money Insights... It’s your weekly sneak peek at the powerful market-moving forces that are hidden from 99% of investors.