
Never Sell Outlier Stocks
Stocks go up. Stocks go down.
Outlier stocks do too, but they make investors rich. That’s why we say: never sell outlier stocks.
To reinforce this, we’re showcasing our weekly stock pick performance going back to 2018. Full warning: if you’re allergic to juice – look away!
But, before we do our victory lap, let’s check in on the market.
Many investors worry about all kinds of things right now: high inflation, rising interest rates, and the Chinese crackdown on cryptocurrencies.
Many studies show that excessive worrying can lead to high anxiety, which can trigger physical illness.
So, while those headlines are legitimate concerns, stop worrying. It’s not good for you. And the simple fact is our data continues to clearly say: stay long.
Big Money Index Says To Stay Bullish
It’s summertime. That means trading volumes are lighter as Wall Streeters take vacations.
This quiet action can also be seen in the Big Money Index:
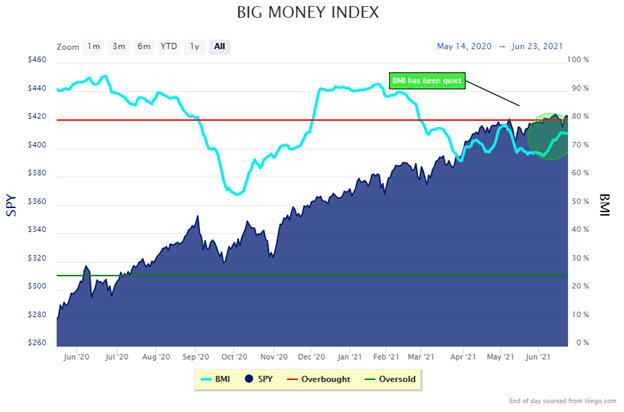
As you see, the BMI is hovering right near 75%. Above 80% is overbought…i.e. the red line. Right now, we’re not expecting to break into the red zone for another couple of weeks. And even when we do, we can stay overbought for quite a while.
For us that means stay bullish. But, let’s take a deeper dive in the data because last Friday’s price action freaked investors out.
Friday’s selloff was big. In fact, it was the single largest selling day in our data since October 28th, 2020.
Below you can see how nasty the selloff really was from a data standpoint in our Big Money Stock Buys & Sells chart:
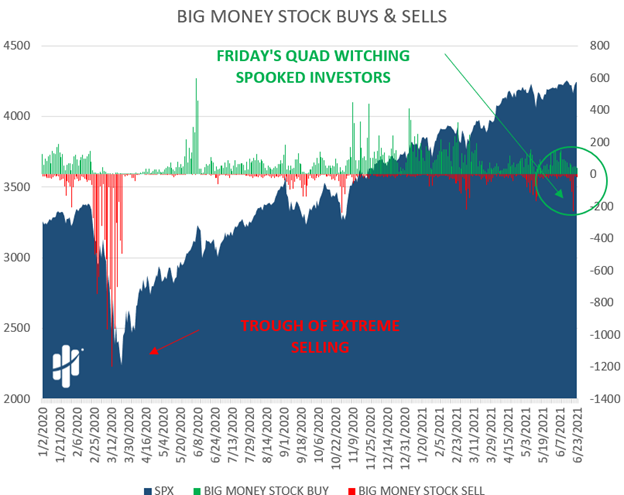
But, as ugly as that red day was, we didn’t change our bullish tune. Here’s why.
Friday was quadruple witching, which means 4 expirations happened for markets: stock options, stock index futures, stock index options, and single stock futures. These days are always huge volume days.
So why were we still bullish through that mess?
We looked back at how markets perform on quad witching days. Since 2015, the S&P 500 (SPY ETF) is almost always red – 88% of the time:
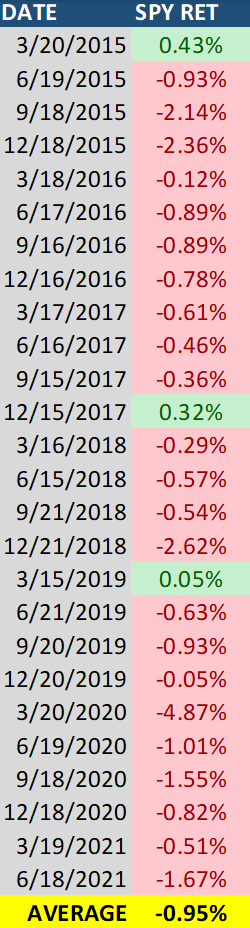
Looking through this lens, Friday’s action was totally normal. So, to us, it says ignore the event as it was expected.
Casting out the one day of selling, chalking it up to quad witching, allows us to take in the bigger picture. Buying is on the upswing, growth is returning to favor, and the BMI is trending higher. That means we stay bullish.
Focusing on the day-by-day action in markets will make your head spin anyway.
We prefer to follow the Big Money for the market’s next moves. As we’ve been highlighting for weeks, growth stocks are ramping. And that’s incredibly bullish.
Eventually the data will change – it always does. But that’s not today – so stop worrying- it’s bad for you.
Now for the fun part!
Remember earlier when I told you we never sell outlier stocks? I’ll show you why.
Never Sell Outlier Stocks
Each week in our research, we highlight one stock. They come from our awesome Top 20 list.
These are the stocks with great fundamentals getting bought by Big Money. They’re the stocks that have growing sales, earnings, and profits. Those are hallmark traits of outlier stocks.
This morning I went back to see how our weekly picks have done versus the S&P 500 (SPY ETF). The results screamed: “never seller outlier stocks!”
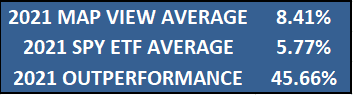
Let’s begin with 2021. Markets, on fire like now, are hard to beat. But did our weekly stocks beat the market?
YUP.
Here we see the average performance of each weekly stock pick held until yesterday’s close compared with buying the SPY ETF over the same period.
Our stocks beat the SPY by an average of 45%!
But maybe we just got lucky- right? Well, let’s do this same process for 2020 which of course includes the worst stock crash in recent memory. Below is the average performance of each weekly stock pick in 2020, held until yesterday’s close:
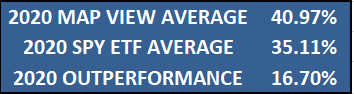
Still solid!
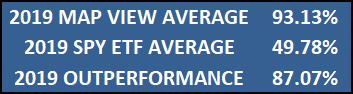
Here’s where it gets interesting. Outlier stocks can make monster gains. Let’s keep going back to 2019 and 2018. Remember, the performance is as if you held until yesterday’s close.
Here’s 2019:
Here’s 2018:
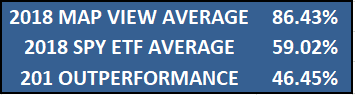
Those are some sick performance stats: crushing the S&P 500 4 years in a row.
Now I realize that holding so many stocks for such a long period may not be practical for most investors. But it does clearly demonstrate our mantra: never sell outlier stocks!
Let’s bring this all home.
Here’s the bottom line: Our data tells us stocks have further upside. That’s great news. But the bigger message is what outlier stocks can do for your portfolio. You only need a few to make a huge impact on performance.
Look, it’s important to know what’s going on with current events and the market. We’re in extreme times. But, worrying about it leads to health issues.
And our solution to worry is to just relax with some outlier stocks. That’s because it’s hard to beat outliers over the long-term.
History proves it. And we’re on a mission to bring them to our readers.
While we can never give personalized advice, I’ll tell you what we learned a long time ago. We never sell outlier stocks. And after looking above, we’re glad we held!
And as a bonus, our latest video is out: Best ETFs for July 2021. If you want to learn more about our process, watch Jason in action!