
Your Sell Signal to Take Profits
We’re witnessing an epic rally. The crowd is stunned.
If you’re wondering when stocks will pullback, our data has clues. Today I’ll cover your sell signal to take profits.
This morning our data did something we haven’t seen since December 2020. Our Big Money Index broke into overbought territory. The wave of stock buying has been intense, unlike anything we’ve seen in 20 months.
In 2022, markets are shifting from one extreme to the other in epic fashion. Just 5 weeks ago the BMI reached a rare oversold signal. Now, the pendulum has swung the other way – the first signs of overbought conditions.
The million-dollar question on my mind is this: Is it time to sell and run for the hills? Based on history – not yet.
From a data standpoint, prior periods similar to now favor higher market prices in the months ahead.
But if you’re wondering when’s a good time to reduce risk, I’ve got you covered. There’s a setup to heed that often precedes market falls. MAPsignals will earn its stripes today with this study! If you’re looking for your sell signal to take profits, listen up!
Big Money Index Reaches Overbought
Let’s first check in on the Big Money Index. It’s finally broken through the red zone and sits at 80% today. That means 8 out of 10 big volume signals the last 5 weeks were on the buy-side. That’s reaching extreme levels.
Below you can see what I mean. This latest climb in the BMI comes right off the heels of being oversold just 5 weeks ago:
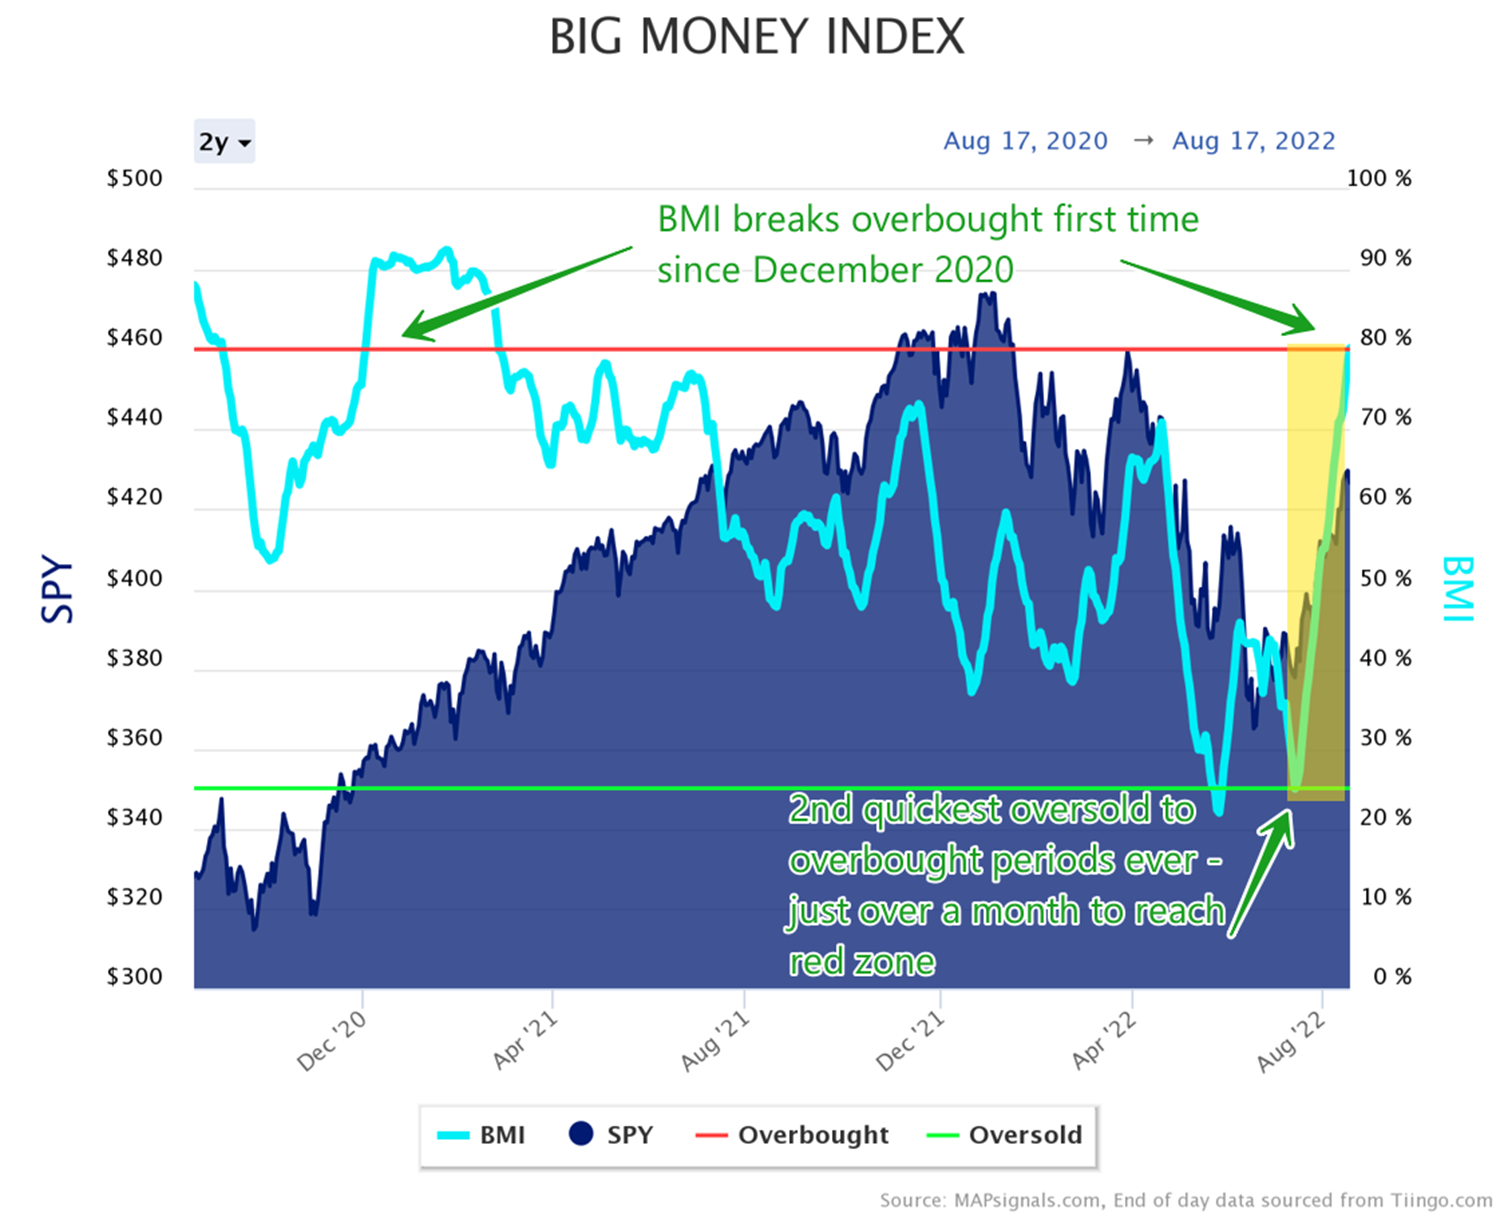
We went from oversold to overbought in record time, 5 weeks or 34 days. Only in 1997 did the BMI reach this feat quicker (29 days). Believe it or not, how quickly the BMI reaches overbought post an oversold signal is important to forward market returns.
Last week, I discussed how 4 months is the average time it takes for an oversold market to reach overbought. Today’s instance took just a tad over a month to trigger, well short of the average.
The velocity of buying has been relentless, indicating that money managers are underweight equities and need to play catchup by buying stocks. That consistent demand can keep stocks buoyant for weeks and months.
Importantly, we’ve seen similar action like this in the past and it’s not a big bear signal.
I went back in our data and pulled all 22 oversold instances since 1990. Next, I singled out all periods when the Big Money Index triggered overbought less than 3 months later. Essentially, I only wanted to study overbought instances with similar velocity to now.
There’ve been 11 instances with at least a year of returns to calculate. As you can see below, the forward returns for the S&P 500 after a violent overbought signal is very bullish. Three months later, stocks are up on average 5.75%. A year later, they’re up a massive 17.92%:
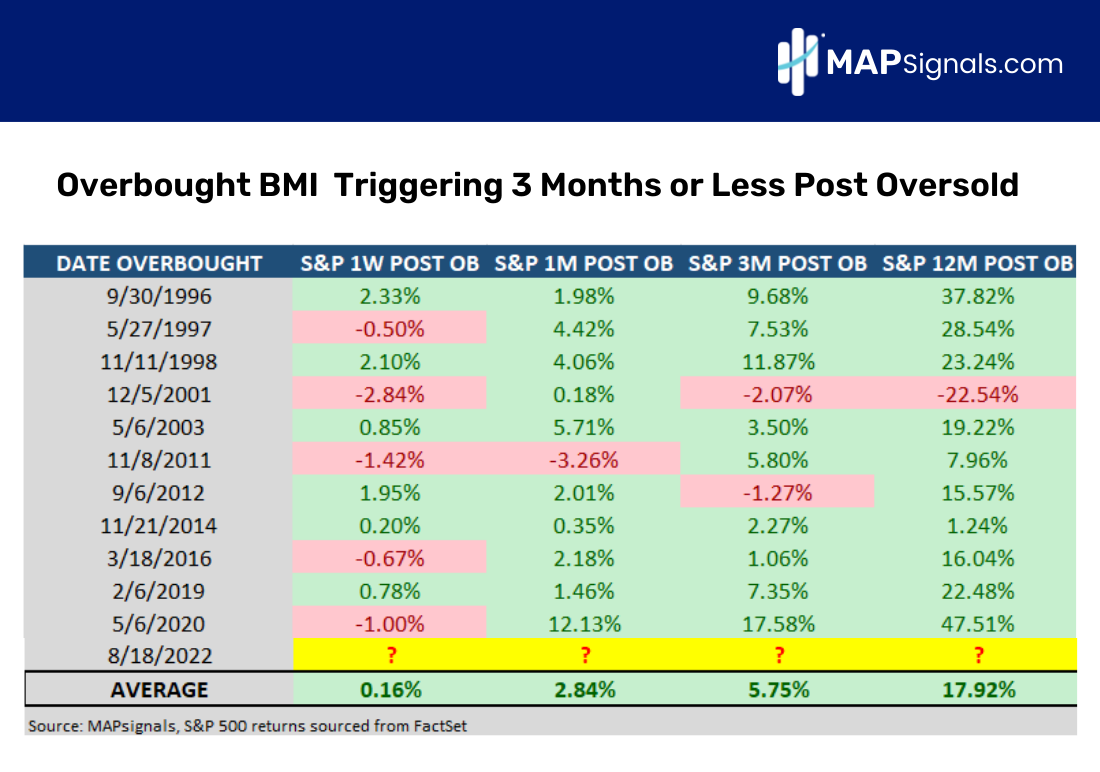
Only once were stocks negative a year later: 2001.
Based on history, the latest overbought signal is uber bullish over the medium to long-term. The quick shift from oversold to overbought conditions behaves like a reset button for a new bull market.
The bottom line is this: Be careful getting too bearish. Odds are that stocks will be a lot higher a year from now.
But we all know stocks don’t go up in a straight line. Eventually all rallies take a breather.
If you’re a short-term trader, I found a reliable datapoint that signals pain ahead for stocks. Let me walk you through your sell signal to take profits along the way.
Your Sell Signal to Take Profits
Overbought markets can last for months, especially those that come on quickly like the one we’re in. So, when’s a good time to reduce risk?
This week I studied different BMI levels for clues. When markets are overbought, picking a peak BMI level didn’t result in a great sell signal. Intuitively that makes sense given that some bull markets can last longer than you’d imagine.
The Pandemic rally beginning April 2020 comes to mind!
Next, I began to study falling BMI levels. That’s where pullback setups emerged.
As a reminder, a falling BMI indicates that buying is slowing and selling is growing. Which is the perfect environment for a pullback.
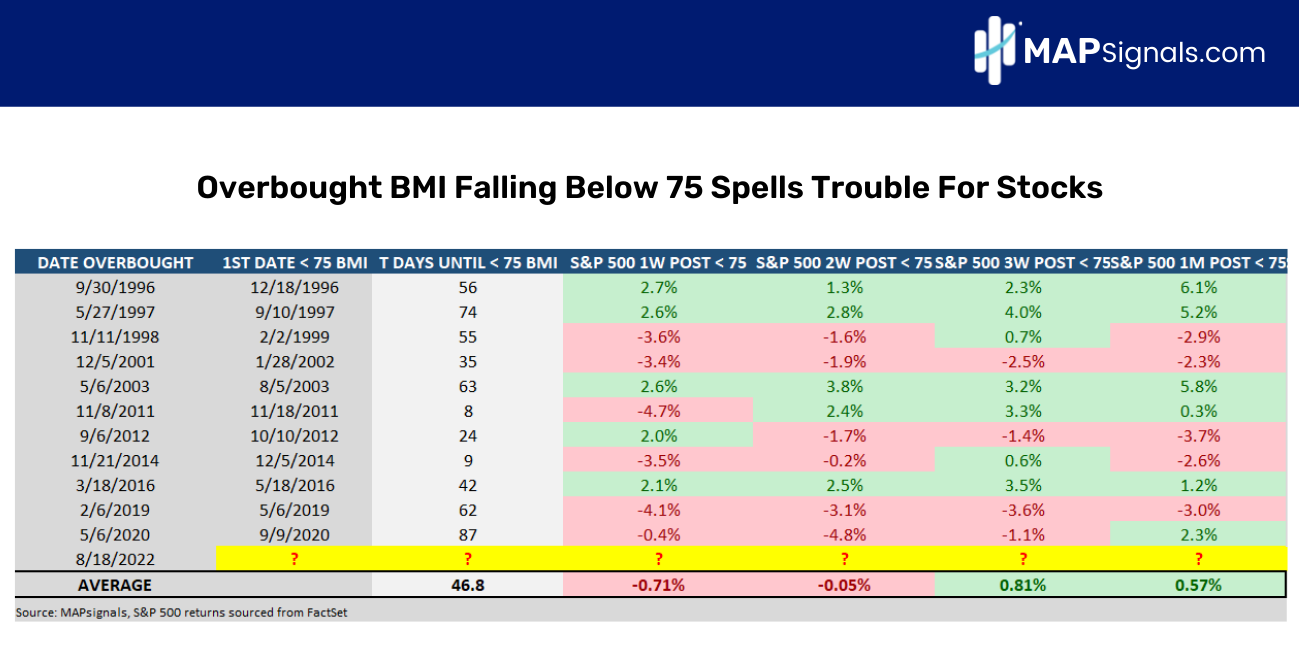
Get this, of the prior 11 similar overbought instances, when the BMI falls below 75%, it spells trouble for stocks. Check it out.
The below graphic beginning from left to right lists all 11 similar overbought triggers, the first date the BMI fell below 75%, and how many trading days that took. On average, it takes 46 trading days for the BMI to break below 75%. That’s nearly 2 months of elevated stock prices.
But the right half of the image is what’s important. After breaking 75%, the S&P 500 is down .71% a week later on average. Two weeks later, stocks are still negative:
Now, a fall of .71% in a week may not seem like a big sell signal, but stay with me. Once you review the charts, you’ll notice a very volatile picture emerging.
Let’s check in on the first 4 periods from 1996 – 2002. I’ve circled the areas where the BMI fell out of overbought on its way to 75%. I also drew arrows pointing to the market. It’s basically chop city once the BMI falls out of overbought:
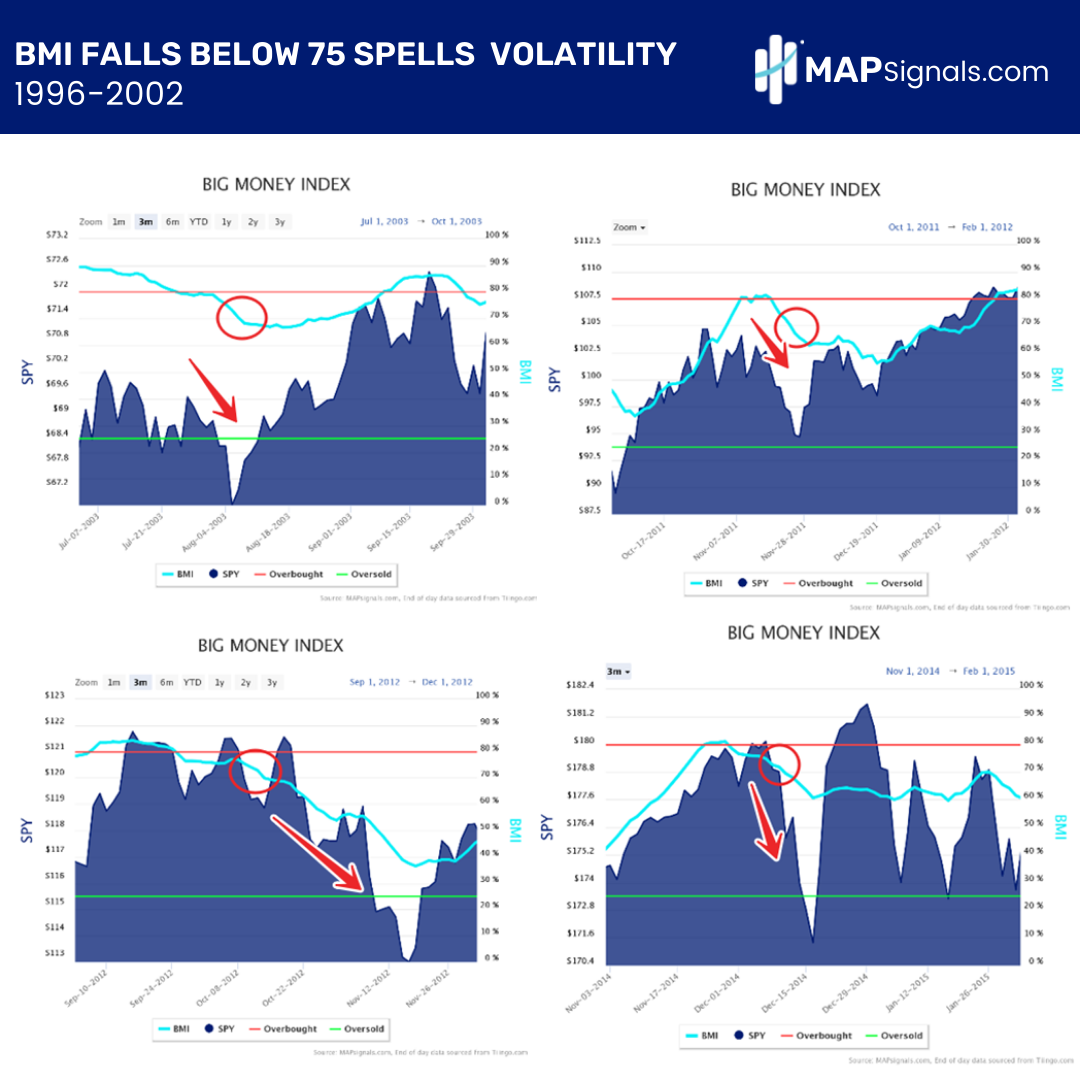
A falling BMI spells trouble for stocks.
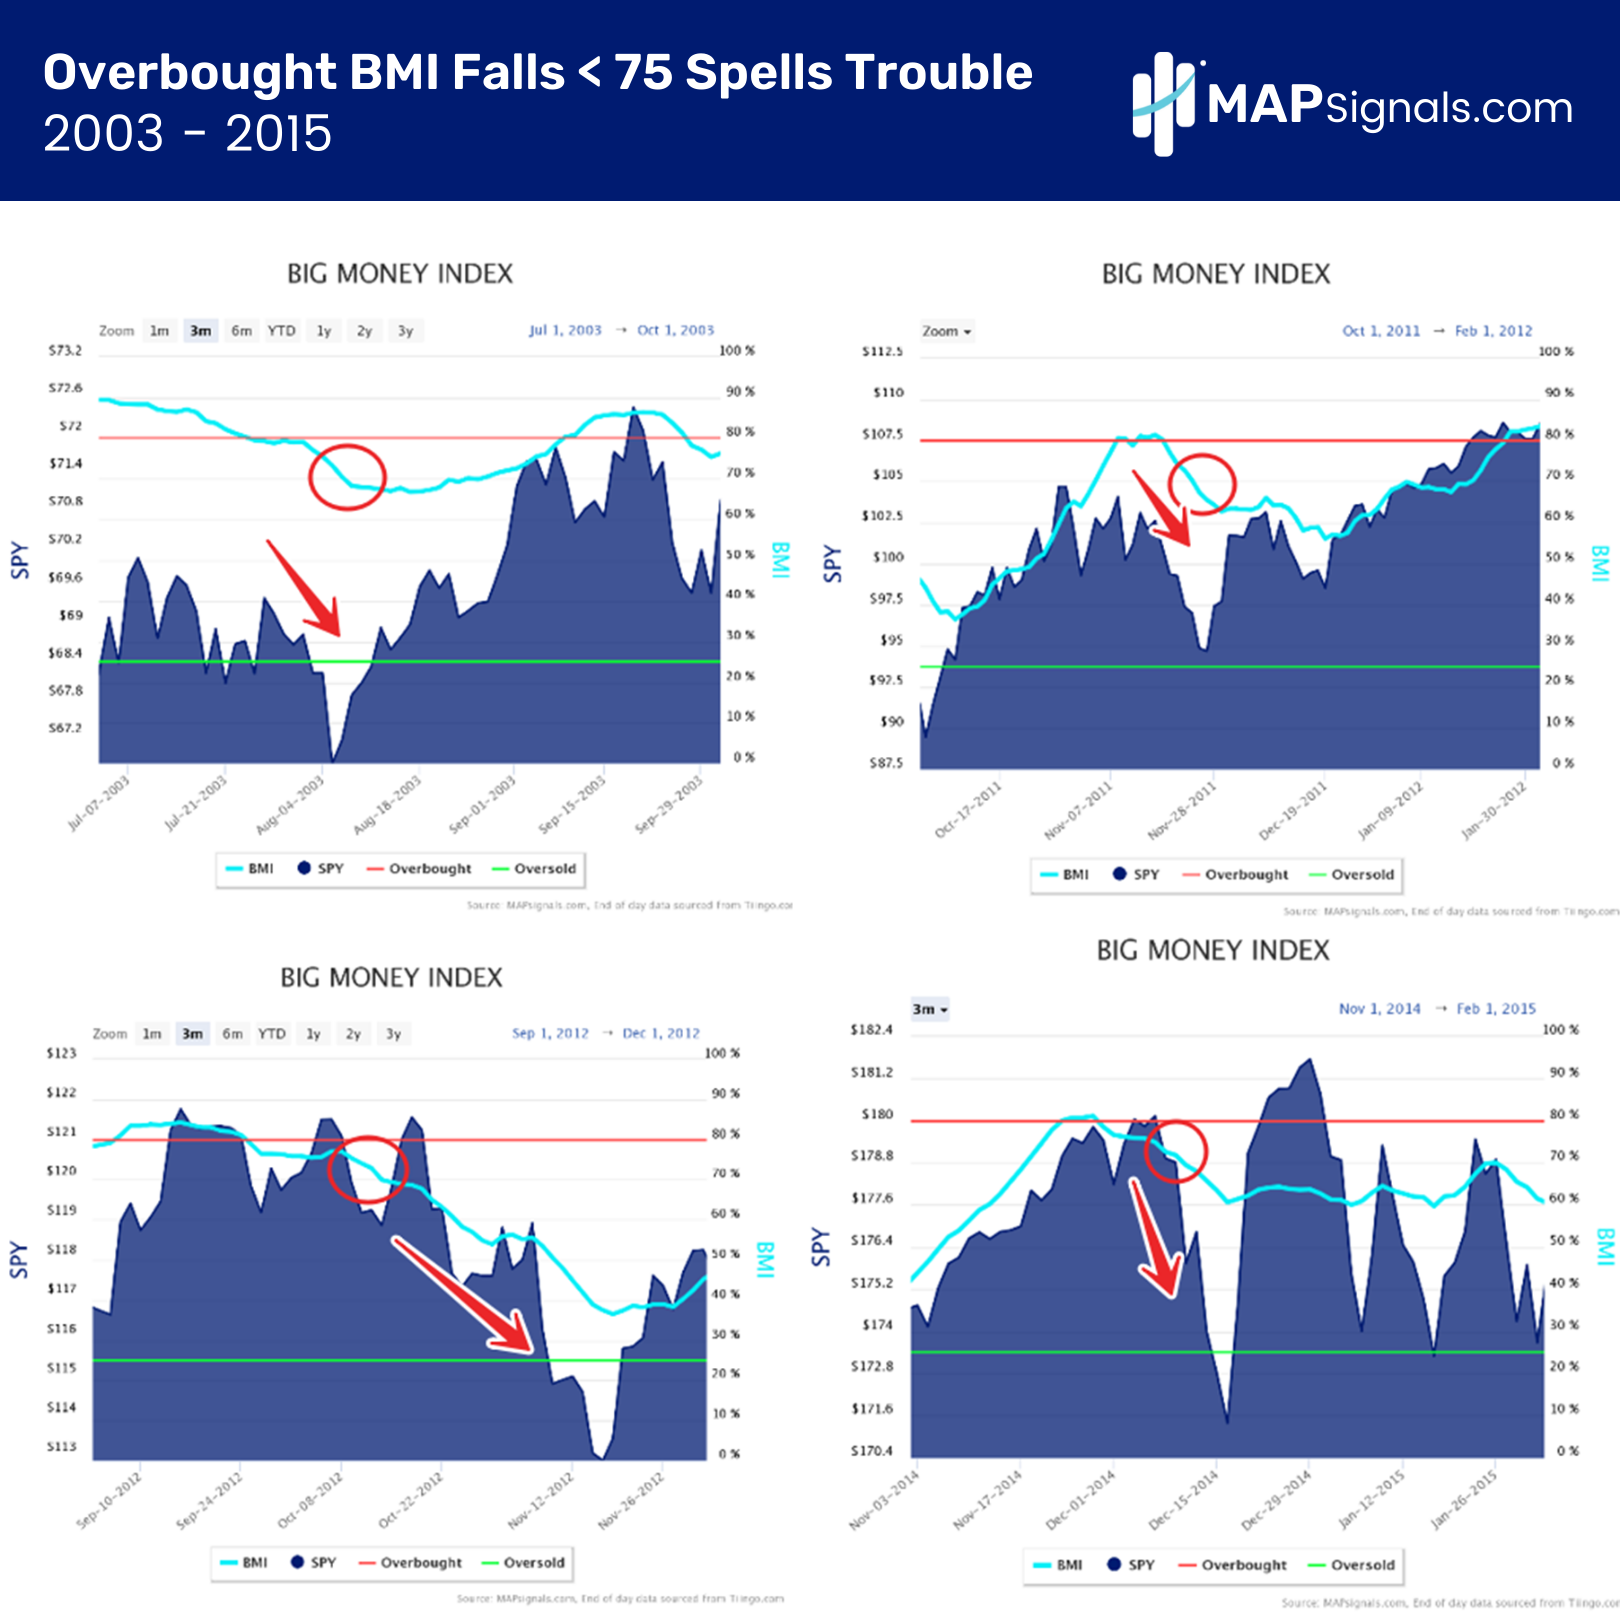
Let’s now view 4 instances from 2003 – 2015. The same pattern emerges. Falling out of overbought often leads to serious pullbacks in markets:
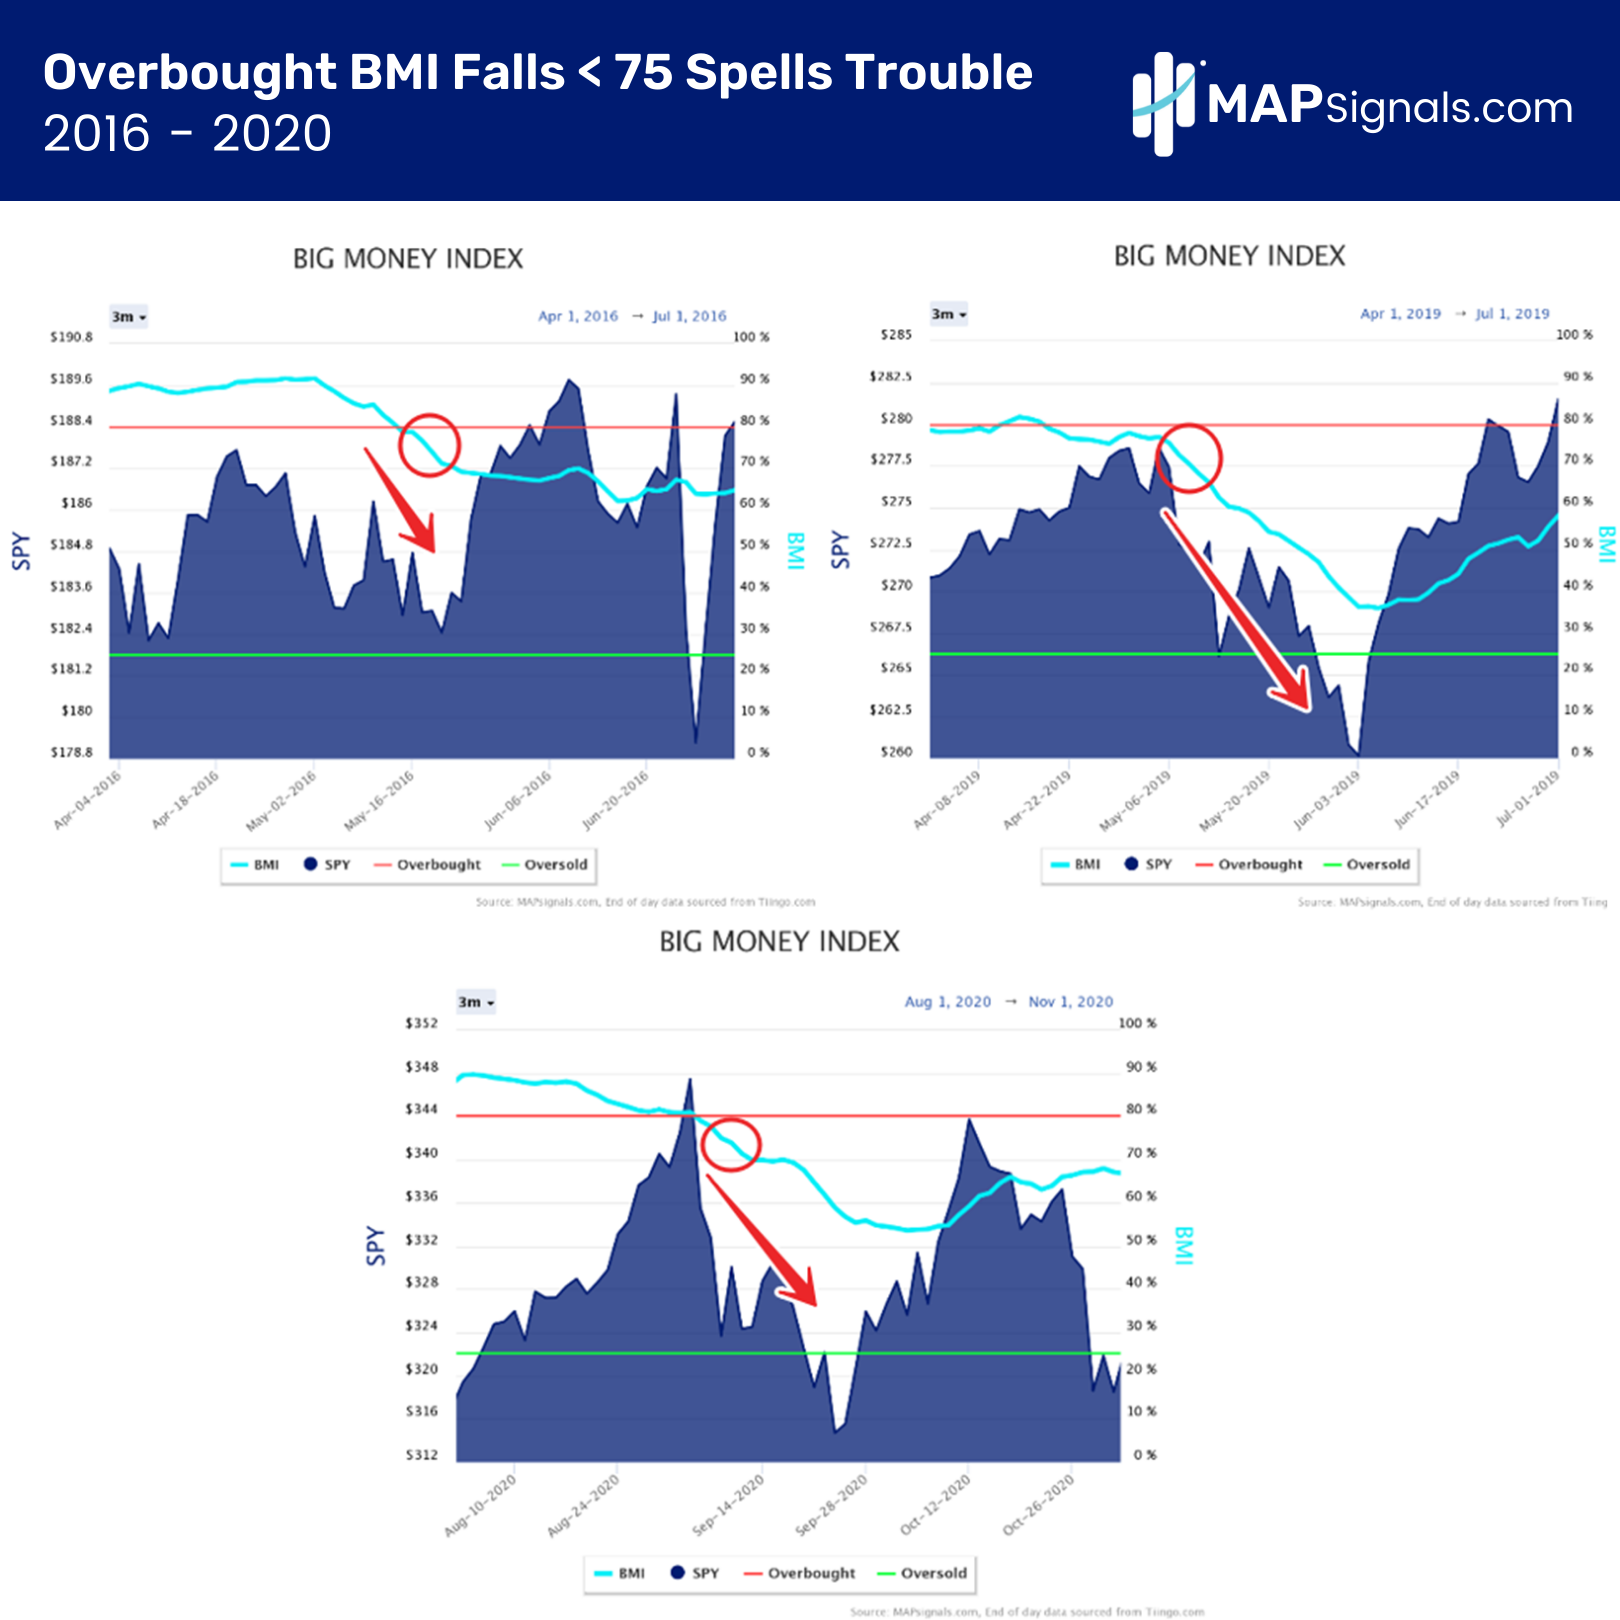
Finally, we have 3 periods from 2016 – 2020 to study. Yes, a falling BMI can preface monster pullbacks:
No question about it, the trend of unusual volumes matters. When buyers vanish and sellers increases, that’s a signal to look out below! Looking at history, a BMI falling below 75% can be your sell signal to take profits.
Whether that comes next week or next month – pay attention. It’s a datapoint that screams all isn’t well under the surface of the market.
Let’s wrap up.
Here’s the bottom line: The Big Money Index is finally overbought. It’s been nearly 2 years since we’ve broken into the red zone.
Right now, the velocity of buying is extreme, which tends to preface more upside if you’re an investor. Prior similar overbought readings led to markets rallying 17.92% a year later.
But we know pullbacks are part of the game. History has shown to take heed once the BMI begins to fall. A break below 75% usually spells trouble for stocks. It can be your sell signal to take profits!
It pays to Follow the Big Money!
Lastly, if you’re not following the Big Money Index and our other indicators daily in our automated portal, you’re missing out. Get started with a MAPsignals subscription today. Let data help your investing decisions!