
Reaching a Critical Market Juncture
Q: Where do markets go from here?
A: It’s all relative.
Pessimists see overbought conditions. Optimists view the strong performance year-to-date as reason to celebrate.
Depending on your stance, it’s undeniable that we’re reaching a critical market juncture.
Consider this, back in 1929, a New York Times article discussed Albert Einstein’s theory of relativity. To get the complex idea across, the reporter described it this way:
Put your hand on a hot stove for a minute, and it seems like an hour. Sit with a pretty girl for an hour, and it seems like a minute. That’s relativity.
It’s all about perspective! What seems like forever to one person can feel only momentary to another.
There’s no better place to see this common dichotomy than in the stock market.
On the one hand, the near-term technical backdrop is heavily overbought. Historical analysis suggests we’re due for a healthy pullback.
On the other hand, kicking off January in the green tends to foreshadow big annual gains.
Here’s the reality: Both assessments offer truth.
What’s important is how you handle the situation in the weeks and months ahead.
Today, we’re going to look at 2 awesome historical studies. The first will please the near-term cautious. The second will invigorate the bulls.
Regardless of which camp you live in, you’re going to want to understand both viewpoints.
Reaching a Critical Market Juncture
I get asked all the time, when will stocks pullback? The true answer is no one knows. Markets are going to behave the way they’re going to behave. Period.
That said, data has a way of illuminating the unknown. Our Big Money Index (BMI), which measures the rate of buying and selling in stocks, is signaling heavily overbought conditions.
There are 2 considerations to mention:
- 1. We’ve been in the red zone for 32 trading days, much longer than in recent history
- 2. The BMI is close to falling out of overbought
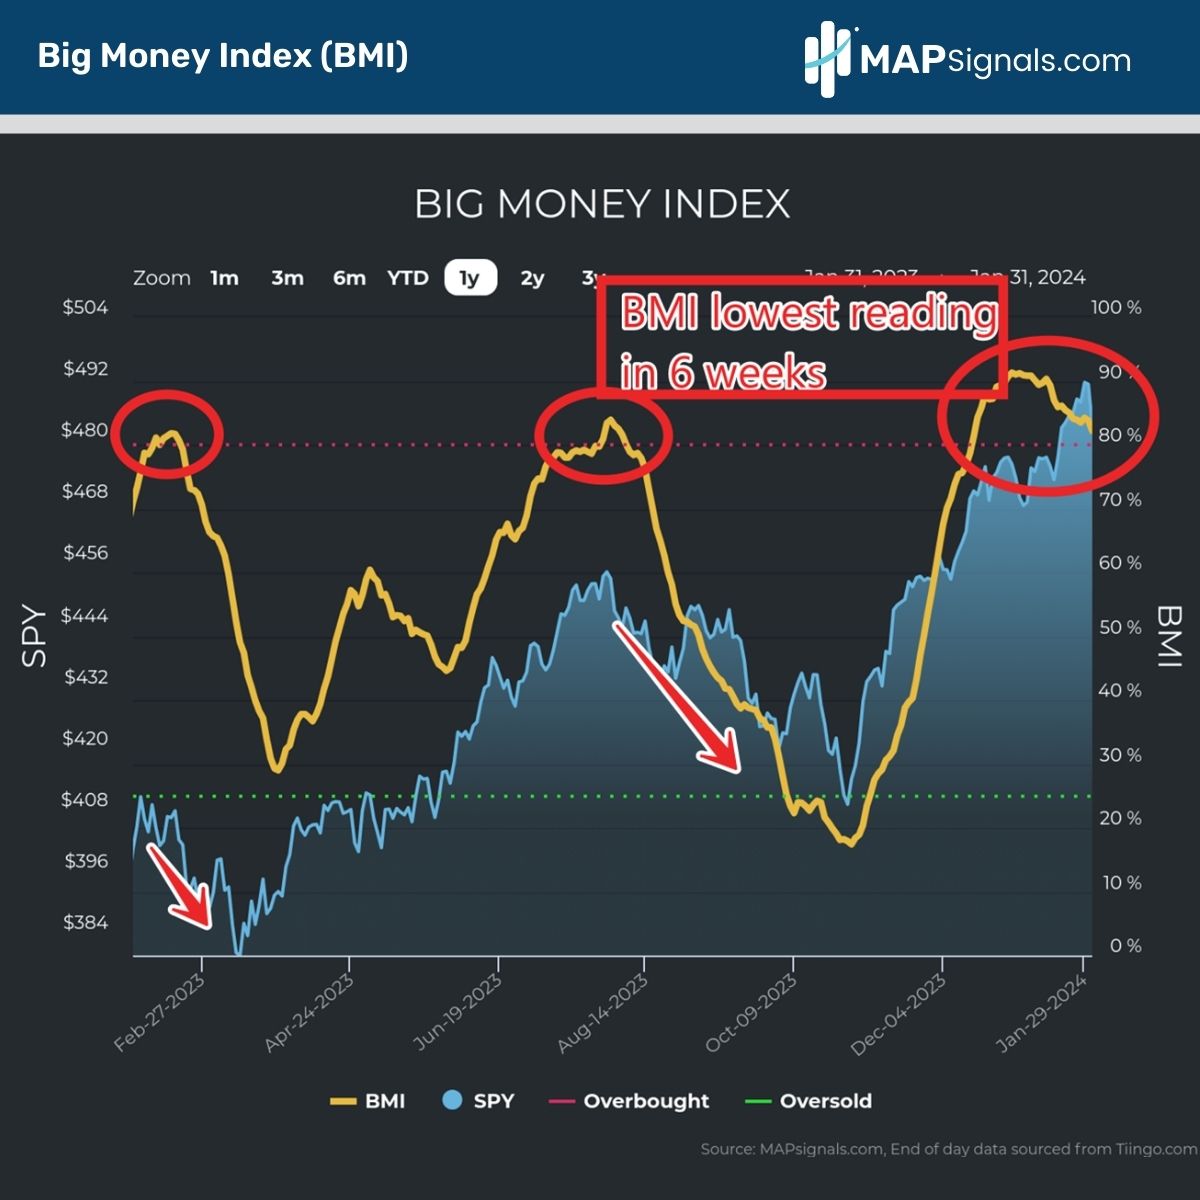
Staying overbought for 6-weeks may look uncommon, but it’s actually not…relatively speaking. Back to 1990, the average overbought condition lasts 22 days.

Of the 72 prior instances, 21 of them lasted longer than today’s episode. What’s more interesting is what happens once the BMI breaks below the 80% threshold.
Just 2 short weeks ago, I gave you the Falling Big Money Index playbook. In it was a powerful study that revealed how stocks have trouble once we fall out of overbought.
Since 2009, the S&P 500 has a negative performance 1-week to 2-months post falling out of the red zone:
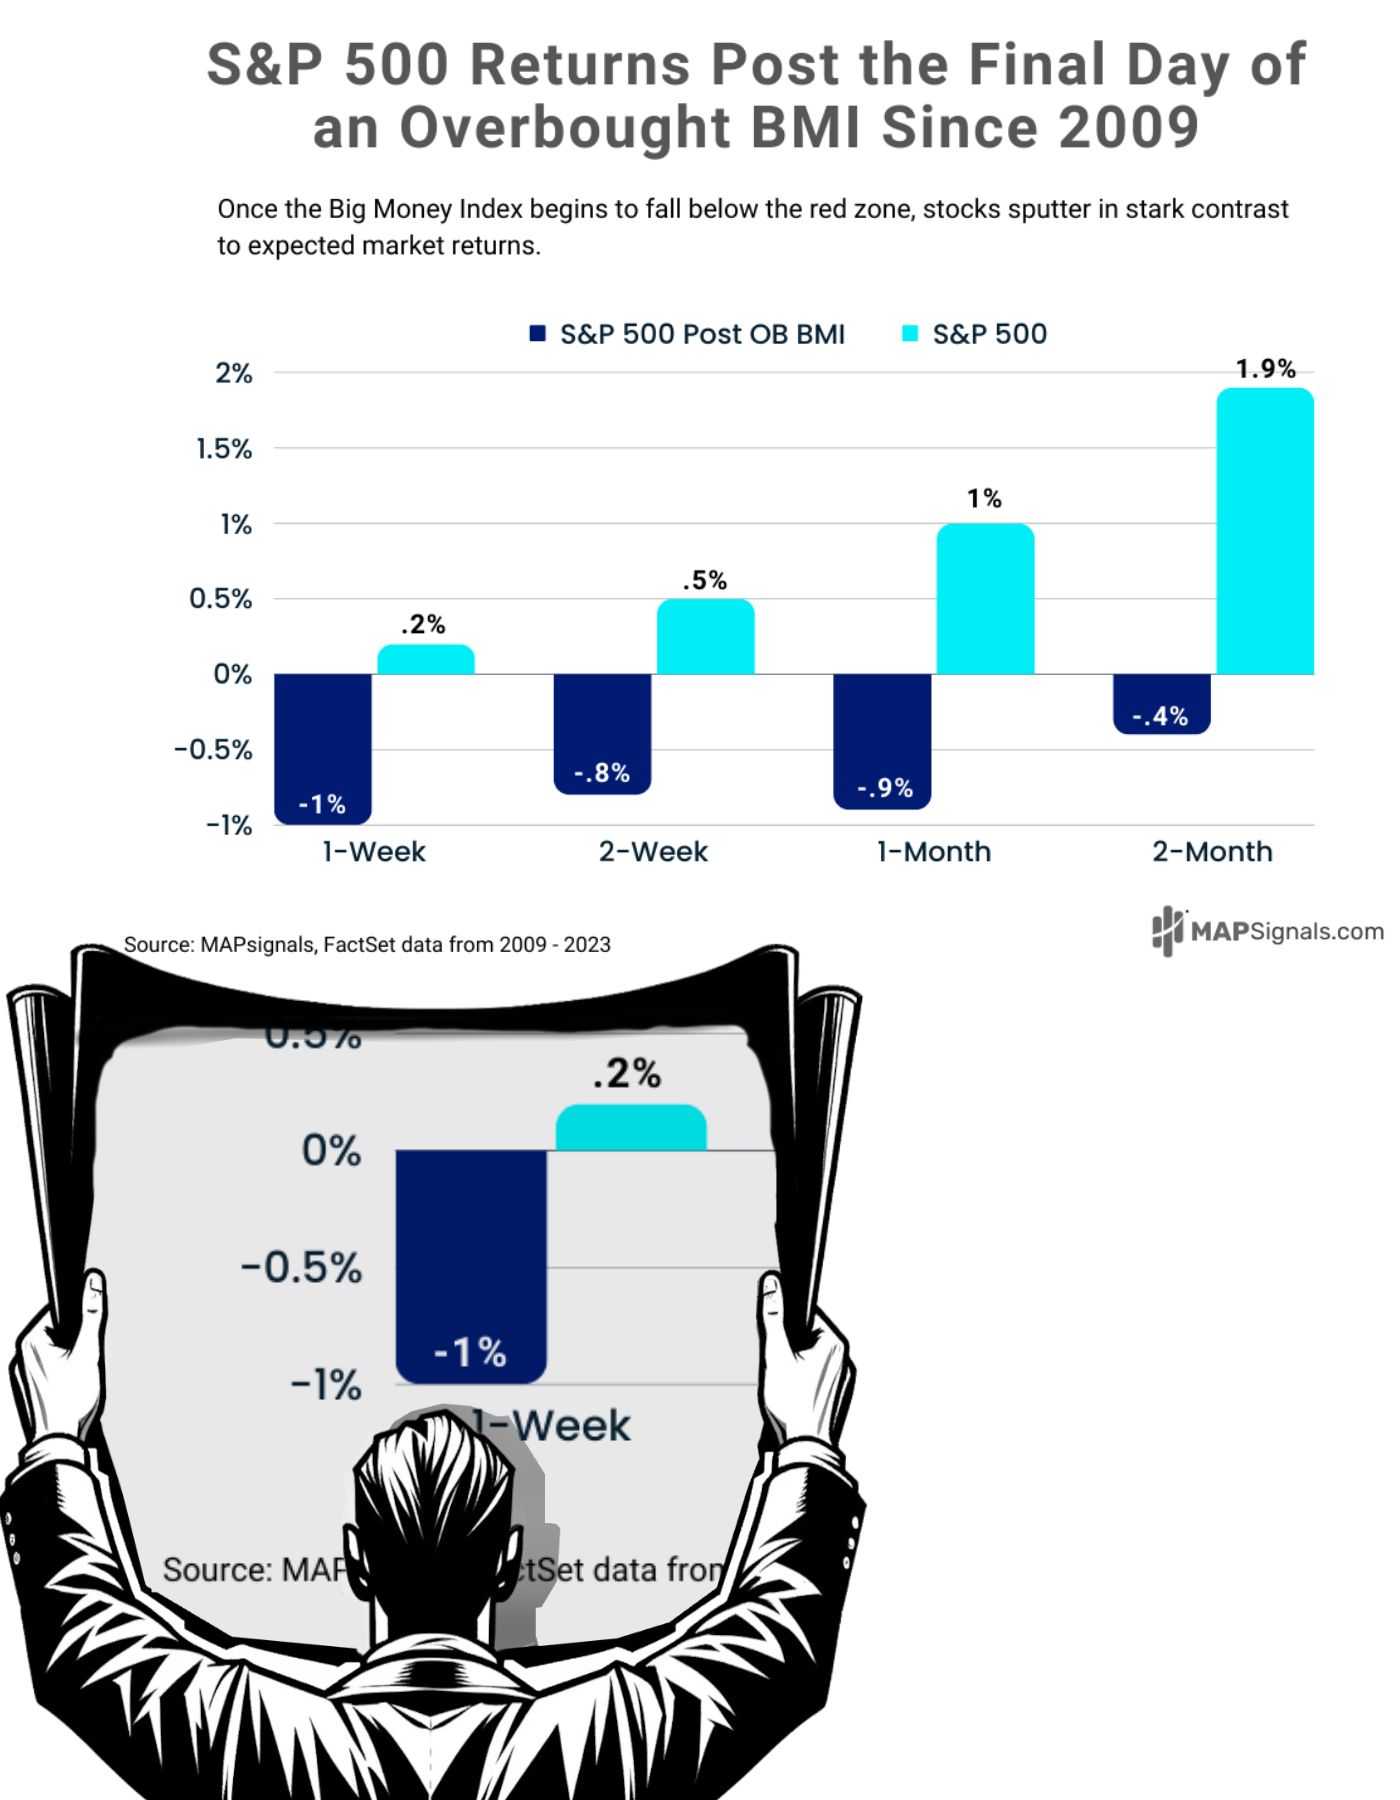
No doubt, we are reaching a critical market juncture.
Based on the latest downtrend of the BMI, you should expect some volatility soon. For all my near-term cautious bears, I can’t argue with that perspective!
Odds are we’ll get the long-awaited pullback.
But here’s where keeping an opportunistic mindset can pay off. While the near-term could be technically murky, the longer-term is pointing to healthy gains into yearend.
Not only does the macro favor the bulls in 2024, but how January performs, can as well.
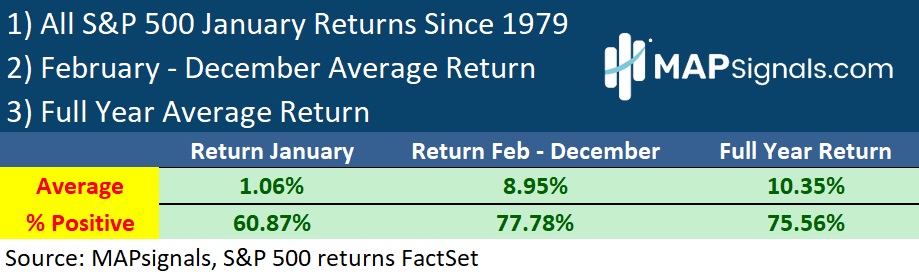
Since 1979, the month of January averages a +1.06% gain for the S&P 500. Not only that, 60% of the time it’s a green month:
Over 4 decades, history tells us that the first 31 days tend to be kind to investors. But there’s a bigger narrative inside all this data.
Let me explain.
We just closed out a strong January, with the S&P 500 gaining +1.6%. I went back to see if this is also a critical market juncture.
Turns out, it is. Month number 1 often sets the tone for the remainder of the year.
Using the same framework as above, when you isolate all positive Januarys, the next 11 months produce market-beating returns.
Since 1979, here are some January performance stats:
- When January is positive, February – December gains an average of +10.97% vs. an average +8.95% for all years
- When January is negative, the next 11 months drastically underperform with a +5.92% gain
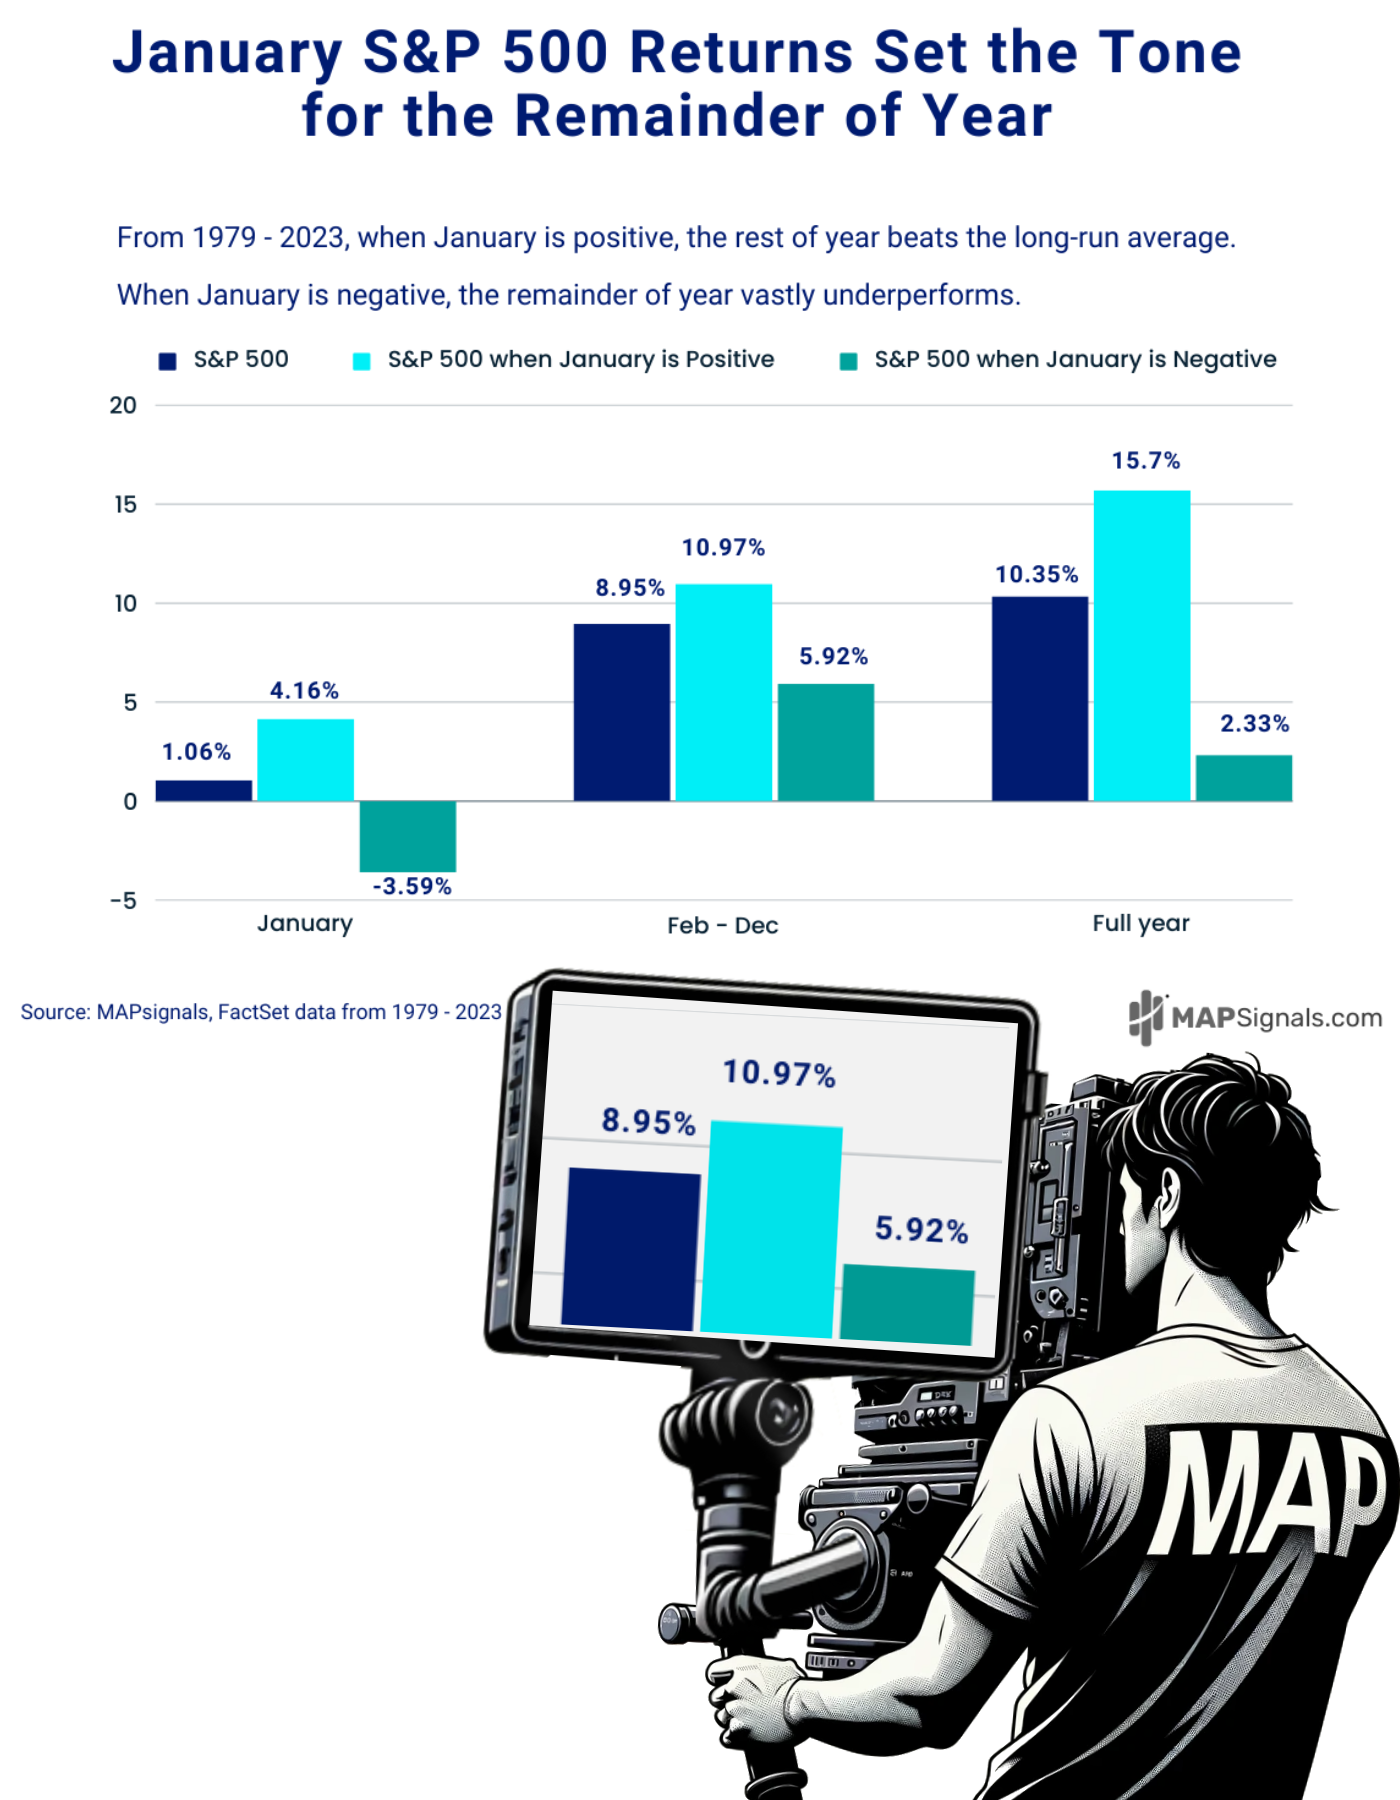
Our buddy Marty McMap is focusing on the important message: the nice rally we’re witnessing year-to-date signals we are reaching a critical market juncture…one that favors the patient optimist.
While bears may view the overcooked BMI as a hot stove, bulls see the coming pullback as a great opportunity to buy the dip.
Will the market ever fall again? Of course, it will! Just follow the BMI. When it starts to breakdown, stocks are likely going to head lower.
Will 2024 be a great year for stocks? Likely, yes too!
Earnings are improving. Companies that are beating and raising guidance this earnings season are in the driver’s seat.
And we know that January behavior often plots the remainder of the year.
You don’t have to be an Einstein to know that a pullback will come in the future. But I’d argue if you plan now, focusing on high-quality stocks to buy during the dip, you’ll look like an Einstein months later.
Let’s wrap up.
Here’s the bottom line: Markets are reaching a critical juncture. The BMI is overbought and heading lower. Once it breaks below the red zone, markets often have trouble.
But given we closed out a positive January, history says we should have a market-beating return in 2024.
Is the stove hot? Yes.
While the unprepared feel the burn, the optimist will see the real opportunity. Stocks are going higher over the long term.
The setup is pretty if you ask me.
Lastly, if you’re a Registered Investment Advisor (RIA) or are serious about investing, let data help your process in 2024. Get going with a MAP PRO subscription.
Einstein once said that, “In the middle of difficulty lies opportunity.”
What do you see ahead?