
Macro Outlook: A Dozen Charts Signal Big Gains in 2024
2023’s turned out to be a much better year than most investors expected.
A year ago, Wall Street predicted just 7% market upside with the S&P 500 finishing 2023 at 4100.
We showed you Why Stocks Can Be a Good Bet in 2023. Fast forward 12 months and the S&P sits around 4560 up 20% YTD. That’s 22% including dividends.
The party isn’t over. A dozen charts signal big gains in 2024.
Sure, this year’s rally could have been broader, but despite all the recessionary hand wringing, most stocks have done just fine. Technology – long our favorite sector, has crushed it, led by the magnificent 7.
So, what’s Wall Street saying now?
The average S&P 500 yearend 2024 forecast from the top 10 Wall Street brokerage firms is 4740, up just 4% from today’s 4560.
We’ll take the over on that call.
Today, I’ll make the case for another strong year for stocks. I’ll debunk several popular bearish arguments and highlight some underappreciated bullish macro signals. Then, I’ll lay out the best sectors to overweight in 2024.
Grab a coffee. Then hug a bear…they’ll need it.
A Dozen Charts Signal Big Gains in 2024
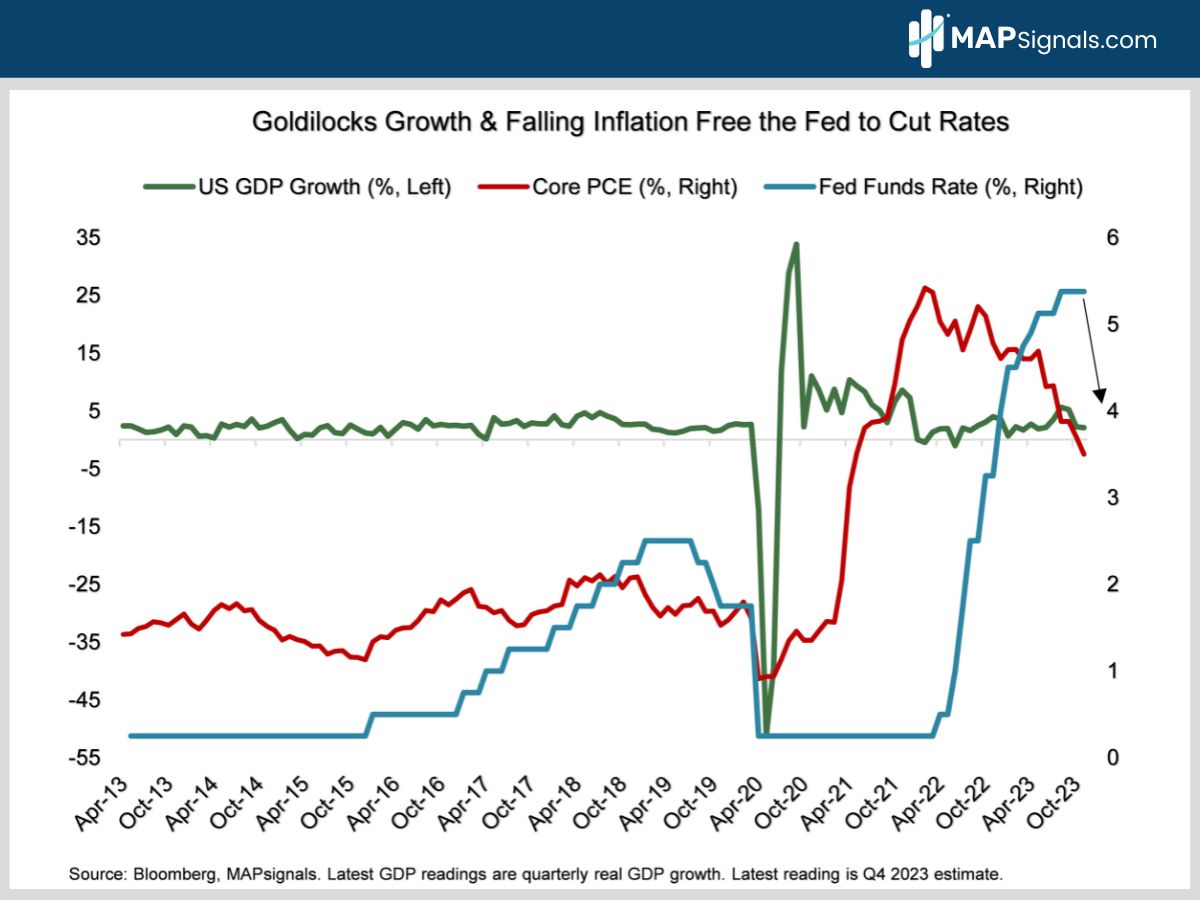
The much doubted, soft-landing is playing out beautifully. GDP growth is cooling down to 2% but a recession remains unlikely. A solid job market continues to underpin resilient consumer spending which represents 70% of US economic activity.
Meanwhile, inflation continues to fall, freeing the Fed to finally start cutting rates (chart 1). Fed funds futures currently price in 4 quarter point rate cuts next year, beginning in May.
The market’s biggest pain point is ready for relief:
This new rate reality plays into one of the popular bear tales being spread around: Higher treasury yields make stocks less attractive.
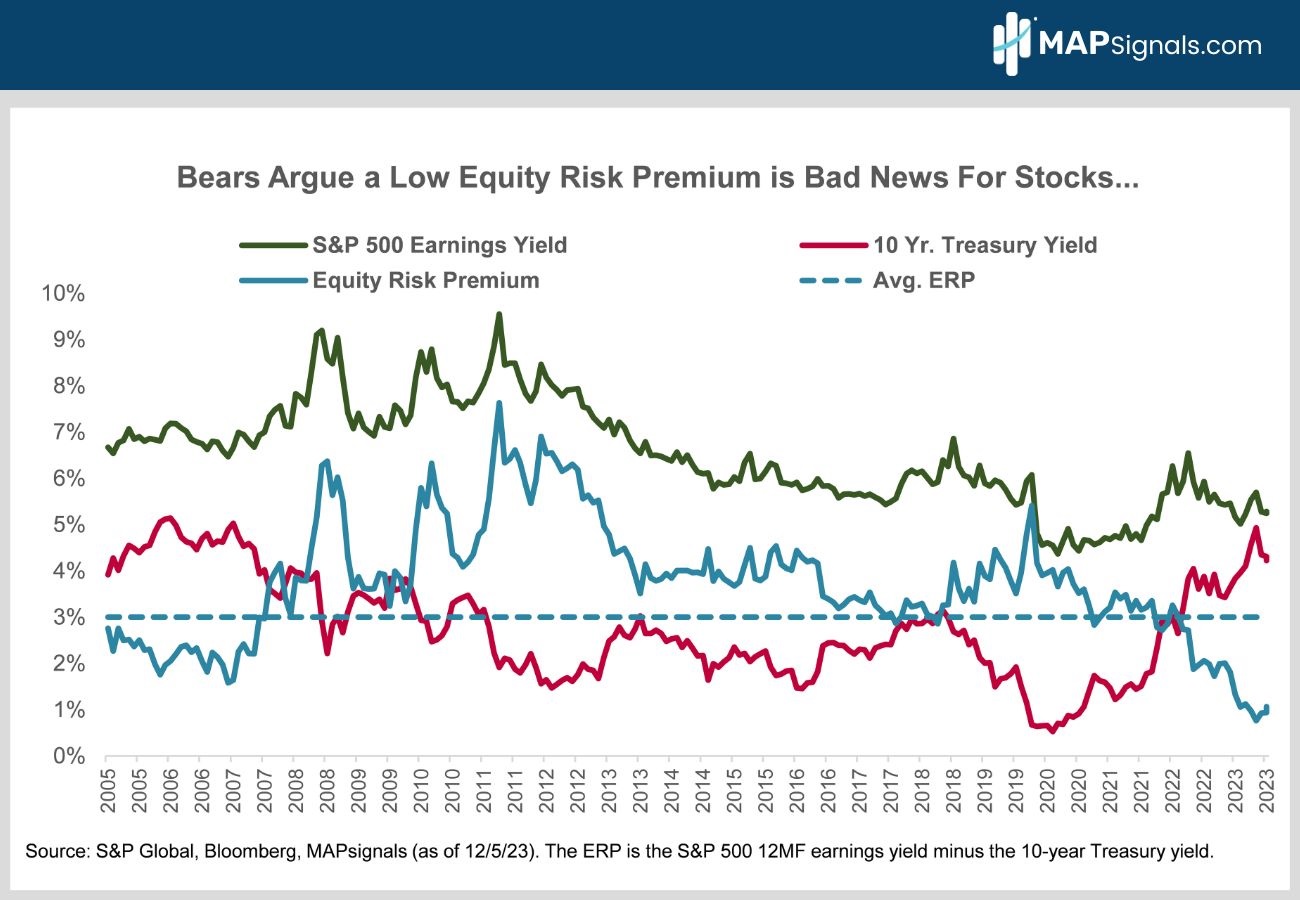
The spread between S&P 500 earnings yield (index level divided by 12-month forward S&P 500 EPS) and the 10-year Treasury yield is called the equity risk premium.
Right now, the equity risk premium is 1%. That’s the gap between the S&P 500’s earnings yield of 5.2% and the 4.2% 10-year Treasury yield.
Historically, the equity risk premium (ERP) has averaged 3% (chart 2). The bears argue a low ERP is a sign stocks are a bad bet relative to bonds.
Seems reasonable. Let’s dig deeper.
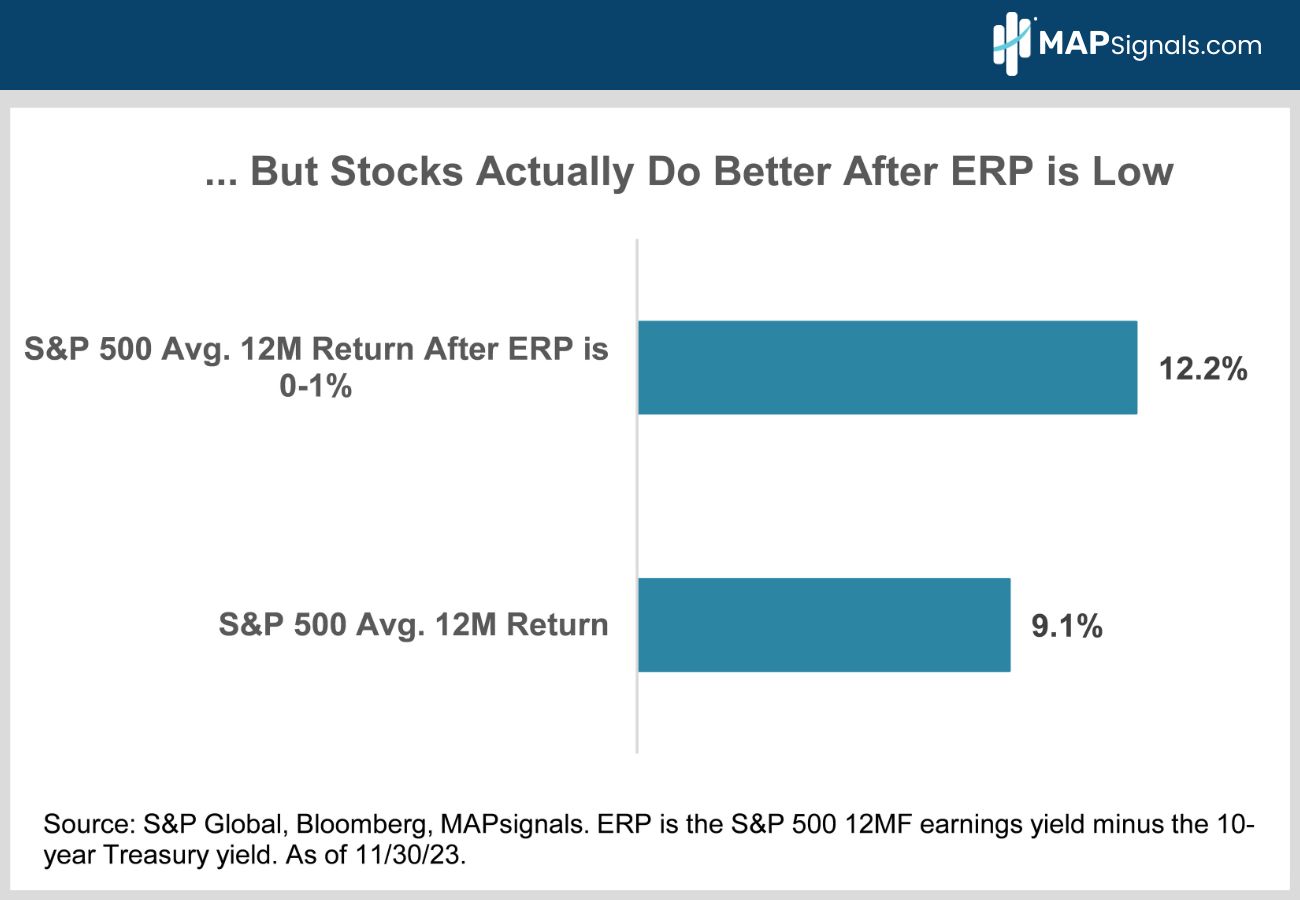
Here’s what the bears miss. History shows that when the S&P 500’s equity risk premium is between zero and 1%, as it is now, the average gain over the next year is an above average 12.2% (chart 3).
Here-and-now analysis rarely pays off:
History isn’t the only reason not to sweat today’s low ERP. It simply reflects 2023’s big jump in bond yields and sluggish first-half corporate earnings growth.
Stocks are rallying as rates come down and profit growth re-accelerates. You make money on Wall Street focusing on where we’re heading…not where we are now.
OK let’s move on to another popular bearish narrative to see if it holds up any better.
It’s no secret 2023’s market rally has been pretty narrow. The magnificent 7 have led the charge.
I’m sure you’ve heard this a lot. Common headlines read:
- This market rally is way too narrow.
- A handful of overpriced tech behemoths are driving all the gains.
- Stocks are headed for a big drop as this shaky foundation inevitably crumbles.
Sounds familiar right? So, are the bears onto something or just setting themselves up for more pain?
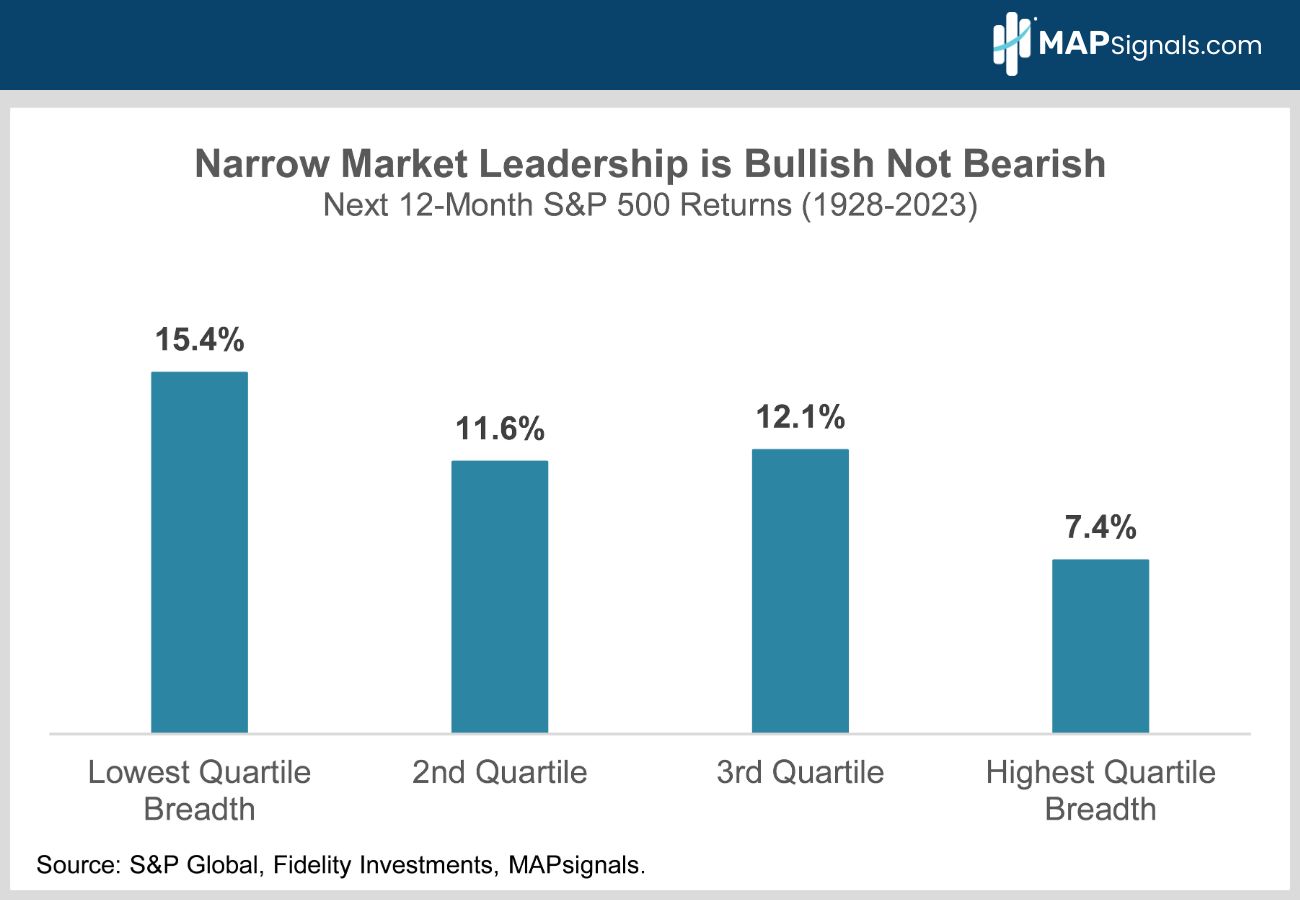
Here’s the chart to show your bear-suited buddies. Narrow market leadership is good because it precedes strong forward returns. This actually makes sense given that, after lagging badly, most stocks in the index likely represent value.
Consider the following:
Since 1928, the S&P 500 has posted 15.4% annual returns in the 12-months following periods of narrow market leadership vs. only 7.4% returns after very broad-based market rallies (chart 4).
Said another way, narrow leadership means more howling pain for the bears:
You may be wondering why strong breadth tends to result in weaker forward performance. Ultimately, when everything has already run up, it makes sense that future performance would be weaker.
Today’s narrow leadership means there are still plenty of stocks with lots of room to play catch up.
OK let’s shift gears and check in on the outlook for corporate earnings.
The recessionistas would have you believe that earnings are weak and likely to get worse.
Let’s fact-check that.
It’s true year-over-year earnings growth was slightly negative in the first half of 2023. For the full year, corporate profits are shaping up to be roughly flat with 2022’s tally.
But the stock market is forward-looking. Today, equities are trading on 2024’s profit prospects and the future looks bright.
After turning modestly negative in June, year-over-year 12-month forward S&P 500 earnings growth has recently re-accelerated to 5.7% (chart 5). The consensus forecasts 11% Y/Y S&P 500 2024 EPS growth.
Follow the trend of earnings for direction:
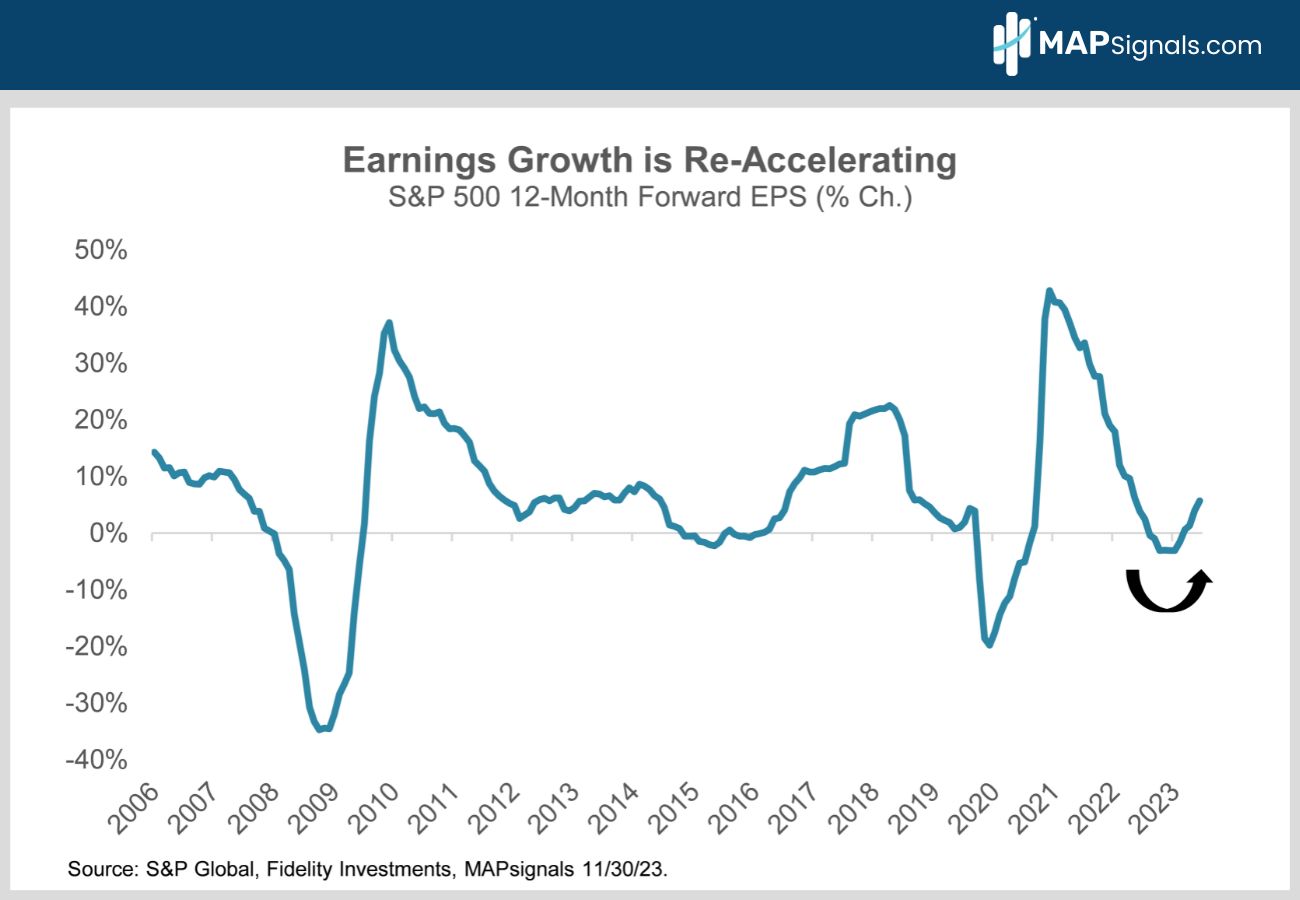
Stocks don’t follow headlines. They follow earnings. But here’s the best part.
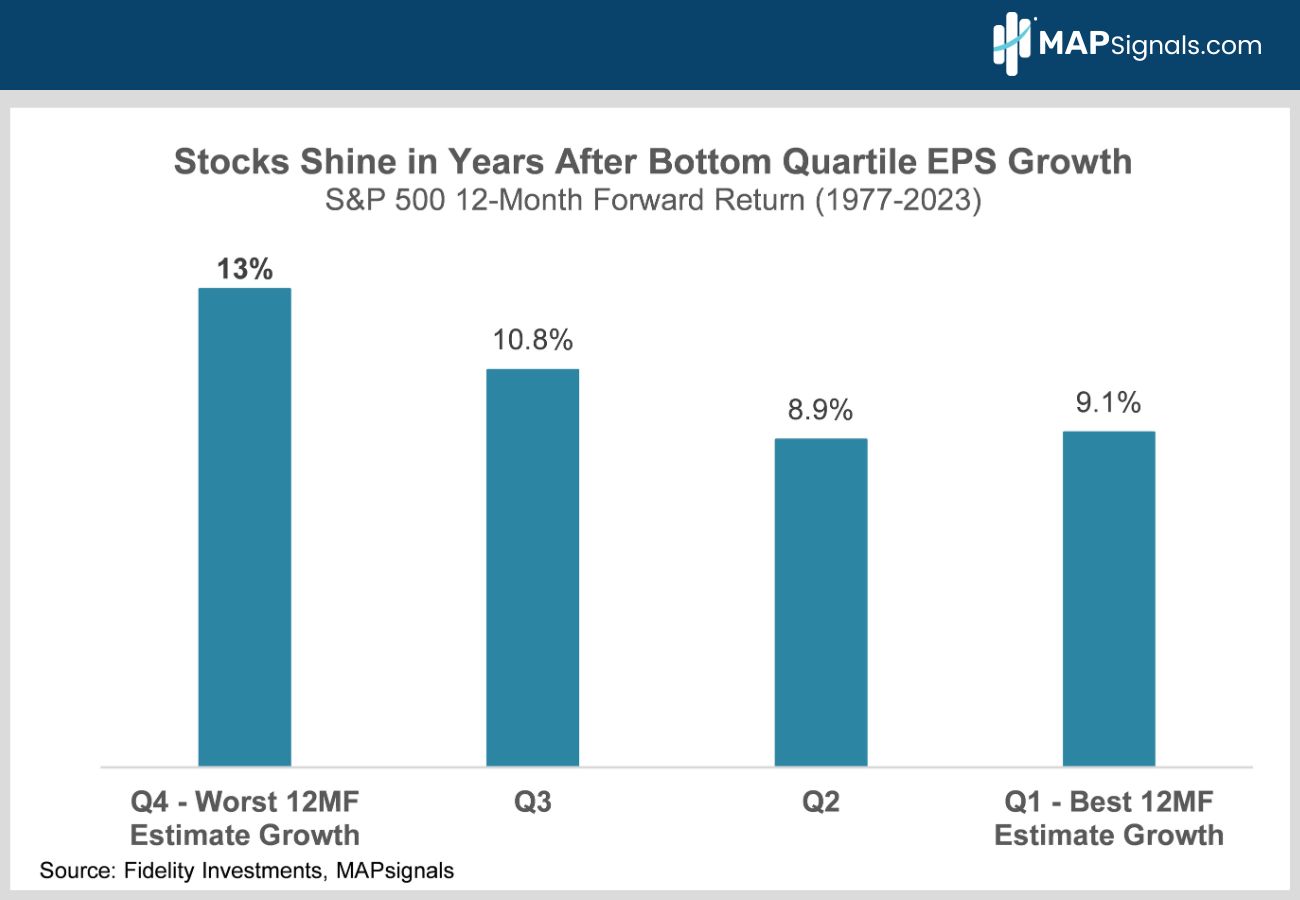
Since 1977, the S&P 500 has averaged a 13% gain in the 12-months following bottom quartile 12-month forward earnings growth (chart 6). Simply put, investors anticipate a profit recovery.
When earnings turn from down to up, stocks follow suit!
If you’re feeling bad for the bears now, we don’t blame you. But, the bullish evidence doesn’t stop here.
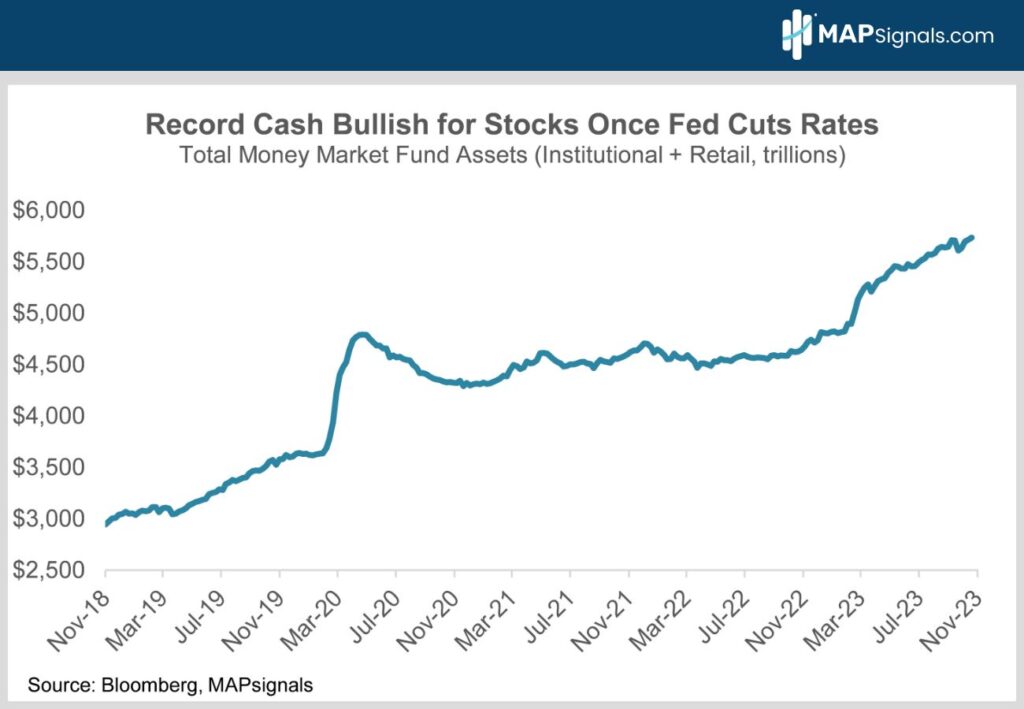
Here’s another underappreciated positive for stocks – There’s a record $5.7T sitting in money market funds (chart 7).
The doubters say there’s no way this money will move into stocks because safe money markets offer juicy 5% interest.
OK. Sounds logical, let’s unpack that a little. Here’s what a crowded trade looks like:
Sure MMs pay 5%, but after taxes that’s more like 3% to 3.5%, depending on your tax bracket – barely enough to keep up with 3.2% CPI inflation.
Here’s the deal, money market yields have peaked. Short-term bond yields track the Fed Funds rate. Once the Fed starts easing next year, money market T-bill and CD yields will start melting away like ice on a hot day.
Much of the trillions in cash will immediately be hunting for higher returns elsewhere.
You don’t have to an accounting genius to conclude some of this money will make its way into stocks.
What could that mean for equities?
Consider that the entire US stock market is worth roughly $50 trillion. Even if only 44% ($2.5 trillion) of sideline cash moves into equities, that’s 5% of the market’s total value flowing in – that matters – and it’s bullish!
OK let’s now shift to investor positioning.
Institutional Money Flows Signal More Pain Ahead for Bears
Are we getting the same bullish message from MAPsignals’ Big Money Index?
The Big Money Index (BMI) is a fantastic timing tool. Subscribers know we’ve been nailing market pivot points with it for years.
Here’s how the BMI works:
Readings under 25 are rare and indicate stocks are oversold and it’s time to buy. Conversely, readings over 80 mean stocks are overbought and traders should lighten up.
The BMI rightly told you to buy stocks last October at the bear market bottom when it went oversold at 25. Then it told you to buy the dip in March when it tanked to 29.
Then it nailed the July peak when it said to sell stocks as it went overbought at 84.
Most recently, the BMI slumped down to a super-low 17 in October. It was rightly telling you to buy right as stocks were bottoming out. The S&P 500 is up over 10% since its October 27 low at 4103.
Let’s face it, the BMI has an amazing batting average!
OK let’s see what the BMI is telling us now. It’s shot back above 60 as stocks have ripped higher (chart 8):
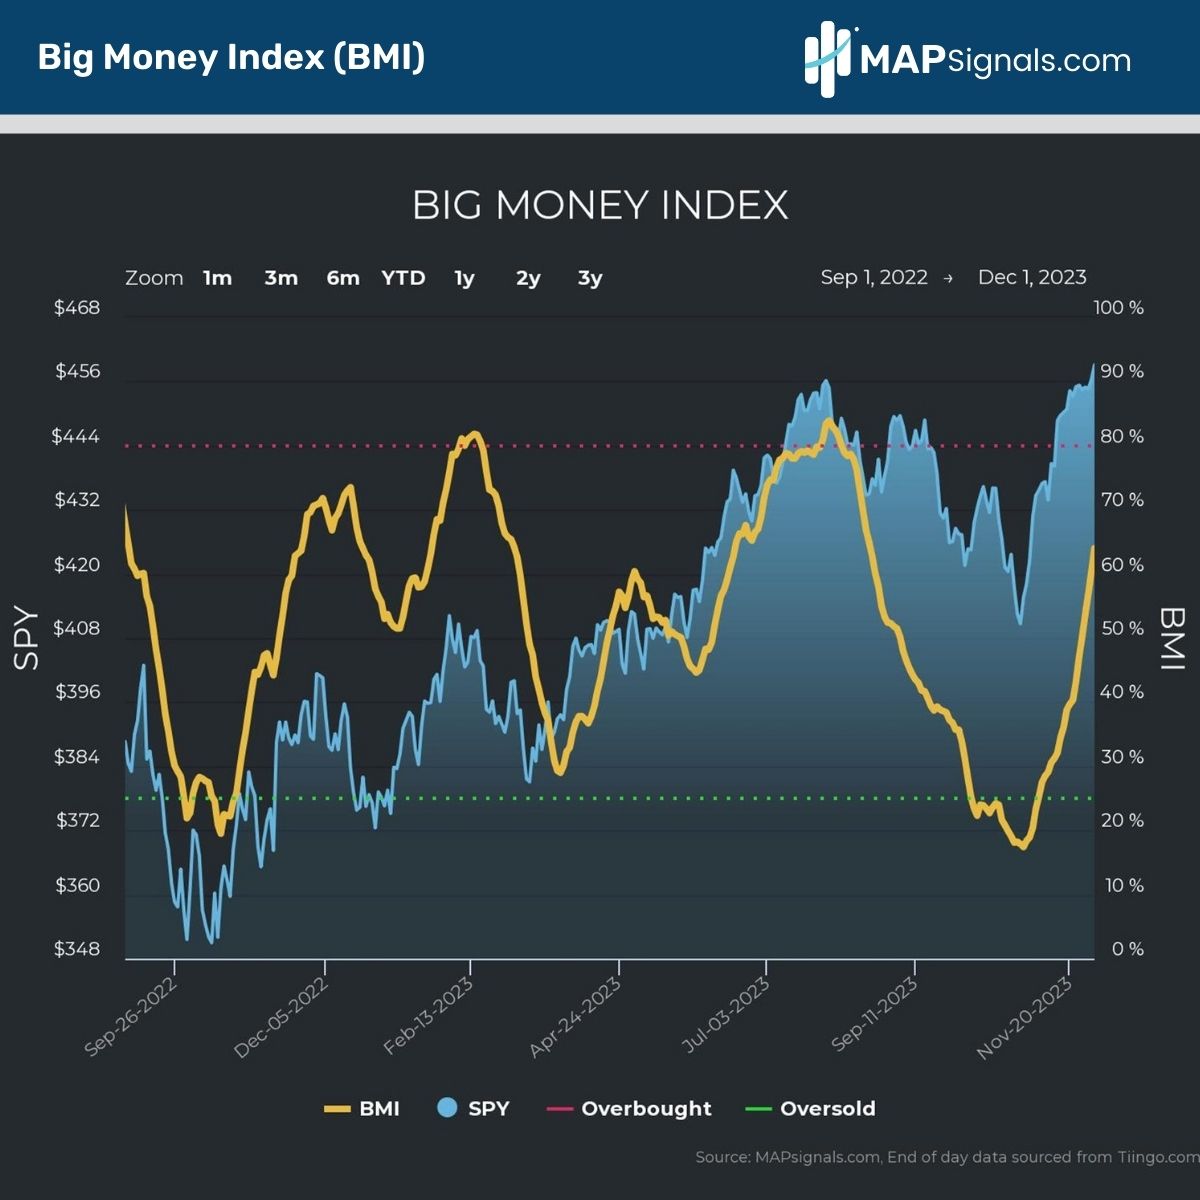
Here’s the good news. There’s still plenty of upside left. The index isn’t anywhere near overbought yet.
Check out the table below.
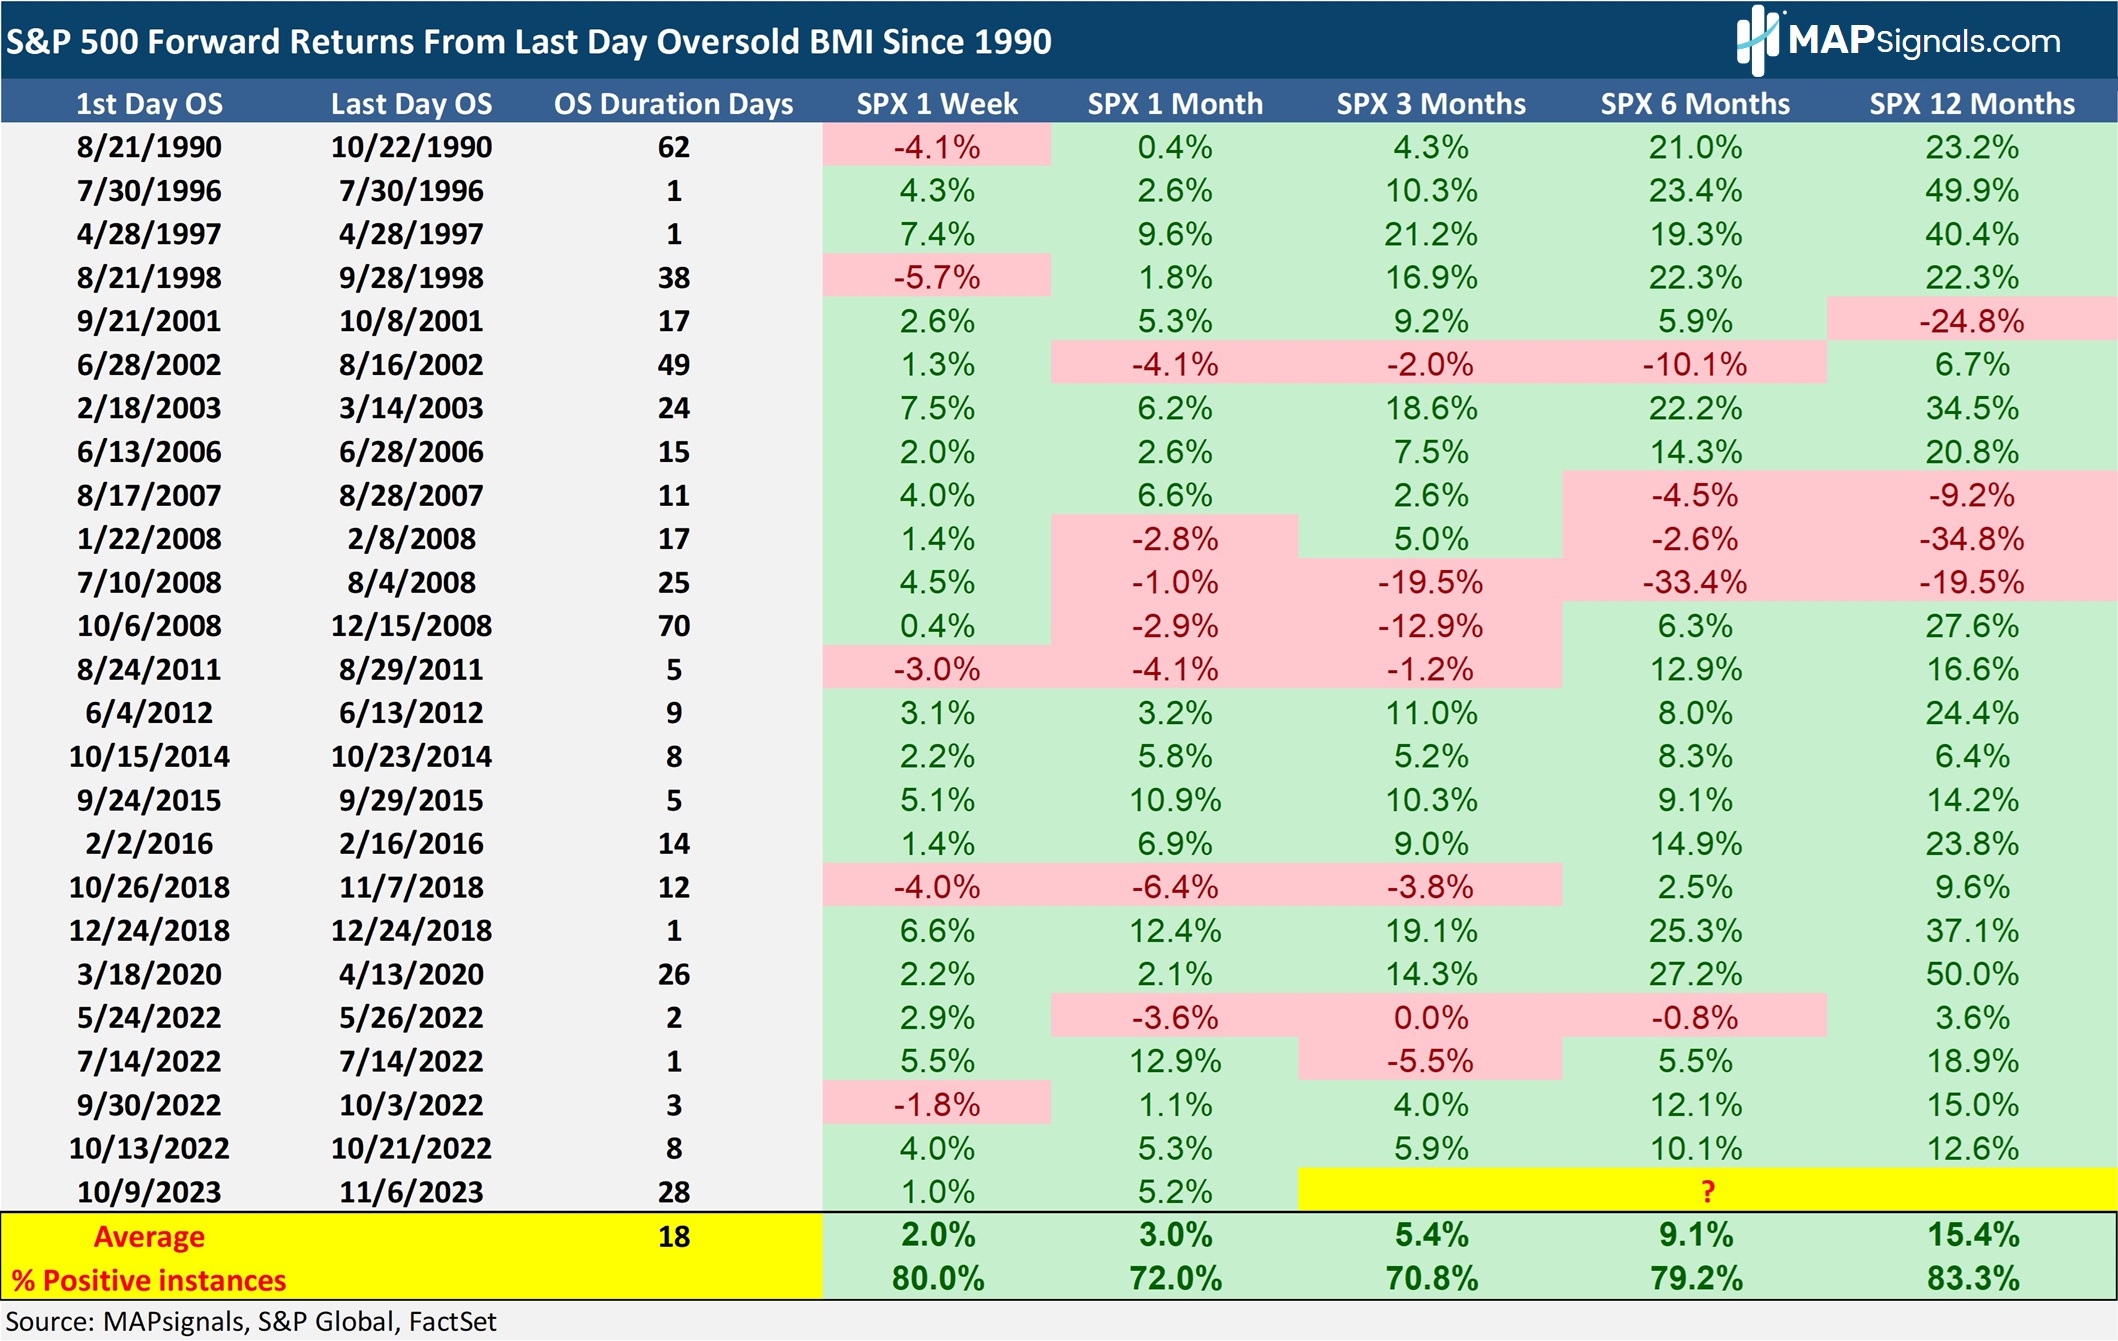
The BMI’s last day in oversold territory was November 6.
Since 1990, S&P 500 forward returns from the last day the BMI was oversold (chart 9) have been amazing across every time frame.
The S&P averages an impressive 1-month gain of 3%, a stunning 5.4% 3-month gain, a 9.1% 6-month gain and a super impressive 15.4% 12-month advance.
All these numbers crush the S&P 500’s historical average performance across all these time frames.
For perspective, remember that the S&P historically only averages 9% annual returns. Compare that to 9% in 6 months after the BMI’s been oversold.
That’s double the market’s normal gains!
Best Sectors to Own in 2024
The best move when the BMI goes oversold is to buy stocks aggressively. THAT you buy is more important than what you buy.
Rips off the oversold BMI floor tend to be very powerful and last for months. We expect a rising tide to lift most boats.
If all you do is buy an S&P 500 ETF like Vanguard’s VOO you’ll do fine (VOO’s ER is 1/3 the price of SPY).
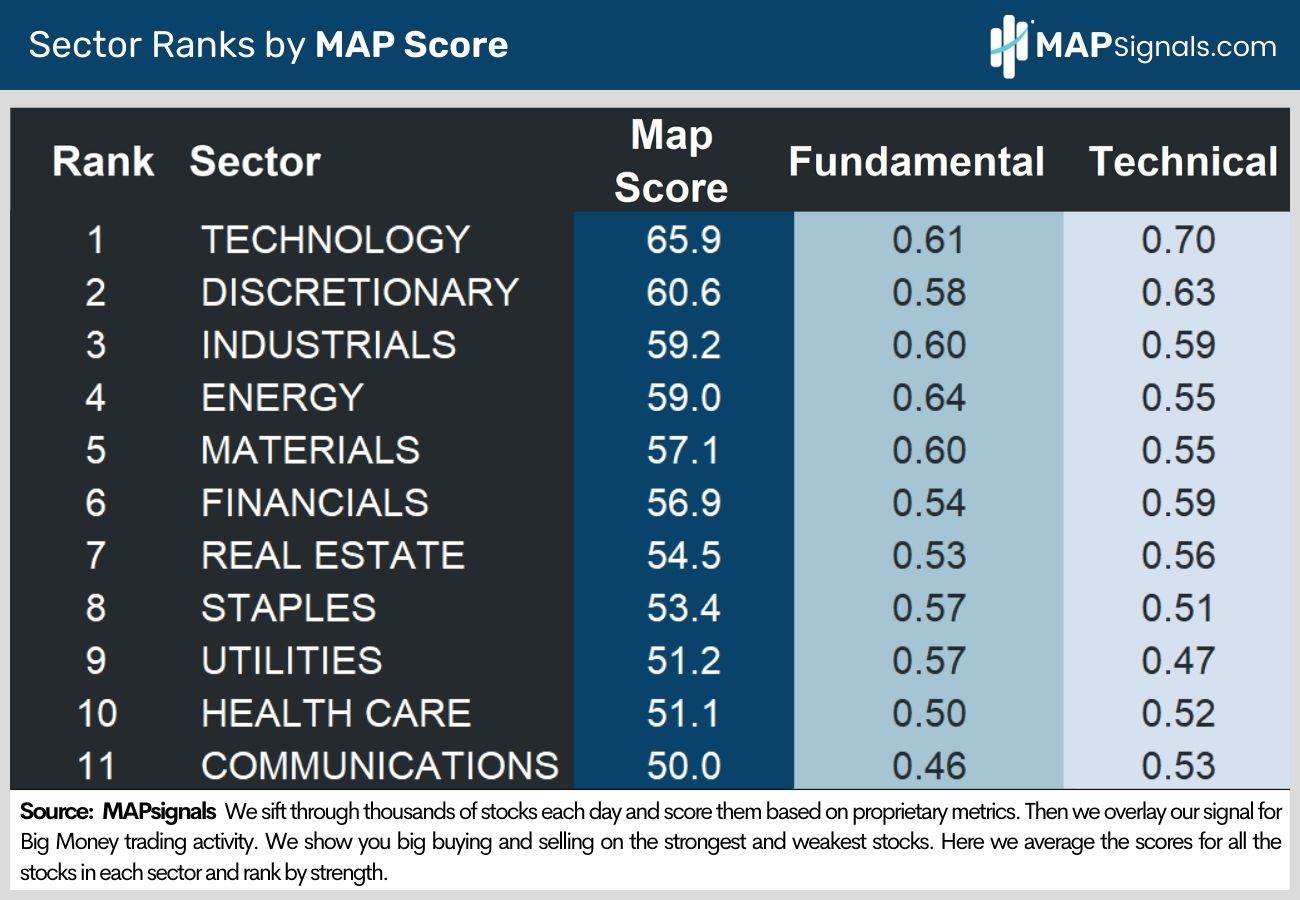
If you want to do even better, check out MAPsignals’ top ranked sectors (chart 10): Technology, discretionary and industrials.
Note how they top our sector rankings.
MAPsignals has been in the soft-landing camp all year. We’re sticking with the call. But we understand that most investors think the economic environment remains highly uncertain.
A recent Bloomberg survey of leading economists reveals they see a 50% chance of recession in the next 12 months.
The bottom line is that when growth slows, high-quality growth stocks tend to outperform as investors pay up for reliable growth where they can find it. Earnings predictability is key.
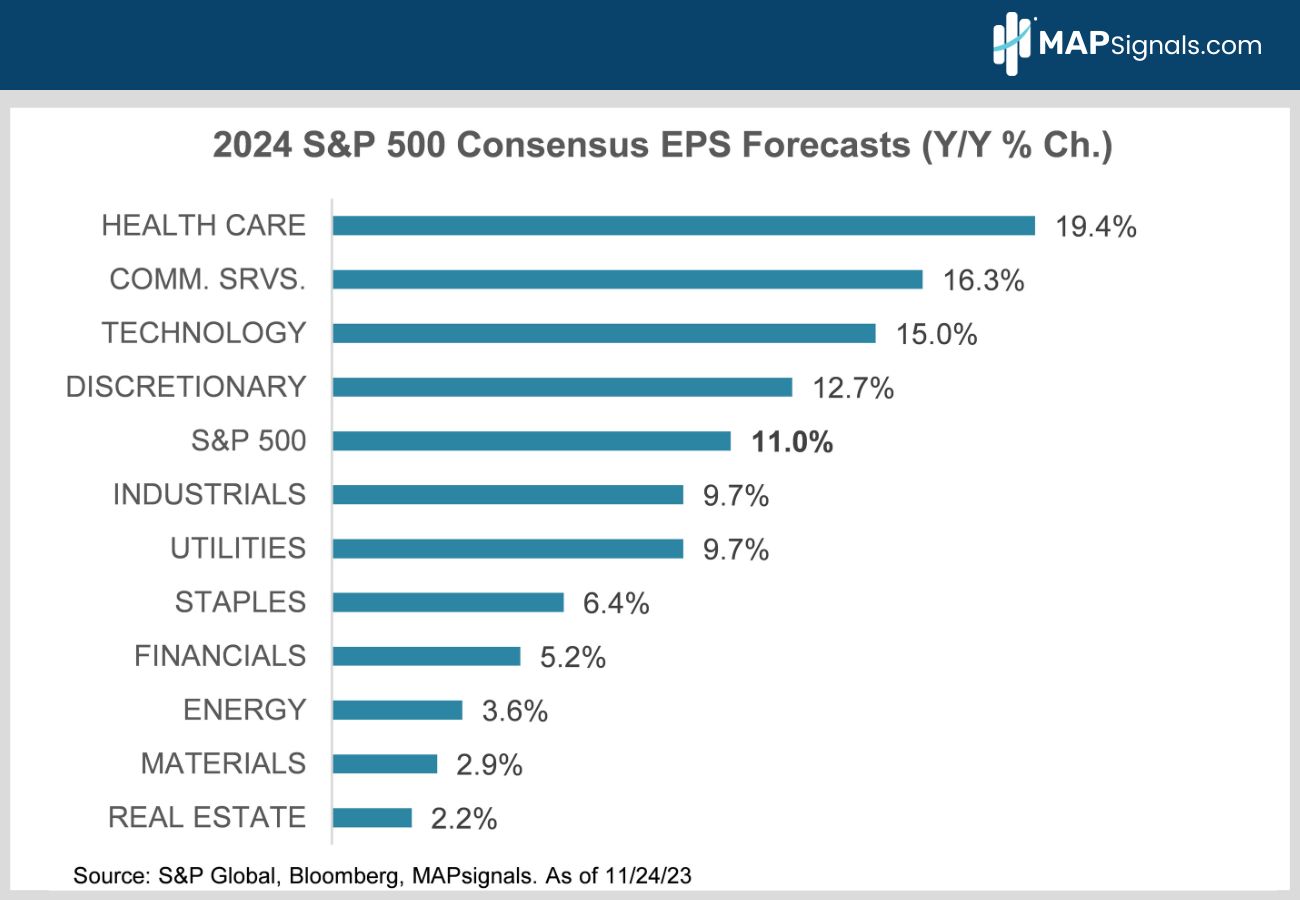
The Magnificent seven fit the bill. They live in the technology, communications and discretionary sectors, which are expected to grow their earnings much faster than the S&P 500’s 11% in 2024 (chart 11).
Third-ranked industrials look attractive too. Increasing demand for IoT enabled aftermarket services have left many high-quality industrial companies far less cyclical than in the past.
It’s one thing to measure what’s happening now. It’s another to study the historical evidence. The latter holds equal weight. So, we do both.
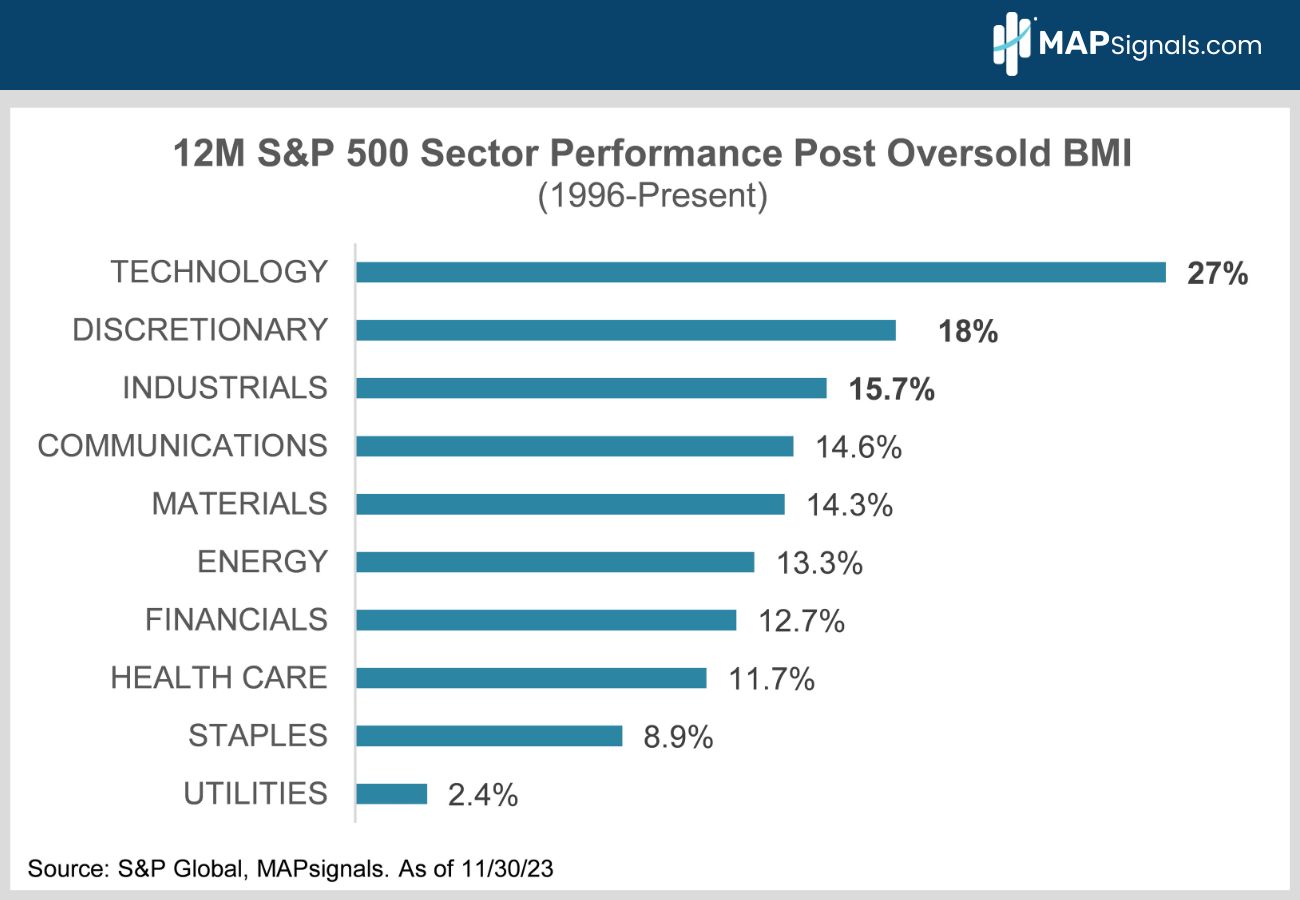
We’ve recently vaulted out of oversold conditions. My colleague, Luke Downey, went back and studied all similar oversold periods and compiled all the 12-month forward sector returns after these rare events.
Since 1996, Technology stocks are the runaway outperformer after reaching the green zone (chart 12). On average, tech is up 27% a year later while discretionary comes in 2nd with an 18% pop, and industrials is 3rd at 16%:
Betting on the technology, discretionary and industrials sectors check the macro, fundamental and historical boxes.
The Bottom Line
A dozen charts signal big gains in 2024. Today’s relatively narrow leadership means there are still plenty of stocks with lots of room to play catchup as recession fears fade.
Goldilocks growth and melting inflation mean the Fed will begin easing mid-year.
Meanwhile, earnings growth has been re-accelerating since troughing in June. 2024 S&P 500 corporate earnings are expected to rise 11%. Since 1977, the S&P 500 has averaged a 13% gain in the 12 months following bottom quartile 12-month forward earnings growth as investors anticipate a profit recovery.
Technology, discretionary and industrial stocks are likely to outperform. They’ve historically done best when the BMI is rebounding from a rare, opportune deeply oversold condition.
The current macro favors them too. When growth slows, high-quality growth stocks tend to outperform as investors pay up for reliable growth where they can find it. The technology, discretionary and industrials combo are full of blue chips expected to post healthy double digit EPS growth next year.
So, there you have it. The macro is better than you think, and the BMI agrees! That’s a powerful 1, 2 punch!
If you want to find specific technology, discretionary and industrials stocks ramping with Big Money support, get started with a MAPsignals PRO subscription. It’ll get you access to our portal that updates every morning, showcasing the stocks getting bought and their scores.
MAP your own stocks and ETFs. AND you’ll get our prized Top 20 list in your inbox every Tuesday!
There are plenty of stocks poised to keep ripping in 2024. If you’re a Registered Investment Advisor (RIA) or are a serious investor, use a MAP to find them!
Invest well,
-Alec