
Rotational Rampage
At face value, the market tilted bullish as Joe Biden was officially called the winner of the 2020 presidential election. Then liftoff came after Pfizer announced 90% effectiveness in a COVID vaccine study. Stocks hit all-time highs.
But a rotational rampage is what’s really happening under the surface.

The price action we saw over Monday and Tuesday smacks of “wrong-way” positioning. For instance, the Russell 2000 rallied more than 5% Monday while the NASDAQ fell nearly 2%. Imagine being a leveraged hedge fund positioned “wrong way”… long NASDAQ (growth) and short RUSSELL (value).
Waking from your dreams on a day like Monday became a fast nightmare. I envision money managers being forced to make quick movements to stop the bleeding.
Great stocks have been getting sold, while the previously unloved orphans have been getting bought. Stocks as a whole may seem higher, but the rotation of capital within stocks is violent. Tech suddenly is getting whacked while value stocks, set to potentially benefit from a reopen, are getting praised.
But, be careful getting too bearish on Technology and Growth. Inevitably, the pendulum will swing back in favor of those prior leaders… and when it does, look out!
Last week we prepared for liftoff in stocks. As you’ve seen – it was right to prepare because major juice rushed into the market. Many are asking, “what’s the big money doing now that we have a vaccine?” As you know, we live by data, and while it may seem like we are seeing mixed signals, it’s merely 2 steps forward and 1 step back.
Let’s look at what the data is telling us about this rotational rampage.
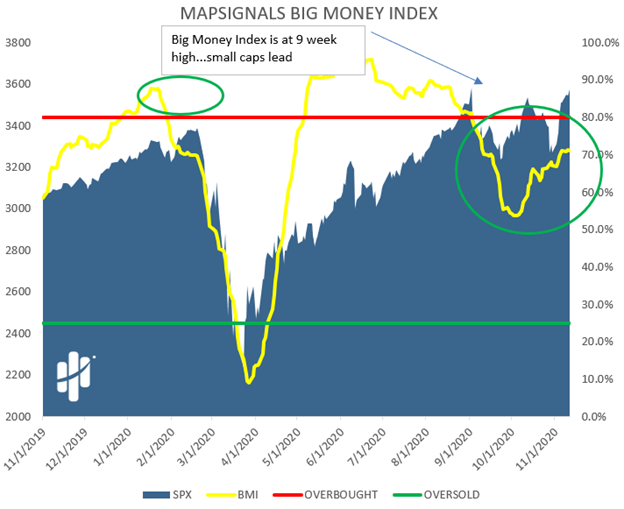
Big Money Index Is Flat To Rising
Starting from the top level, in general stocks are rising. Normally the type of buying we are observing would indicate a blow-off top. To be clear: that is not the case now.
The Big Money Index shows us that the number of stocks being bought greatly outstrips those being sold. The BMI is sector agnostic and sits at a healthy level of 71%. It will likely remain here for a few days and then begin a march higher:
Now, let’s look at what happened with small-caps.
Rotational Rampage In Small Caps
Why is the BMI going up if tech stocks are getting rocked?
Well, the Big Money Index is all about buying vs. selling in all stocks. And the selling we see in Tech and Growth stocks is nothing compared to the stock buying in other sectors. Let’s just look at the daily net of all signals.
Remember last week when we said we have liftoff? Well, look how right we were:
As a reminder, green bars mean more buyers than sellers on a given day while red means more sellers.
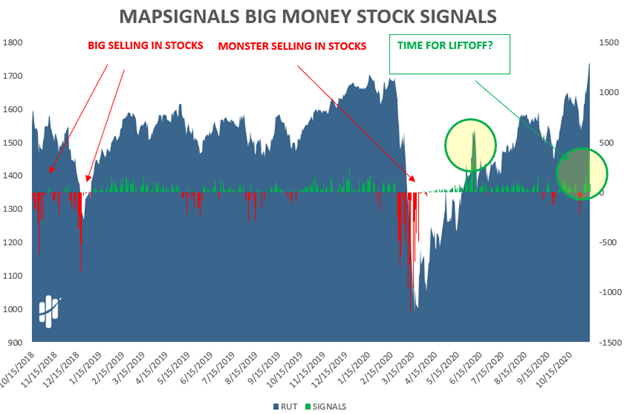
Let’s zoom-in to see how significant the buying was. Look at the circle to the right. Weeks before we saw some big selling…talk about a rotational rampage…
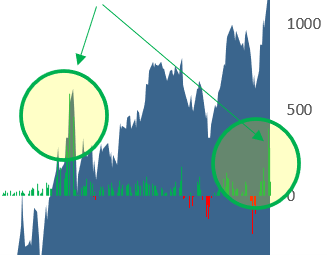
Why does this level of buying differ from the huge buying we saw in June? Circled off to the left in the chart above, is the huge green buying bar from June. That was animal spirits. Now, that green bar was ALL sectors being bought.
The last 2 days of data is significantly different in that ONLY certain sectors are being bought while others are being sold. This is known as a rotation.
Rotational Rampage In Sectors
A great way to see the dispersion in sectors is to track the velocity of buying. If the green line is rising, buying is increasing quickly.
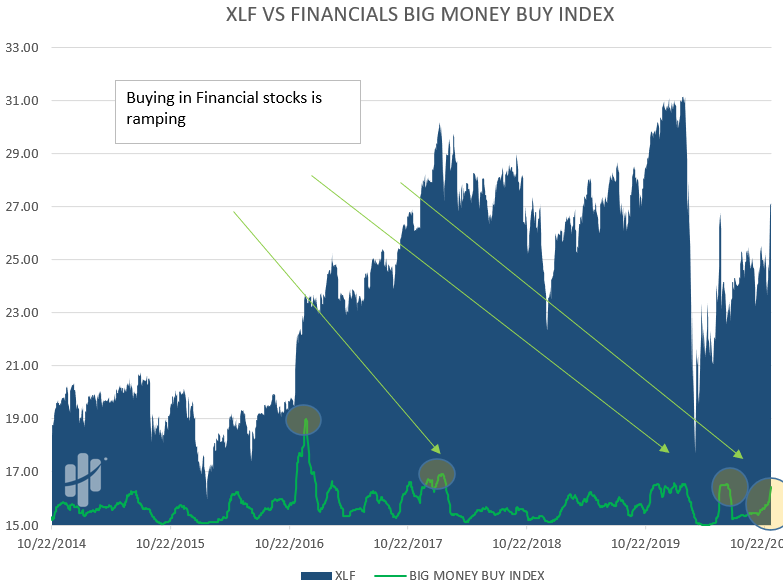
Financials:
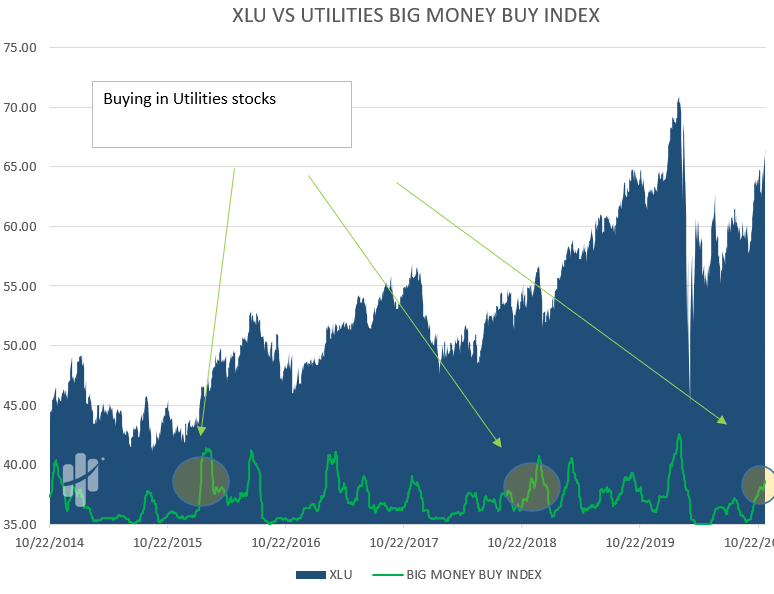
Utilities:
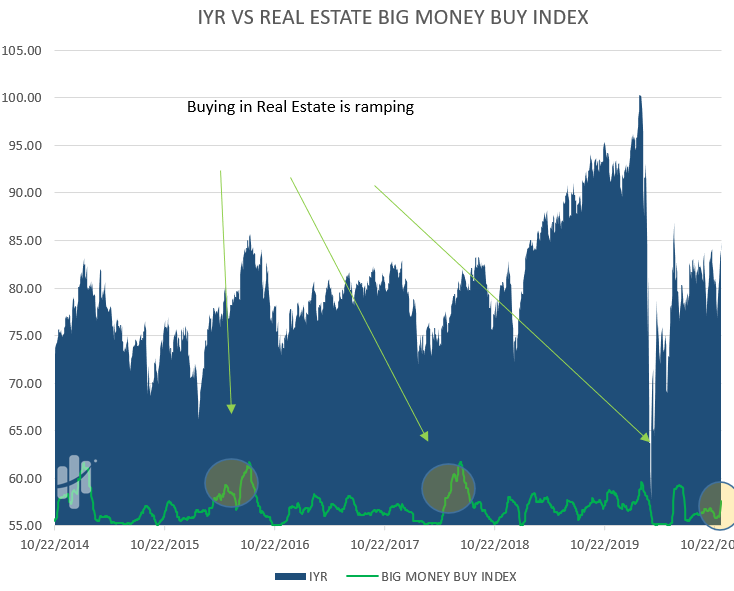
Real Estate:
Other sectors are seeing big buying too: Discretionary, some Healthcare, Industrials, & Materials. Their rising green lines will become apparent in the coming days.
Revisiting what I said earlier, we aren’t seeing a blow-off top (extreme enthusiastic buying)…merely, it’s a rotational rampage out of growth and into value. This is lifting stocks as a whole.
Technology And Growth Stocks Are Muted
Let’s talk about the main area of weakness: Technology and Growth Stocks. But let’s be fair here: weak may be an overstatement because the stock market is in a rotation not to be confused with “risk-off”… When everyone sells everything.
Below we see the speed of buying. Notice the rate of tech buying isn’t falling? This is because some small-cap Tech stocks are heading higher while some of the larger ones are falling:

Now, if you think selling is big in Tech, you’d be wrong. Below is the rate of big money selling in Tech stocks. If the red line is increasing, selling is picking up:
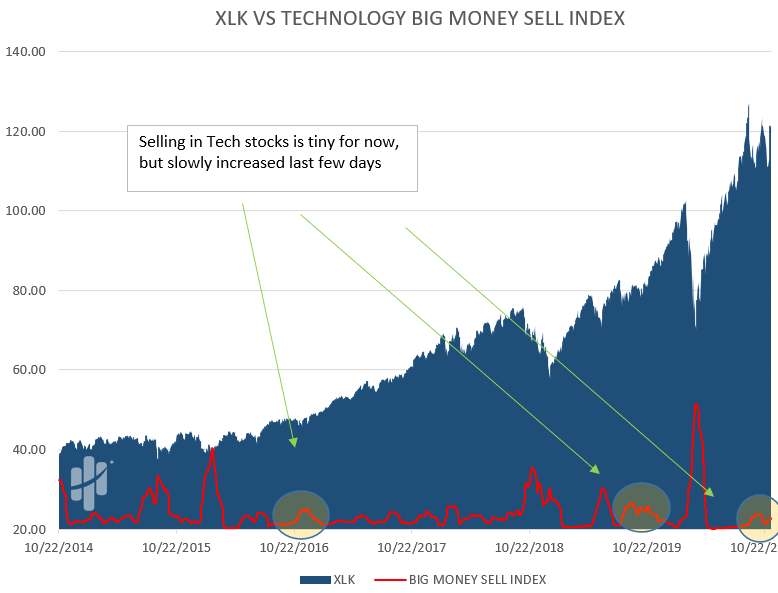
The key point here is that the pain in growth and Tech stocks isn’t sounding any alarms- it’s merely giving back some gains after a stellar rise.
Now that’s interesting but something else really caught our attention on Monday…
Massive ETF Buying
When there is a big rotation such as value shifting from famine to feast, you can see mega buying in ETFs.
Below is the Big Money ETF Index. It nets out the ETF buys and sells each day. Big green bars mean buyers showed up in mass. Red means sellers won.
Look at Monday’s monster green bar circled off to the right…that’s juice:
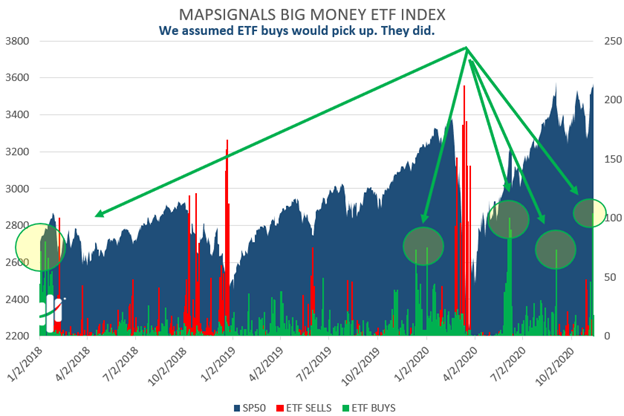
Prior big green ETF bars have signaled extremes. But when that happened, massive ETF buying occurred in an overbought market.
We’re not close to overbought. So that indicates to us, that we are closer to a market lift-off.
If you want even more detail, we chatted in depth about all of this new data yesterday in our podcast, Headline Roller Coaster. We dove into this rotation trade and why we think stocks have further upside.
The Bottom Line is this: the data is very bullish overall. The trend of buying in stocks is rising. The BMI is increasing, ETF buying is ramping, and we aren’t yet overbought due in part to the rotational rampage.
Mark my words: growth and tech stocks will again have their day….of this I am certain. When this rotational rampage eventually swings the other way, it wouldn’t surprise me at all to a see a multi-day Tech face-ripper type of rally. Betting on quality Tech companies to stay down for long is a losing strategy over the long-term.
And we’ve seen similar rotations before. The prior one that I recall was late August/early September of 2019. Two things standout about that time:
- Uncomfortably, small-caps (IWM) rallied monstrously everyday for a week+, while
Tech and growth stocks (QQQ) got hammered - Sweetly, we picked up great stocks on the weakness at discount prices.
I see that playbook unfolding now…
Don’t fear change, flow with it. When the market changes and acts unpredictably, instead of finding reasons to be fearful, find reasons to be greedy.