
Big Money Index Signals Red
You can feel the tension in the air… investors are afraid.
Past times when the BMI approached overbought, we told people to look for an investing bonus level. Meaning, hold great stocks because more gains were coming. That’s because no sellers were in sight.
This time it’s different: The Big Money Index signals red. It’s a kiss away from overbought and the tone in the data looks to be shifting.
Here’s why:
Anytime growth stocks are weak, people freak out. They worry of a crash as emotions run high. It’s happened time and time again…and now is no different: Growth stocks are getting picked off and it’s causing much discomfort.
So, are we freaking out at MAPsignals? No. Are we zipping up the bear suits? That’s a definite no. They’re hot, itchy, and uncomfortable.
What we are doing is looking at data. A clear narrative is happening: Growth stocks are reaching a congestion zone, but not all stocks. It’s true there is selling in popular Tech names, but we also see healthy buying in cyclical stocks.
Price action of the last 2 days has halted the BMI’s rise. That’s new information, because prior to this week, there were hardly any sellers in sight. But, that’s suddenly changing.
There’s just enough recent selling (specifically in growth), to slow the Big Money Index to a pause. While we’re close to overbought, we’re not quite there yet. But more important is the trajectory of the BMI, not necessarily the reading itself.
This is critical: being overbought isn’t a sell signal itself, instead it’s an alert. When stocks rise quickly (like now), even subtleties in our data put us on watch. Think of a flashing red light. It works like a stop-sign: You roll to a stop, look both ways, then proceed with caution only if it’s clear.
Two days of trading rarely makes a trend. But the past two days do signal that we must be attentive. Is this just a bump in the road? Or is it the start of something bigger?
Only time will tell us. Seasoned investors know that market environments differ from one another. And today’s environment resembles a growth unwind more than anything else.
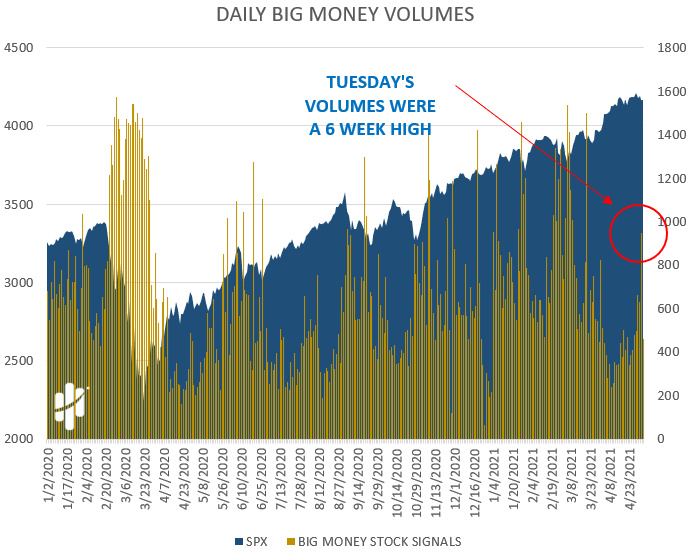
Tuesday and Wednesday showed significantly increased volumes coupled with a fat sector rotation.
As growth stocks take a beating, other areas are just fine, such as: Financials, REITs, and dividend growth. As the Big Money Index signals red, this could be just another rotational rampage, like we saw last November.
The BMI can’t fall until there is broad selling.
The data doesn’t show that… at least not yet.
Big Money Index Signals Red
“So why is the BMI red now?”
You may be confused thinking: “doesn’t the BMI flash red when it’s overbought?”
I told you above that being overbought itself is not a sell signal. That’s because the real signal is when the BMI starts falling. The BMI is flashing red now because it’s stalling.
Heading into this week, the BMI was in a clear uptrend. The last 2 days of selling in growth stalled the rise.
Remember, the BMI measures buying vs. selling in stocks (subscribers can monitor it in real-time here). A rising index means there are more buyers than sellers over the past 25 days. A falling index means sellers have the helm.
Today we see neither. We now have what appears to be a flat-lining BMI after a big run-up, and there’s only one thing holding it down:
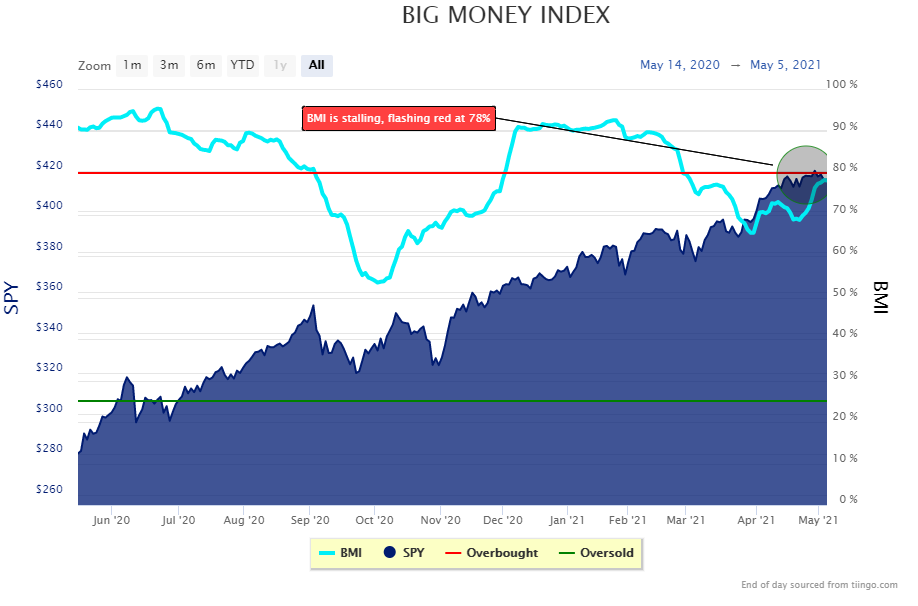
Had we not had growth stock selling the last 2 days, the BMI would now be overbought.
So, taking this all in, the Big Money Index signals red because it is stalling. Like seeing a flashing-red light ahead…you slow and proceed only when clear.
To see how to proceed, let’s start with stock trading.
Stocks See Value Over Growth Rotation
For the real picture, we look at daily buys and sells. Tuesday’s market selloff stuck out for a few reasons.
First, it was the biggest outsized volume trading day in 6 weeks. We circled that off to the right in our Daily Big Money Volumes chart below. Sudden big volumes usually means new trends are starting:
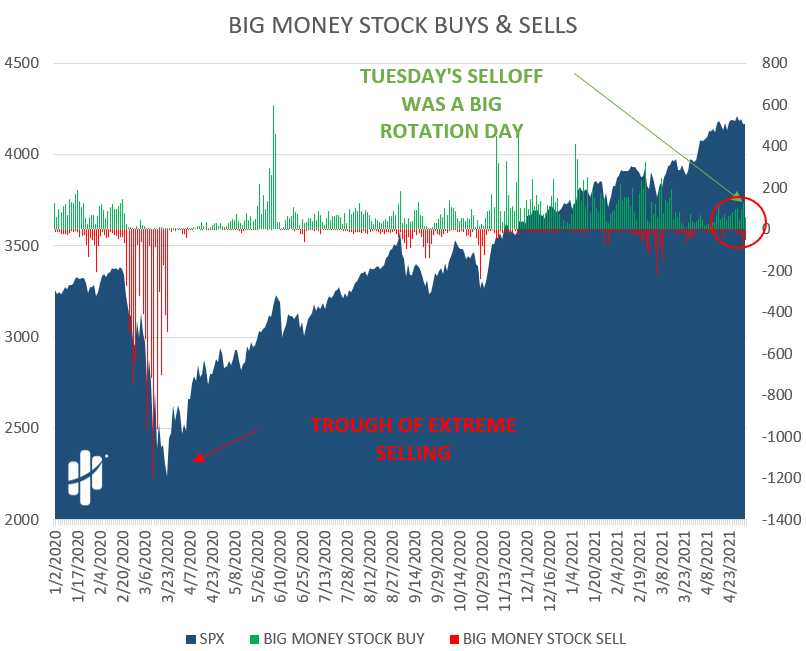
2nd was that Tuesday was the largest sell-day in 8 weeks, but that’s only part of the story.
3rd was that Tuesday was also the largest buy-day in 7 weeks!
Check it out below on our Big Money Stock Buys & Sells chart. Off to the right you see the red and green:
Let’s zoom in:
This price action is eerily similar to what happened in November once news broke of a 95% effective COVID-19 vaccine. While that started the scramble for reopen/value stocks, it was a red light for growth stocks.
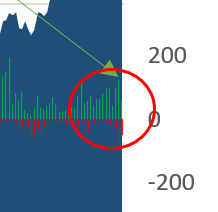
Let’s look at a final measure of market breadth: ETF buys and sells (subscribers can monitor this too in real time here).
For now, ETF buyers are still in control:
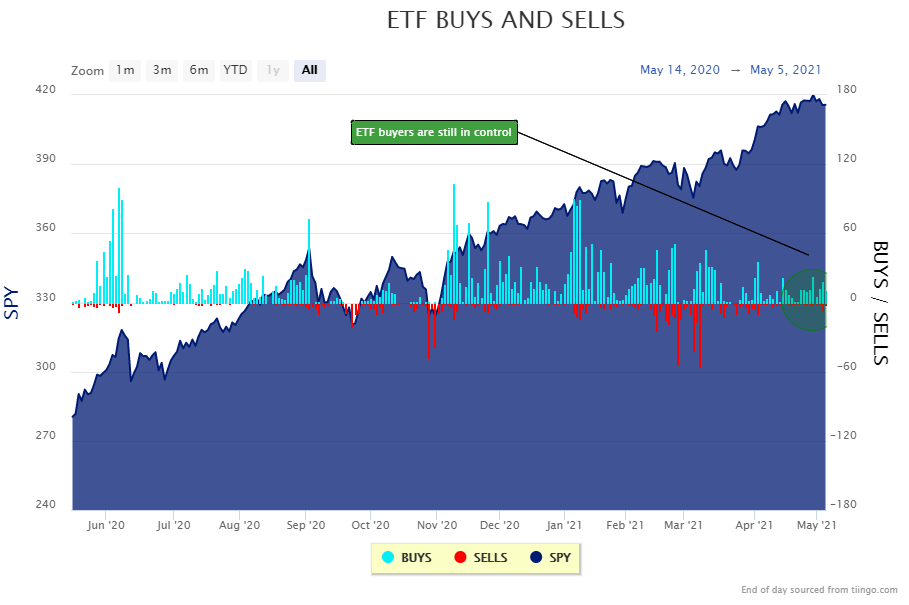
But it’s what is getting bought that is important. This week, we’ve seen heavy buying in ETFs focused on:
- Dividends
- Bonds
- Short-term Inflation Protection
- Financials
- Commodities
Notably absent are growth-centric ETFs.
Now we have a setup. Under the surface there’s much going on. In some ways the data is conflicting:
- a stalling BMI
- growth selling
- buying elsewhere
To us the message is clear: This is a big rotation yet again.
So, let’s wrap this up.
Here’s the bottom line: Tension is in the air. Sentiment is getting increasingly negative with time. Not all stocks are rising like they were just a few months ago.
The BMI is nearly overbought but suddenly stalling. The last 2 days changed our data’s tone. Value stocks are getting bought. Growth stocks are getting sold.
So, what’s next? For a sell alert to trigger, we need to see more deterioration.
Jason and Luke discuss this in our latest podcast: Big Money Index Flashing Red.
Look: As long as there’s big buying and big selling, our bear suits stay in the closet- we don’t wear them unless absolutely necessary.
To us, this price action shows money managers repositioning risk for a reopening economy.
Our playbook is simple: wait for the Big Money Index to begin falling before we change our tune. Only then will the trend really change.
Stocks are approaching a red light. Let’s pause a minute and look both ways before proceeding.
Pullbacks are inevitable so it’s smart to start planning now. Build your buy list and look for overweight risk areas to trim. Failing to plan is planning to fail.
On the flipside, don’t press the brakes in fear for too long: Eventually there’s always a green light.
And people stopped for long want to go fast. That’s how rallies come.
They say if you mess with the bull, you get the horns. The BMI should tell us when the bears come, but they always get chased away by bulls.
We’ll alert you when and if the trend shifts, but we always end up running with the bulls.