
The True Cost of Higher Mortgage Rates
You’ve probably heard that higher interest rates hurt the stock market.
It’s true. When the cost of capital increases, many businesses feel the heat.
But what about the average Joe? They feel the pressure too, especially when it comes to new home ownership. Today we’ll cover a topic discussed at many dinner tables right now: the true cost of higher mortgage rates.
Earlier this month, Alec Young wrote about the importance of the 2-year treasury yield as it relates to growth stocks. Basically, as long as rates are rising, it’ll put pressure on the Fed to keep its hawkish stance of more aggressive rate hikes.
Just yesterday the Fed raised rates 75bps, taking the Fed funds rate to 3.25%.
But get this, since that post from September 12th (10 days ago), the 2-year treasury yield climbed from 3.5% to 4.1%. The tech-heavy NASDAQ 100 (Invesco QQQ ETF) got clobbered in that same timeframe, falling an incredible 8.58%. No doubt about it, stocks react to rising yields.
But it’s not just treasury yields to be aware of: Mortgage rates have surged to multi-year highs. That means, the cost to buy a home is skyrocketing, making home ownership unaffordable for many.
Today we’ll quantify how much of an impact higher mortgage rates have on home buyers. You’ll likely be surprised at the findings. Then we’ll cover areas of the market to overweight in these rocky times.
The True Cost of Higher Mortgage Rates
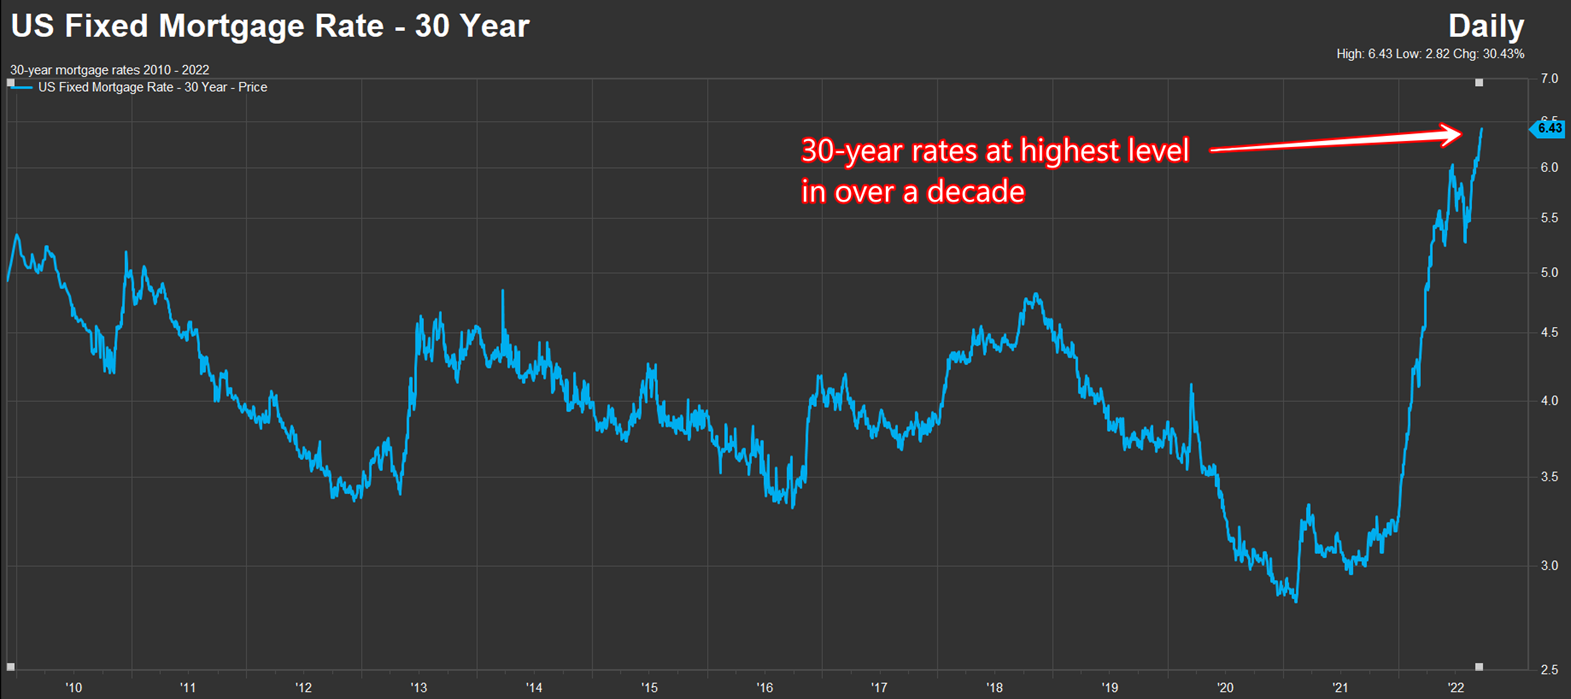
Turn on any financial news channel and odds are you’ll see a the latest 30-year fixed mortgage rate. The upward move recently is breathtaking.
Below is a chart of the 30-year mortgage rate from 2010 to now. The last tick shows 6.43%.
Notice how the rate on a mortgage has reached the highest level in well over a decade. More importantly, the yield has doubled since December when the rate was 3.19%:
Source: FactSet
The magnitude of the move in 2022 is incredible. Many people may wonder, “what’s the big deal with a 3% spike in mortgage rates?”.
As I’ll show you, every 1% climb in mortgage rates has a massive effect on the monthly mortgage note. Additionally, and likely less understood, it has a huge cost on wealth creation.
The below graphic illustrates these points.
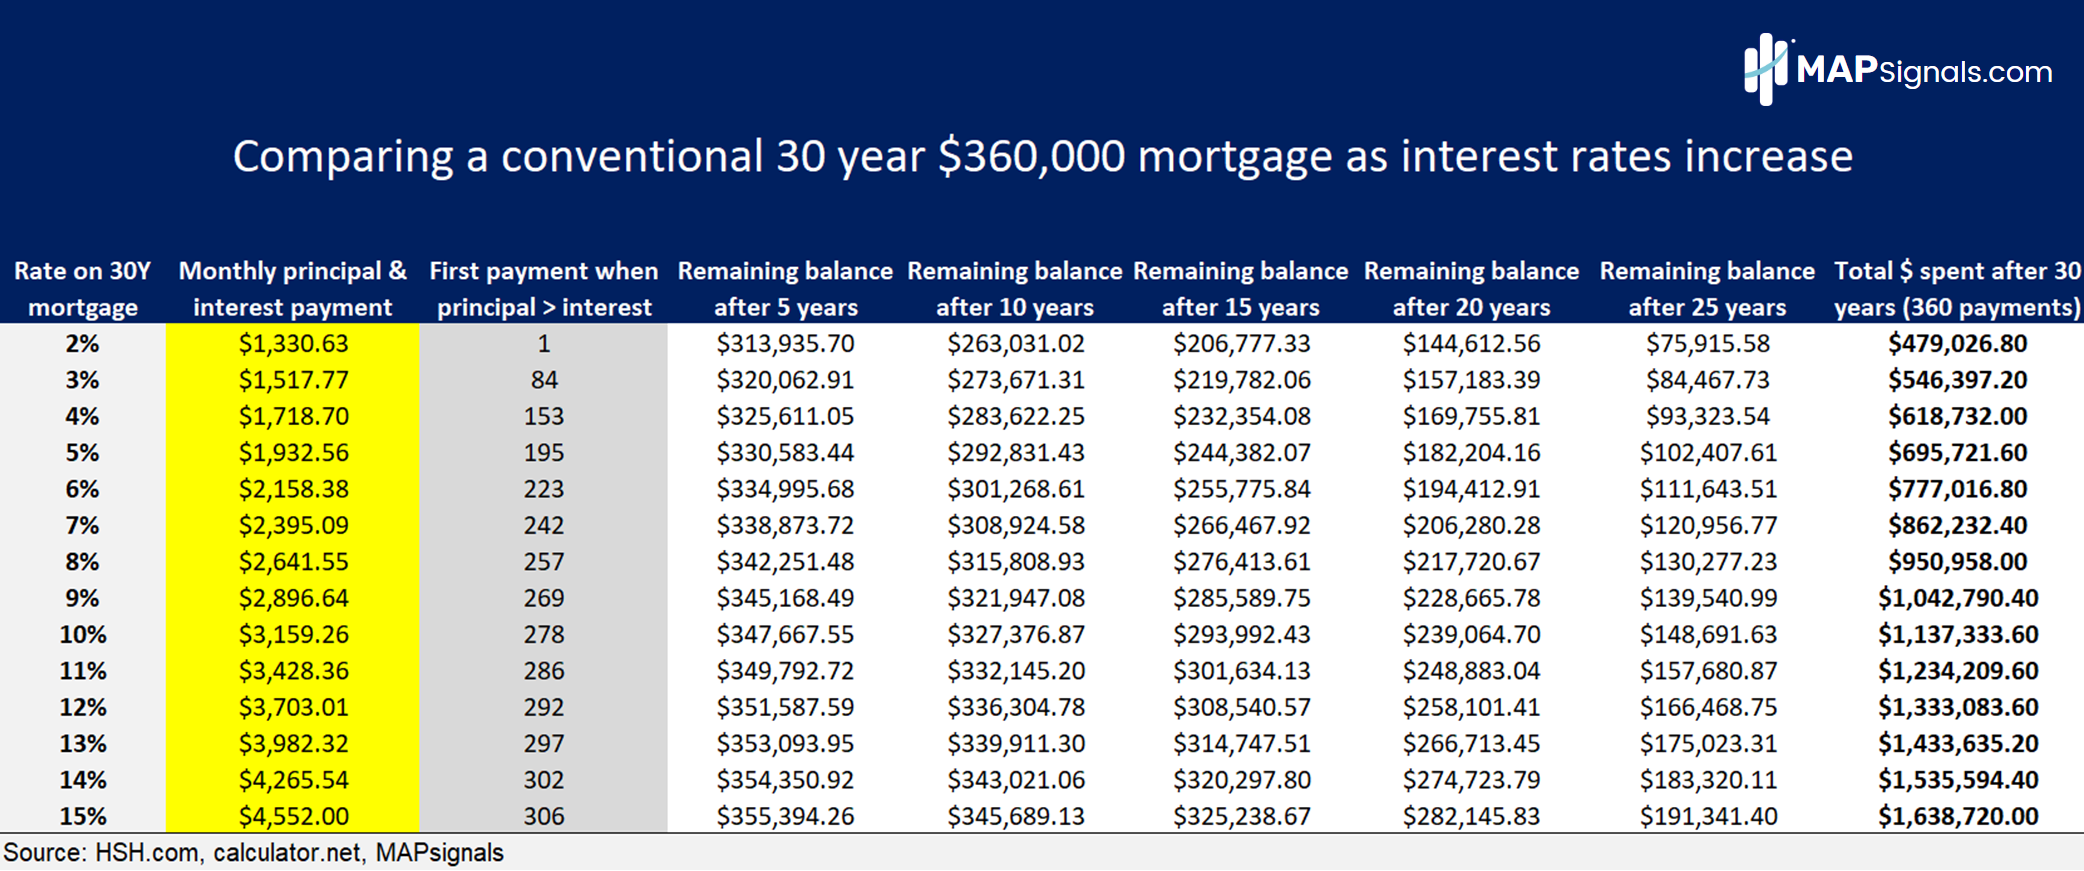
As an example, I’ve used a conventional 30-year mortgage, borrowing $360,000. That’s the loan amount financed on a $450,000 home, post a 20% down-payment. Keep in mind this illustration calculates principal and interest costs only (not insurance or taxes).
This chart compares the costs of the same loan amount but with interest rates ranging from 2-15%. Some of you from the ‘80s likely recall when rates were in the teens!
From left to right, you’ll see the mortgage interest rate and monthly payment. Next, you’ll find the payment number when principal is greater than interest. Further to the right, you’ll see the remaining balance on the loan after 5, 10, 15, 20, and 25 years of payments.
Lastly, to the far right, is the total dollar amount spent during the life of the loan:
As mortgage rates rise, there’s a compounding effect on the overall cost of the mortgage. Let me show you what I mean.
A $360,000 mortgage made late last year at 3% has a monthly principal and interest payment of $1517. After 15 years, there’s a balance of roughly $220k left on the loan, leaving $140k in equity in the home. After 30 years, the total money spent is $546,397. Not bad.
Compare that to a 7% mortgage in today’s environment. The monthly payment jumps to $2,395. And after 15 years, the balance on the home is $266k. Home equity at this point is only $94k. After 30 years, the total outlay increased $862,232, or nearly 58%!
At 10%, that $360,000 loan will cost $1.137mm over the loan term, doubling the cost of a 3% mortgage. The numbers add up fast.
Clearly, a few percentage points have a massive cost over 3 decades. And that means there will likely be less buyers for homes near-term. The American dream is becoming unaffordable.
As it relates to the stock market, these higher costs mean less discretionary spending in this tighter market environment. So, where should investors invest?
As I said last week, until the macro landscape improves, focus on sectors that can hold up in turbulent environments. Until interest rates backup, growth areas will suffer.
High-dividend groups like Utilities, Healthcare, and Staples offer ballast given their historical lower volatility and pricing power.
Additionally, consider an allocation to Energy stocks. Russian war and supply constraints should keep Oil & Gas prices elevated near-term.
And most importantly, these are the areas the Big Money is piling into. It’s always a good idea to have data on your side.
Below are the MAPsignals ranks by sector. These are the average scores of all stocks in our universe for the given sector. Energy, Utilities, Staples, and Healthcare claim the top spots:
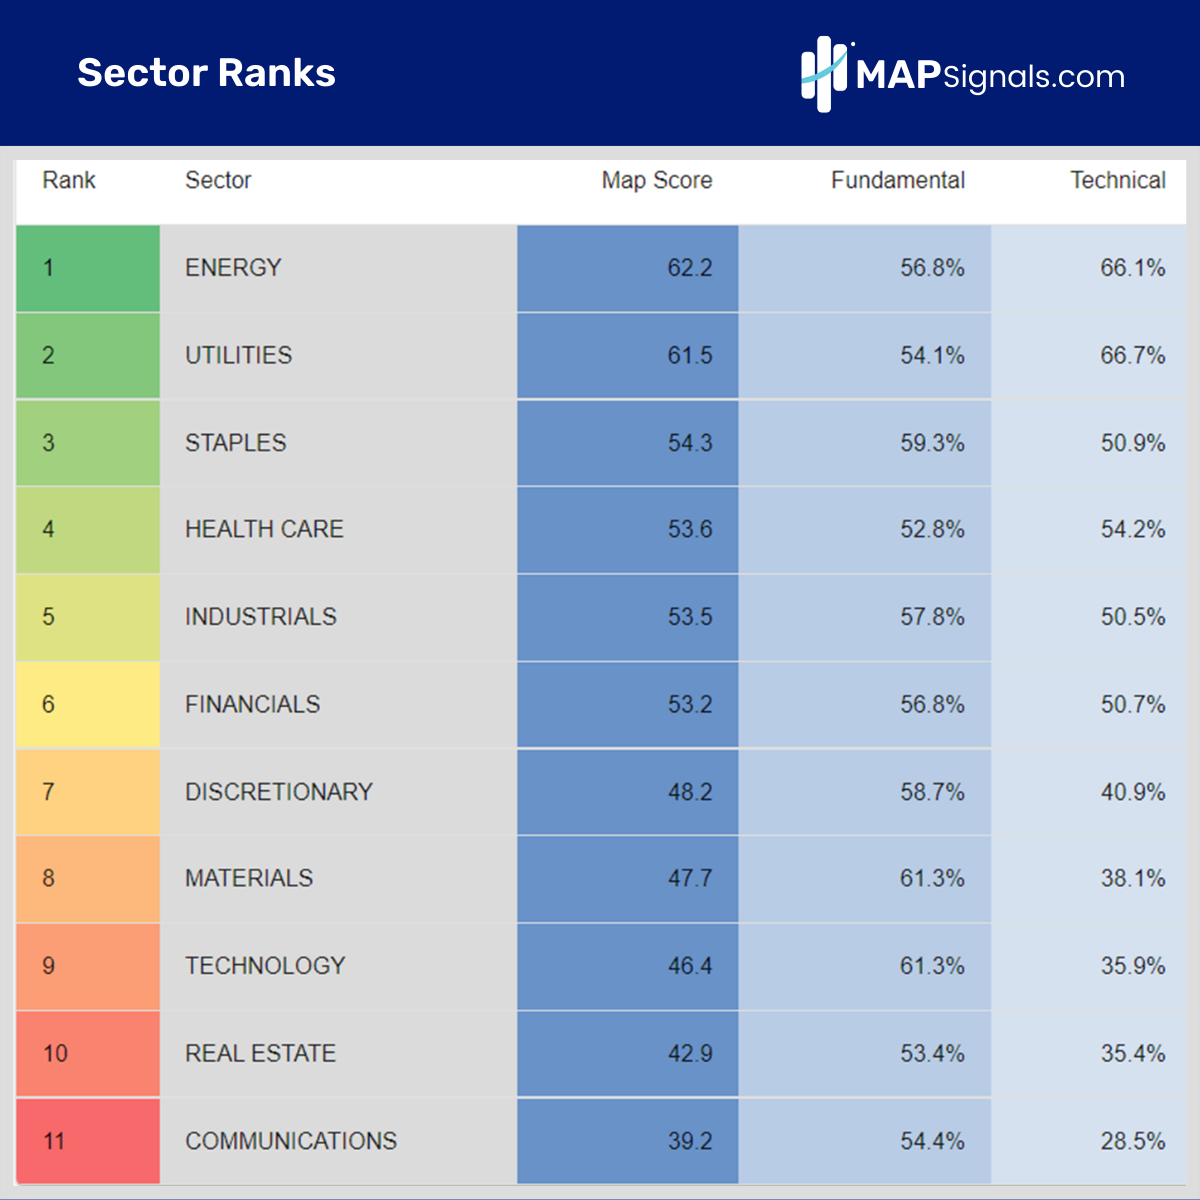
Given the cost headwinds the consumer is facing with rising mortgage rates, these 4 groups are likely to still be part of any budget.
Let’s wrap up.
Here’s the bottom line: Rising rates hurt stocks. Mortgage rates have soared to levels not seen in over a decade. A mortgage made today at 7% costs 37% more per month than it did late last year when rates were at 3%.
Costs only compound as rates rise.
When home buyers have less money in their budget, focus on defensive sectors that can thrive in any environment like: Utilities, Healthcare, Staples, and Energy. That’s where the Big Money has been placing its chips.
And many of our top ranked stocks are in those areas, many making new highs recently.
If you’re wanting our top stock ideas, we automate our top ranked stocks list every day here for Platinum subscribers. There are leaders out there and the Big Money process spots them.
Get started with a subscription today!