• Menu
  • Skip to right header navigation
  • Skip to main content
  • Skip to primary sidebar
  • Skip to footer

MAPsignals

We map big money.

  • Latest Insights
  • Power of MAP
    • MAP Products
    • MAP System
    • MAP White Papers
    • Videos & Interviews
  • Profit with MAP
  • About
    • About MAP
    • MAP Team
    • Authors
    • MAP System
    • MAP Products
    • Big Money Index
  • Members
    • Get Started With MAP
    • My MAP
    • Big Money Charts
    • MAP View
    • MAP View Options
    • MAP Top 20 Weekly
    • MAP 50
    • Member Updates
    • Platinum Updates
    • Members Only Posts
    • Performance
  • Portal

Through The Looking-Glass

December 17, 2020 //  by Lucas Downey//  8 Comments

Commonplace actions yield conventional results…

Exceptional results often require a different perspective, like gazing through the looking-glass.

Lewis Carroll is beloved for his smash-hit novels, Adventures in Wonderland and Through the Looking-Glass.  He told stories that seemed odd and unconventional at the time. In the first, Alice descends a rabbit’s hole into a literal wonderland full of eccentric types of characters. In the latter, Alice experienced a world in reverse.

Carroll eventually became celebrated as a genius. What eventually elevated him from average writer was from thinking outside the box. Let’s be frank, had he written about everyday normalcy, odds are his art would not still be celebrated today.

And that brings me to the stock market. 2020 was everything but conventional. Stock prices started out racing to new heights, then fell to extreme lows, only to blast into the stratosphere.

To make sense of that insanity, investors can try the normal lens of news and conventional explanations. But doing so will likely yield conventional results.

For something exceptional, you may just need to throw normal logic out the window. You need a new angle. And MAPsignals spent decades developing a looking-glass for the stock market. We see the world through the view of Big Money.

THROUGH THE LOOKING-GLASS

Down the 2020 rabbit’s hole we go! But before we go forward, we must see where we’ve been…

Big Money Index Through The Looking-Glass

Alice: “Would you tell me, please, which way I ought to go from here?”

Cheshire Cat: “That depends a good deal on where you want to get to.”

Alice: “I don’t much care where”

Cheshire Cat: “Then it doesn’t matter which way you go.”

The Big Money Index is now overbought for 2 weeks since December 3rd:

big money index

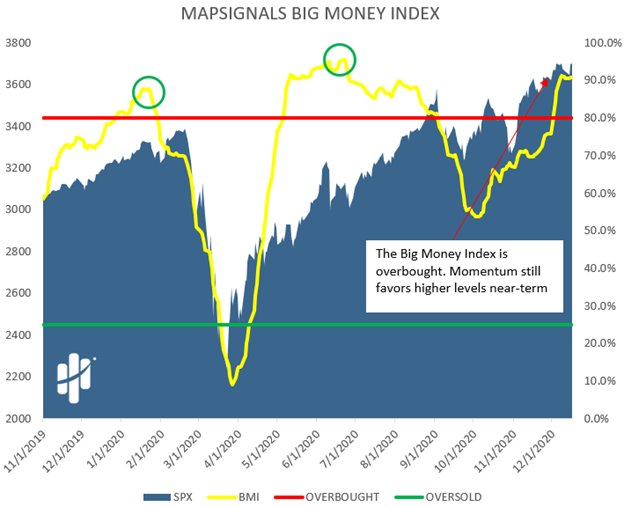
Of course, that’s not news to our followers. We’ve been harping on Big Money momentum for well over a month now. The key is when you look at cold hard data like we do, it gives us a different perspective. It can differ wildly from the dizzying and often confusing headlines. Our data-driven perspective was different when we said that we have liftoff on November 5th.

Telling anyone who would listen to expect market juice, illustrates how powerful different viewpoints can be. Looking at mainstream headlines showed uncertainty and volatile times ahead.  But we peeked through the looking-glass of Big Money and saw new highs coming.

That’s one example. 2020 was much wilder than that! So, was the Big Money lens giving us a different view than the news?

Through the looking-glass we look…

If you’re memories of big market-moving headlines in 2020 are fuzzy, here are a few to remind you of:

  • January 16th New York Times: Stocks Continue Record Climb as Earnings Overshadow Impeachment
  • January 30th – Coronavirus claims more lives. “The number of Coronavirus deaths rose to 132 on Wednesday in China, up from 106 on Tuesday. About 6000 confirmed cases of infections also came in, which induced further panic in the country. As of now, five cases of the illness have been confirmed in the United States.” (Yahoo!)
  • February 27th – Dow plunges 1,100, worst point drop in history, will Fed act? (CNBC)
  • March 20th – Central Banks Inject Massive Stimulus (Yahoo!)
  • April 20th – Experimental Drug Resulted in “Rapid Recoveries” (Yahoo!)
  • May 29th – Powell: Fed is ‘days away’ from making first loans to Main Street (CNBC)
  • June 29th – Fed opens up second part of its corporate bond-buying (CNBC)
  • July 20th – US coronavirus deaths top 138,000 (Yahoo!)
  • August 31st – Dow & S&P 500 book best August in 36 years (Marketwatch)
  • September 21st – Stocks sink as September Gloom continues (Yahoo)
  • October 30th – October was worst month for Dow since March as coronavirus was spreading (CBSNews)
  • November 18th – Uncertainty over fresh stimulus (Yahoo)
  • December 3rd – Stock ETFs Attract Record Inflows During November (Yahoo)

Now for a different view, here they are overlaid on the Big Money Index:

BIG MONEY INDEX THROUGH THE LOOKING-GLASS

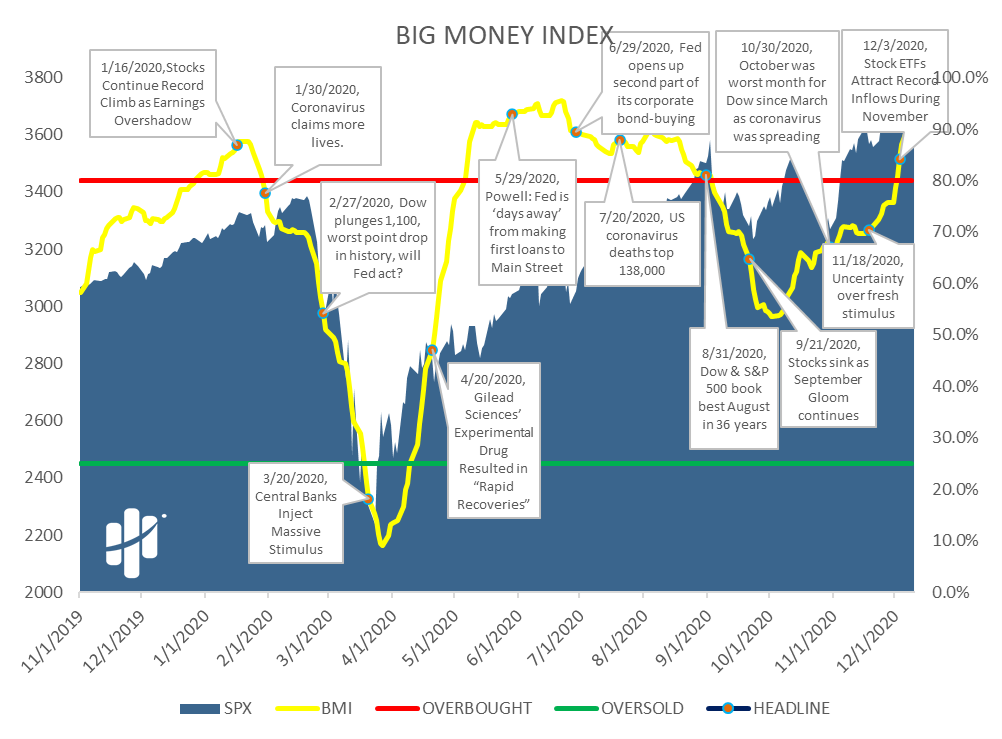
Remember: conventional analysis should produce conventional results. Through the looking-glass of Big Money we were able to navigate without emotion to an entirely different conclusion.

That’s how we’re able to anticipate future market prices; like we did in late January. Back then our data signaled Ch-Ch-Ch-Changes and we foresaw lower market prices.

It works the other way too. Like on March 19th when our data said to send the marines. The looking-glass view of Big Money allowed us to spot big opportunity.

So, what view does the looking-glass give us today?

Phases Of Big Money

March Hare: Start at the beginning.

Mad Hatter: Yes, yes. And when you come to the end… STOP. See?

It’s essential to understand that Big Money flows in phases. Supply and demand constantly move from one extreme to the other… much like the tides that ebb and flow.

There are 4 broad phases which are detailed below. Two weeks ago, we entered phase 1, where buyers are in firm control and sellers are non-existent:

phases of big money

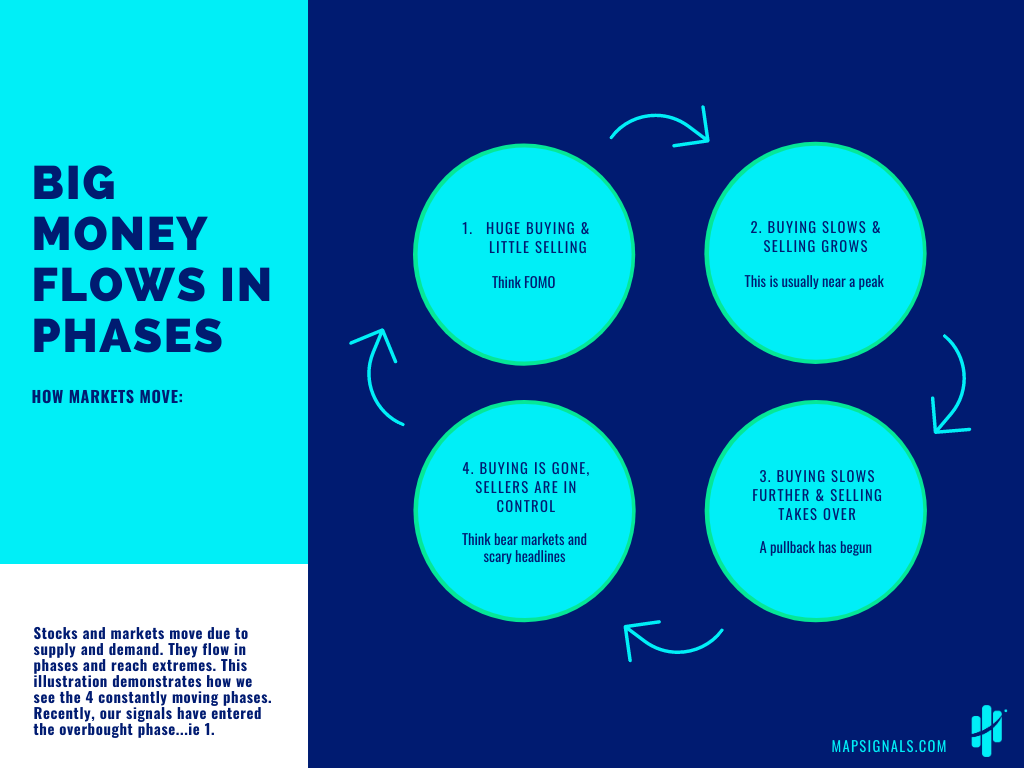
Overbought markets hang around in phase 1. Markets can stay overbought for a while once they get there. It becomes the investing bonus level, where long-term investors tend to rack up lots of points in their portfolios. But beware: you want to use caution. Pick your spots wisely and be nimble when markets are at stratospheric levels like up here. Stocks are very elevated right now, but can stay that way.

Eventually, we’ll enter phase 2 where buying slows and selling grows. Odds are that hardly any conventional headlines will signal those changes. The looking-glass of Big Money should give us clearer hints, though.

Which brings me to my final thought.

MAP 50 Through The Looking-Glass

White Queen: “Why, sometimes I’ve believed as many as six impossible things before breakfast.”

One of our most popular research pieces is our MAP 50 report. While highlighting the best stocks, it removes a lot of the noise.

It’s created by ranking the 50 stocks that appeared the most frequently on our Top 20 lists the prior 6 months. Quite literally, we stare through the looking-glass of our data to build it each month.

Oftentimes looking back can guide us for the future. For example, we just released the MAP 50 for December, and in it (and each month) we provide the prior report’s performance.

Here’s the performance of the November MAP 50:

MAP 50 DECEMBER 2020

The average gain of the MAP 50 stocks in November was ~+10%, while the S&P 500 (SPY ETF) returned only +0.58% over the month! That’s a 17x outperformance… mega juice!

Alice: “This is impossible.”

Mad Hatter: “Only if you believe it is.”

The Bottom Line: understanding markets requires analysis. Conventional analysis yields conventional results. For something exceptional, it requires a different vantage point. Our edge is peering through the looking-glass of Big Money. You can’t find that anywhere else just as you won’t read about wonderland anywhere else.

We chatted about this and other great insights just yesterday in our podcast, Investing Has Changed Forever.

Odds are none of us would know Lewis Carroll today had he went the traditional route for writing.

We like to think outside the box here.

As the markets ebb and flow, the masses follow the mass-media. We choose to travel through the rabbit’s hole and peer through the looking-glass of Big Money.

Wherever it leads, we’ll follow.

Carroll said, “If you don’t know where you are going, any road will take you there.”

We follow the road of Big Money to get to where we ought to be…

Lucas Downey
Lucas Downey

Lucas is co-founder of MAPsignals. His full bio can be found here.
Prior to MAP, he was Head of ETF Sales at Cantor Fitzgerald & SVP of Derivatives at Jefferies, LLC.

Spread the word!

Category: All, Big Money Insights Weekly

Previous Post: «big money podcast Investing Has Changed Forever
Next Post: Highlight Reel highlight reel»

Reader Interactions

Comments

  1. Robert

    December 17, 2020 at 2:12 pm

    What do you think about Bitcoin in 2021?

    Reply
    • MAPsignals Staff

      December 17, 2020 at 2:17 pm

      We aren’t big crypto folks. Why?

      We can find the same or better gains in stocks. Stick to what you are good at…right???

      Reply
  2. Vladi

    December 17, 2020 at 7:04 pm

    Guys, do you want to have your own “MAP50” ETF ?

    Reply
    • MAPsignals Staff

      December 17, 2020 at 7:20 pm

      That would be cool. We haven’t had any discussions about it. But, ticker TAGU sounds about right 🙂

      Reply
      • Jason

        December 18, 2020 at 9:51 am

        TAGU!!!!

        Reply
  3. Vladi

    December 18, 2020 at 1:19 am

    TAGU would be awesome! When I told about mapsignals to a friend of mine, 1st question he asked: “Do they have an ETF?”. Investing Has Changed Forever, man.

    Reply
  4. Jeffery

    January 3, 2021 at 5:02 pm

    Hey there Gents. Welcome to 2021!
    Just wondering if you have any analysis of the Map 50 report based on a monthly, quarterly, semi-annual, or annual rebalance to the new weightings? It would be super interesting to know how these 50 stocks would have done if rebalanced monthly.
    Thanks!
    Jeff

    Reply
    • MAPsignals Staff

      January 3, 2021 at 6:36 pm

      Hey Jeff –

      We haven’t done any analysis other than tracking how the portfolio of 50 stocks performed each month since April when we began the MAP 50.

      From what I can see, SPY is +35.68% since then vs. +58.83% for rolling each basket.

      To calculate the MAP 50 returns we simply compounded the monthly returns of each basket. The monthly returns for all 50 stocks is listed in the next issue. Meaning, April’s return is listed in the MAY 50 post, etc.

      We haven’t done any deep dive into this other than the above, but it sounds like we should!

      Reply

Leave a Reply Cancel reply

Your email address will not be published. Required fields are marked *

Primary Sidebar

Get Big Money Insights for FREE

Want to know where the Big Money is headed?

Just enter your email address below. You'll get our FREE NEWSLETTER sent directly to your inbox.

We call it Big Money Insights... It’s your weekly sneak peek at the powerful market-moving forces that are hidden from 99% of investors.

"*" indicates required fields

This field is for validation purposes and should be left unchanged.

Categories

  • All
  • Big Money Insights Weekly
  • Big Money Series
  • Macro Insights
  • MAP In The Media
  • Members Only
  • Performance
  • Podcast
  • Special Reports
  • Stocks
  • Videos & Interviews
  • White Papers

Archives

  • February 2023
  • January 2023
  • December 2022
  • November 2022
  • October 2022
  • September 2022
  • August 2022
  • July 2022
  • June 2022
  • May 2022
  • April 2022
  • March 2022
  • February 2022
  • January 2022
  • December 2021
  • November 2021
  • October 2021
  • September 2021
  • August 2021
  • July 2021
  • June 2021
  • May 2021
  • April 2021
  • March 2021
  • February 2021
  • January 2021
  • December 2020
  • November 2020
  • October 2020
  • September 2020
  • August 2020
  • July 2020
  • June 2020
  • May 2020
  • April 2020
  • March 2020
  • February 2020
  • January 2020
  • December 2019
  • November 2019
  • October 2019
  • September 2019
  • August 2019
  • July 2019
  • June 2019
  • May 2019
  • April 2019
  • March 2019
  • February 2019
  • January 2019
  • December 2018
  • November 2018
  • October 2018
  • September 2018
  • August 2018

Follow us on Twitter

MAPsignals Follow 1,434 1,061

MAPsignals is a data platform that tracks institutional money flows in stocks and ETFs. Sign up for free insights here: https://t.co/SaAVHjKC9J

mapsignals
mapsignals avatar; MAPsignals @mapsignals ·
1h 1621476848990359552

Pendulum has swung

Helene Meisler @hmeisler

Highest volume for the QQQs since 12/13

Reply on Twitter 1621476848990359552 Retweet on Twitter 1621476848990359552 0 Like on Twitter 1621476848990359552 0 Twitter 1621476848990359552
Load More...

Footer

© 2021 Mapsignals.com

  • Home
  • Contact & Disclaimer
  • Privacy Policy
  • Terms & Conditions
  • Opt-out preferences
  • FAQ

Copyright © 2023 · Mai Law Pro on Genesis Framework · WordPress · Log in

✕
What Happened to Risk Assets White Paper is Here

Get your copy here and take a journey through our thoughts on margin and leverage.

Enter your email address below and you'll get our FREE NEWSLETTER sent directly to your inbox. 

 We call it Big Money Insights... It’s your weekly sneak peek at the powerful market-moving forces that are hidden from 99% of investors.

MAPsignals
Manage Cookie Consent
We use cookies to optimize our website and our service.
Functional Always active
The technical storage or access is strictly necessary for the legitimate purpose of enabling the use of a specific service explicitly requested by the subscriber or user, or for the sole purpose of carrying out the transmission of a communication over an electronic communications network.
Preferences
The technical storage or access is necessary for the legitimate purpose of storing preferences that are not requested by the subscriber or user.
Statistics
The technical storage or access that is used exclusively for statistical purposes. The technical storage or access that is used exclusively for anonymous statistical purposes. Without a subpoena, voluntary compliance on the part of your Internet Service Provider, or additional records from a third party, information stored or retrieved for this purpose alone cannot usually be used to identify you.
Marketing
The technical storage or access is required to create user profiles to send advertising, or to track the user on a website or across several websites for similar marketing purposes.
Manage options Manage services Manage vendors Read more about these purposes
View preferences
{title} {title} {title}