
Two Sectors are Seeing Forced Selling
Prepare for more downside.
Two sectors are seeing forced selling.
Turn on the TV and you’ll assume stocks are doomed. I don’t recommend watching the tube. But if you’re inclined to do so, here’s a brief rundown of the bear-tinged headlines you’ll find:
- looming government shutdown
- rising interest rates
- UAW strike
- student loan repayment
Truthfully, the list goes on and on. Afterall, it’s the news. Pundits’ jobs are to explain why markets bob and weave.
Storylines sell…
Just don’t buy it.
These doom-loop narratives are commonplace during weak markets. Bearish tales engulf the crowd, setting off growling echo chambers.
Searching for bright spots appears fruitless. That is, until you look at data.
While the overall picture of money flows suggests more pain ahead, two defensive areas are triggering levels of selling that forecast big gains ahead.
Money Flows Point to More Downside Ahead
My job isn’t to parrot the popular headlines. It’s to inform you on the flow of money. Following the money is where you’ll find clues to the market’s next move.
For months the trend has been one way: DOWN. Just last week I alerted you to the weakest breadth reading in months.
Then, the Big Money Index (BMI) sat at 41%. Today it’s at 39%.
A freefalling BMI tells you all you need to know.
Institutional bids for stocks are fading:
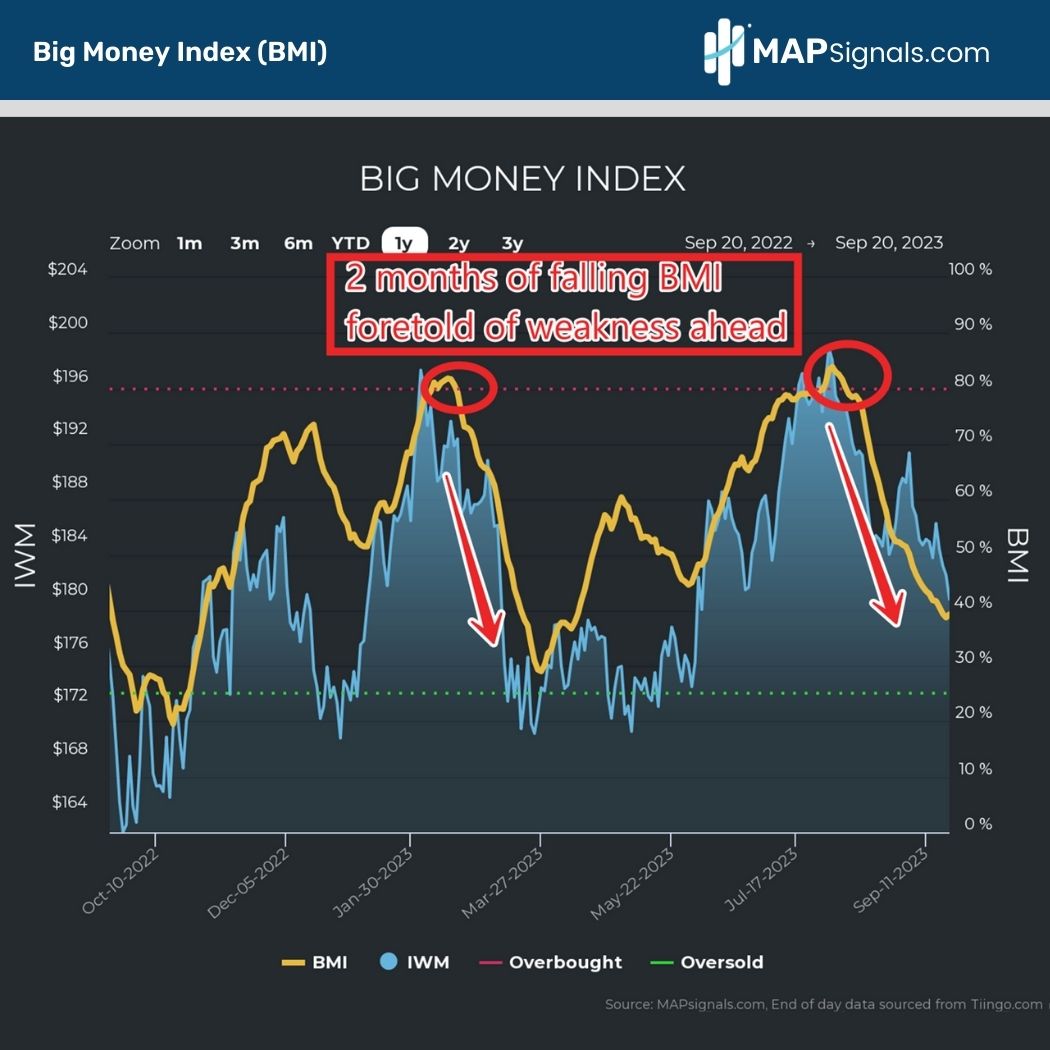
While the BMI appears to have stalled recently, chances are we’re not out of the woods. One look at the 10-Year yield signals we could be in for more near-term weakness.
As of this morning, the 10Y yield reached 4.47%, levels not seen since 2007:
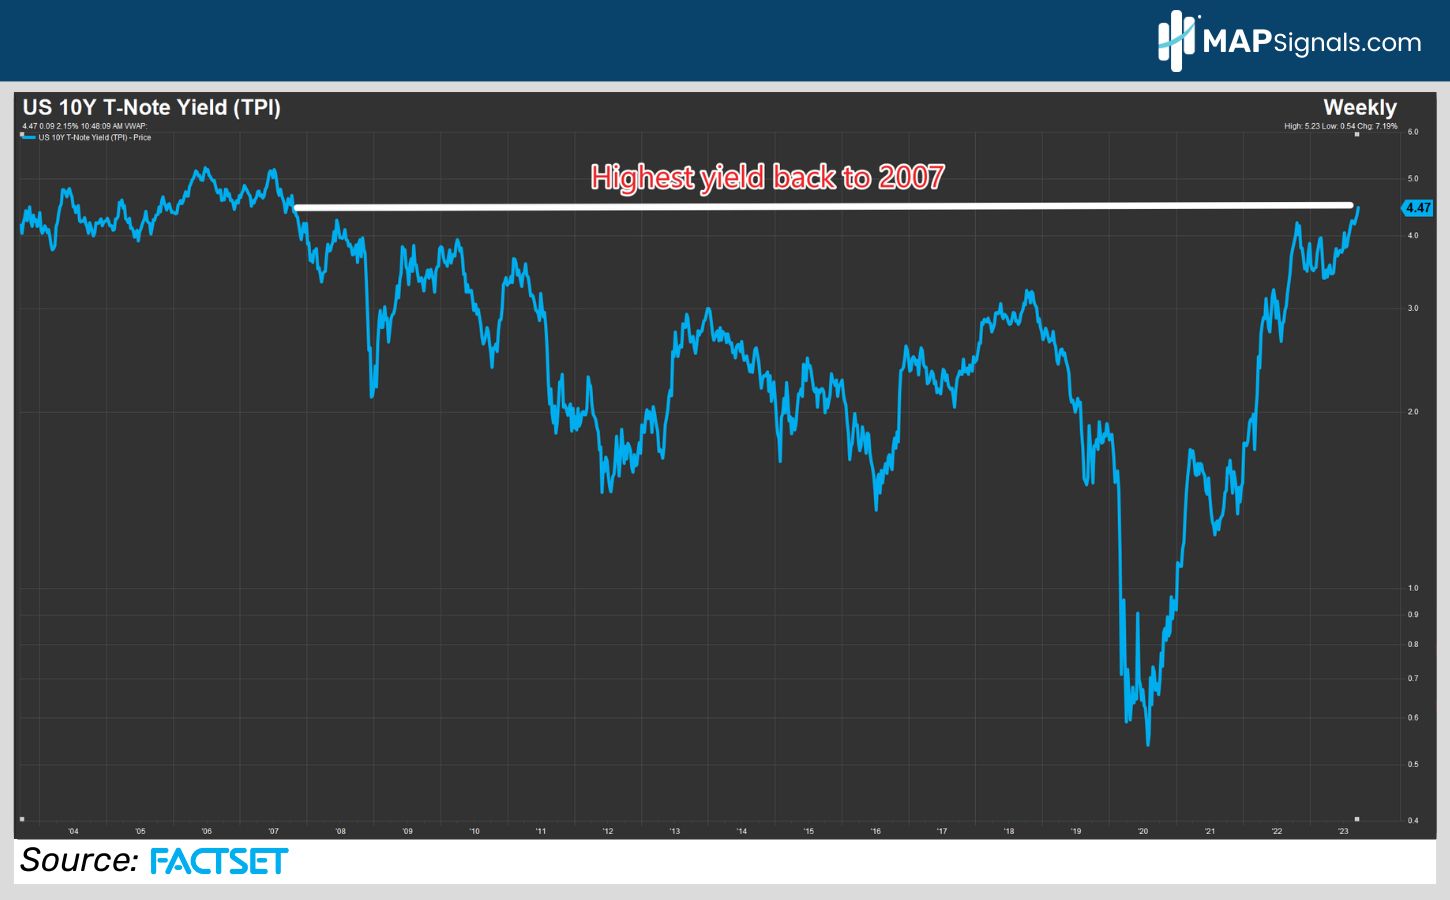
Higher yields can anchor stocks near-term. Rising interest rates can put downward pressure on equities. But as we wrote recently, history says rising rates won’t kill stocks.
That’s the main takeaway. In these murky macro environments, it’s critical to spot the opportunity.
When the tide is coming out of stocks as a whole, some areas are under immense sell pressure… pressure that rarely lasts. This is where data shines.
Two Sectors are Seeing Forced Selling
Under the surface of the BMI are thousands of stocks. Plotting the money trends offers you a real-time view of institutional appetite.
When you dive deeper and view sectors, you’ll find where pain points exist. The first of which is Utilities stocks.
Below plots the daily count of buys and sells in our Utility universe. Earlier this month we saw forced selling.
On September 5th, 26 discrete Utility stocks were sold. Out of a universe of 49, that’s a high sell ratio of 53%. That’s uber rare as you can see in the chart below:
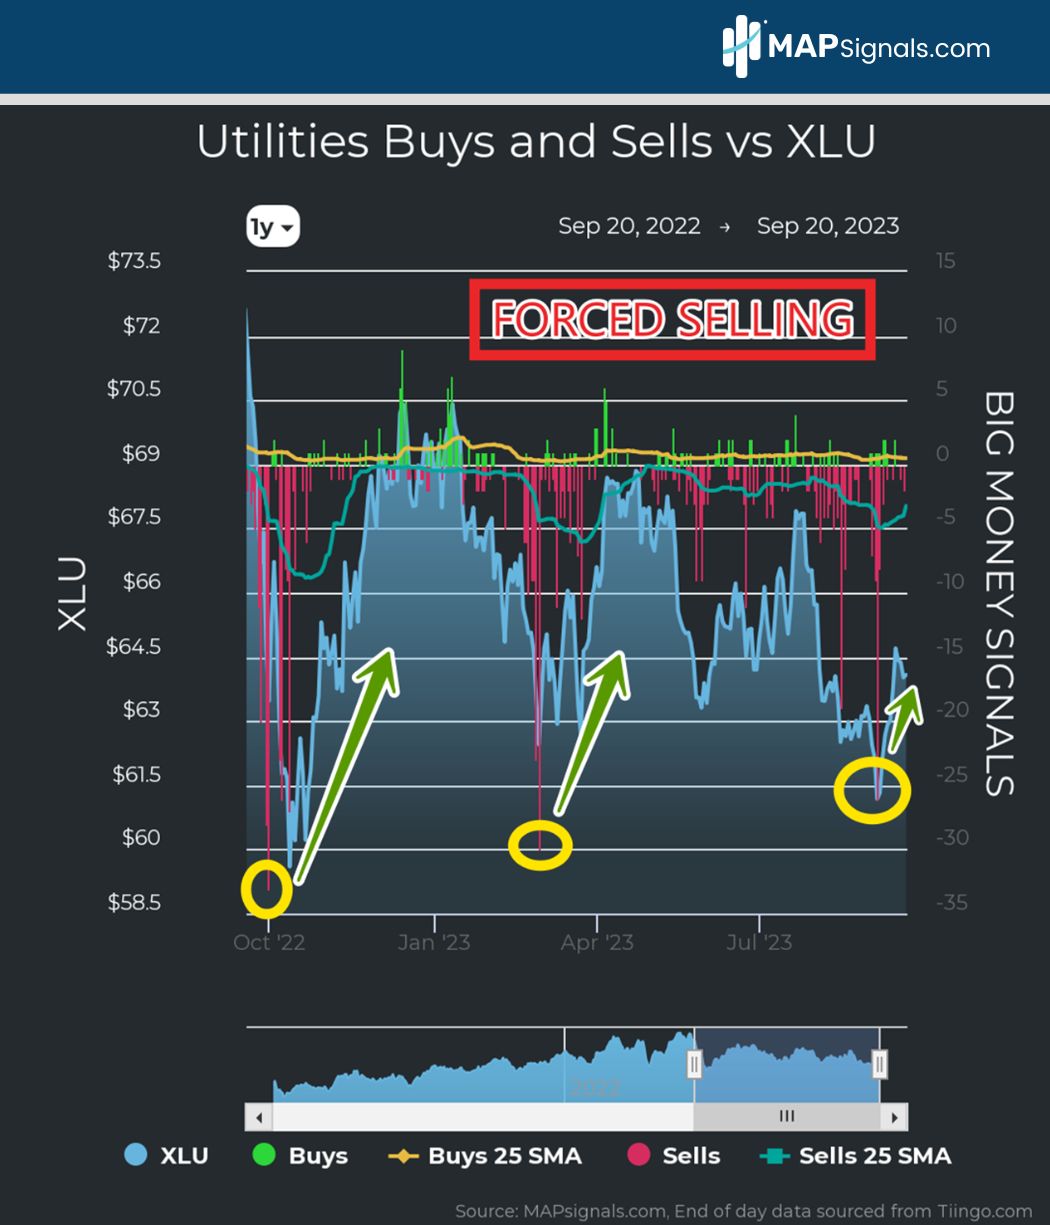
On the morning of September 6th, we alerted our MAP PRO members to expect a bounce in the group. As you can see in the above chart, a monster surge occurred.
Since then, Utility stocks ripped, as evidenced by the 4.73% gain in the Utilities Select Sector SPDR Fund (XLU).
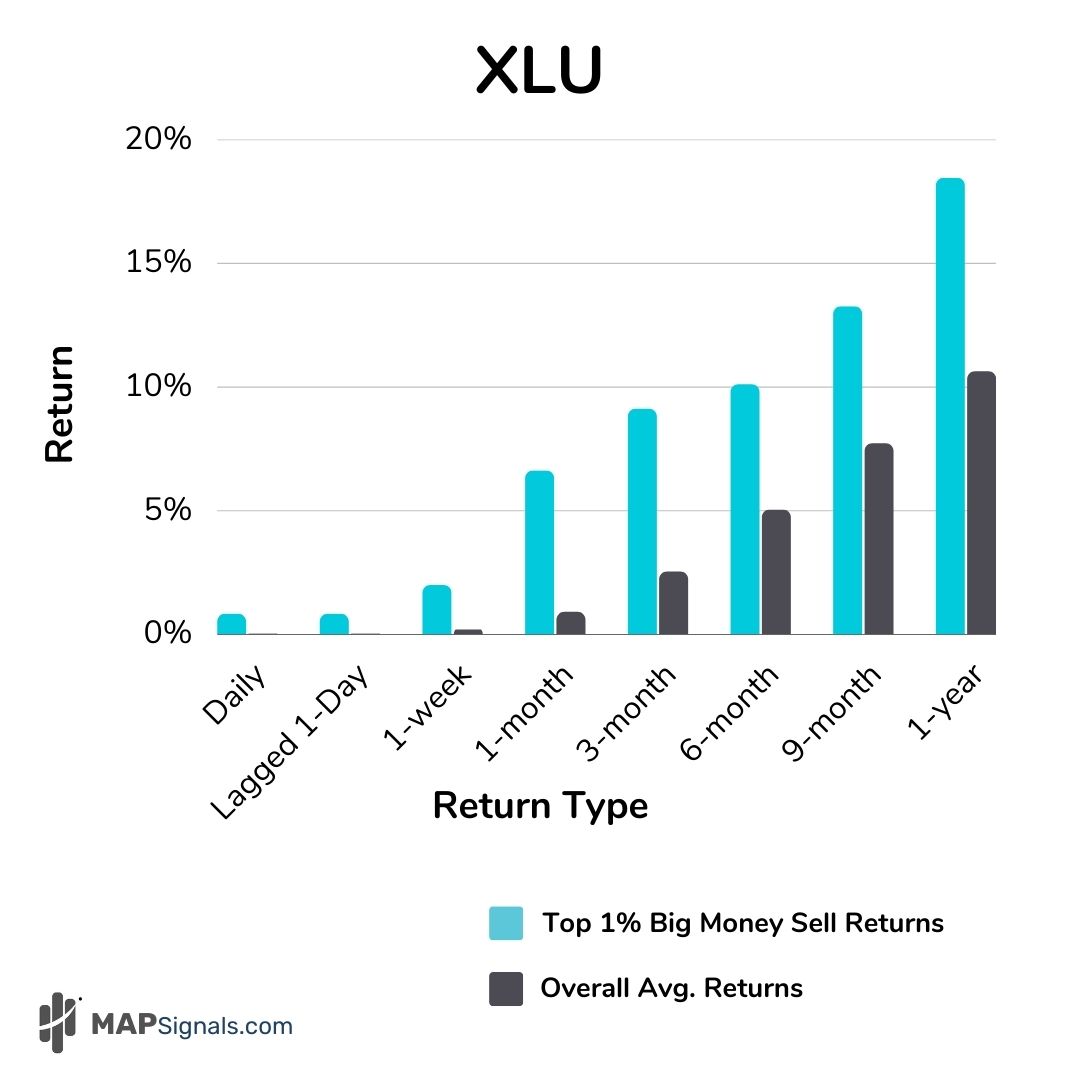
Back to 2013, whenever the daily sell ratio is 17.5% or greater, outperformance is seen. Below shows this beautifully as the blue bars represent forward XLU returns post forced selling episodes.
When you compare these returns to the expected average returns (Black Bars) it’s like comparing 2 different sports:
But we can’t stop there. Another defensive area is under attack: Health Care stocks. On September 15th, 39 discrete companies were sold.
This clocks in at a sell ratio of just under 19% given the universe size is 209.
The 1-year sector chart shows how rare this capitulation is:
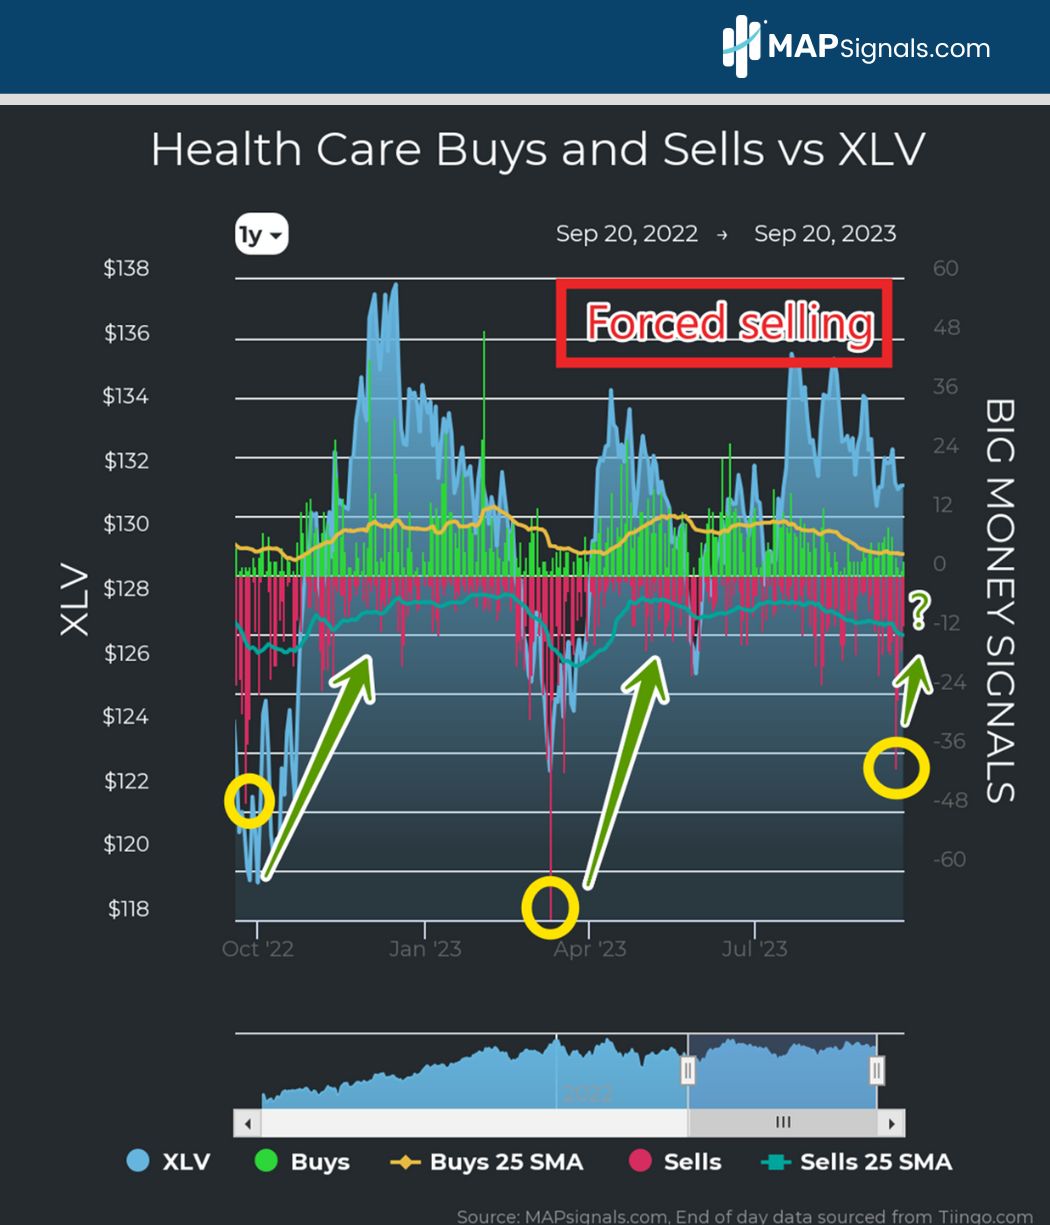
Like Utilities, forced selling offers a tremendous opportunity. Look how the sector ramps after prior risk-off events.
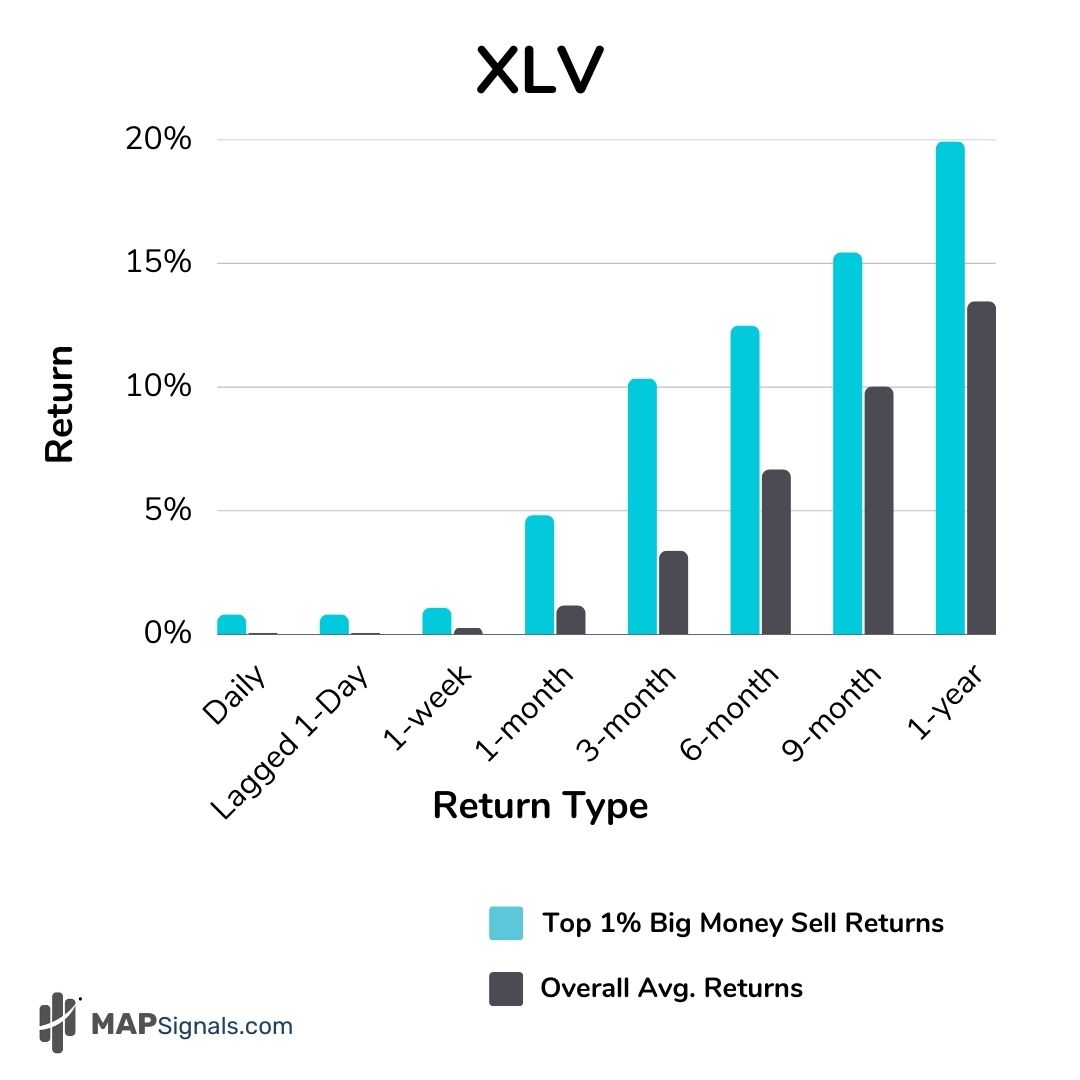
Below shows that since 2013, whenever the daily sell ratio reaches 7% or more, the Health Care Select Sector SPDR Fund (XLV) zooms relative to its expected returns:
Folks, this is why having data is so important. Media buzz words are there to paralyze you. They distract from what’s really taking shape: OPPORTUNITY.
The overall selloff in markets is not over. Capitulation can already be seen.
Two sectors are seeing forced selling.
Based on history, defensive groups like Utilities and Healthcare stand to outperform in the sea of red.
There are bright spots out there… use a map to find them.
Let’s wrap up.
Here’s the bottom line: Money flows point to more downside ahead. As the media feeds the endless bearish narrative, two sectors are seeing forced selling.
Health Care and Utility stocks reveal that institutional investors are tapping out… crying uncle.
That’s the opportunity.
Historical data shows that not only are these selloffs short-lived, they also offer a solid risk/reward setup.
Odds are we’ll see other sectors capitulation in the days ahead.
Instead of crying, I’ll be buying.
If you’re a professional money manager or are serious about investing in this tough environment, get going with a MAP PRO subscription.