• Menu
  • Skip to right header navigation
  • Skip to main content
  • Skip to primary sidebar
  • Skip to footer

MAPsignals

We map big money.

  • Latest Insights
  • Power of MAP
    • MAP Products
    • MAP System
    • White Papers
    • Videos & Interviews
  • Profit with MAP
  • About
    • About MAP
    • MAP Team
    • Authors
    • MAP System
    • MAP Products
    • Big Money Index
  • Members
    • Get Started With MAP
    • My MAP
    • Big Money Charts
    • MAP View
    • MAP View Options
    • MAP Top 20 Weekly
    • MAP 50
    • Member Updates
    • Platinum Updates
    • Members Only Posts
    • Performance
  • Portal

Big Money Index Should Hit Oversold Within Days

May 19, 2022 //  by Lucas Downey//  Leave a Comment

We’re in one of the most challenging market environments in years.

Stock prices keep falling. Sentiment is awful. Volatility remains amped. But here’s the positive news: The Big Money Index should hit oversold within days.

Big Money Index Should Hit Oversold Within Days

Look, there’s no denying the pain many investors feel right now. Not only are most stocks falling hard, but there’s a real chance the US slips into a recession. The consumer is under immense pressure.

Out-of-control inflation has investors spooked, clocking in at levels not seen in 40+ years. We’ve all felt it. Food and energy prices have risen sharply. And to make matters worse, the latest earnings reports from Walmart (disclosure long) and Target showed huge misses on the bottom lines.

The 2 retail giants both guided to increased pricing pressures, which resulted in lowered forward EPS expectations. Wall Street wasn’t happy with the message. Since stocks follow earnings, the weak reports sent their stock prices plunging. It kicked off the nasty selloff in markets yesterday.

These results show just how difficult investing has been in 2022. This bear market is sinking just about all stocks…even the stalwarts.

But there’s a silver lining for long-term investors: Relentless selling is what it takes to reach an oversold market.

History shows, these are the times to look for bargains.

Big Money Index Should Hit Oversold Within Days

It’s hard to nail down the exact moment when markets will trigger oversold. I tried to do it back in January, but Mr. Market had other plans.

Eventual leadership in Healthcare, Energy, and Materials caused the BMI to stall its fall. Then, big investors flocked to defensive areas. That type of rotational action kept the BMI range bound.

Only when buyers disappear, can we get a true oversold reading. We’re reaching ever so closer to the green line. The BMI currently sits at 30%:

Big Money Index | Oversold should trigger within days

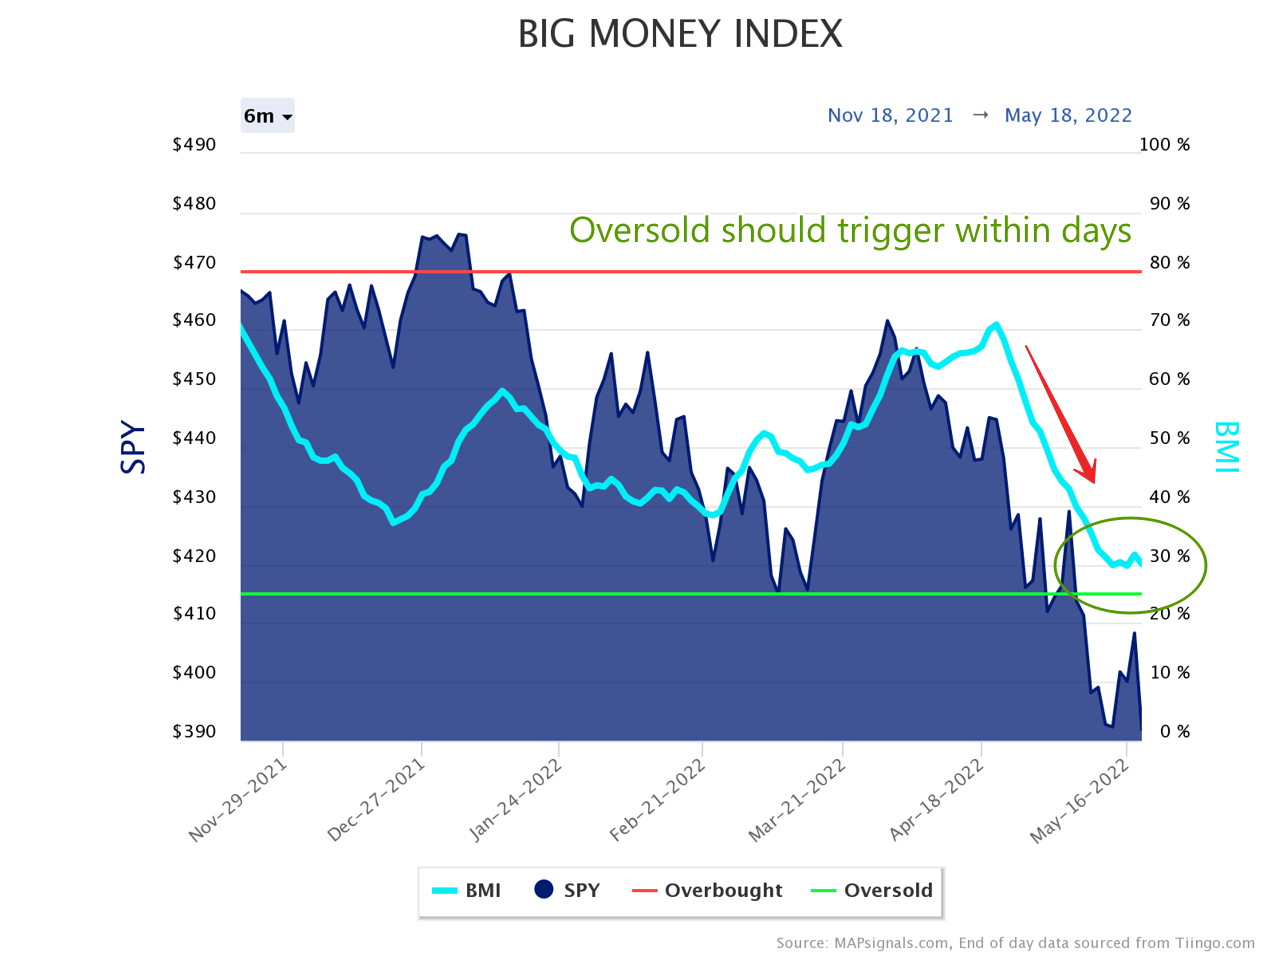
As a reminder, the BMI is a 5-week moving average of buys to sells. It’s a slow-moving line that was designed to reach the green zone ONLY after buyers vanished. And recently they have.

Get this, last week saw 97% of our signals for sale. The below snapshot is a breakdown of that action by market cap from May 9th – May 13th:

Big Money Buying and Selling by Market Cap

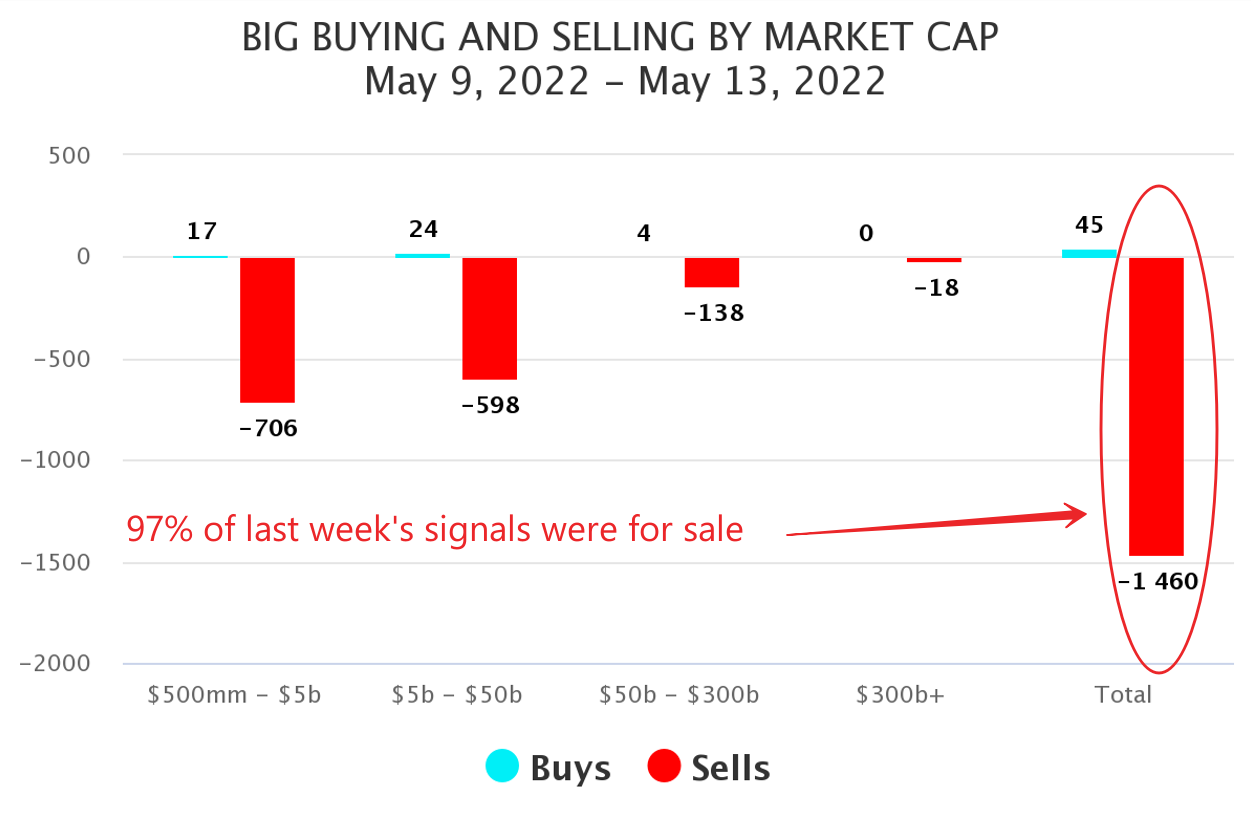
Sellers outnumbered buyers by a ratio of 31:1. That’s “correlation of 1” type action, meaning everything was sold. De-risking was across the board with 10 out of 11 sectors feeling outsized selling. Let’s look at that next.

Here’s last week’s sector action in our weekly MAP View report. As you’ll notice, each sector is ranked from highest to lowest by score (left side). Off to the right is what’s important. In yellow displays any time a sector has >25% of its universe bought/sold.

All groups were sold hard except Energy:

MAPsignals Sector Ranking
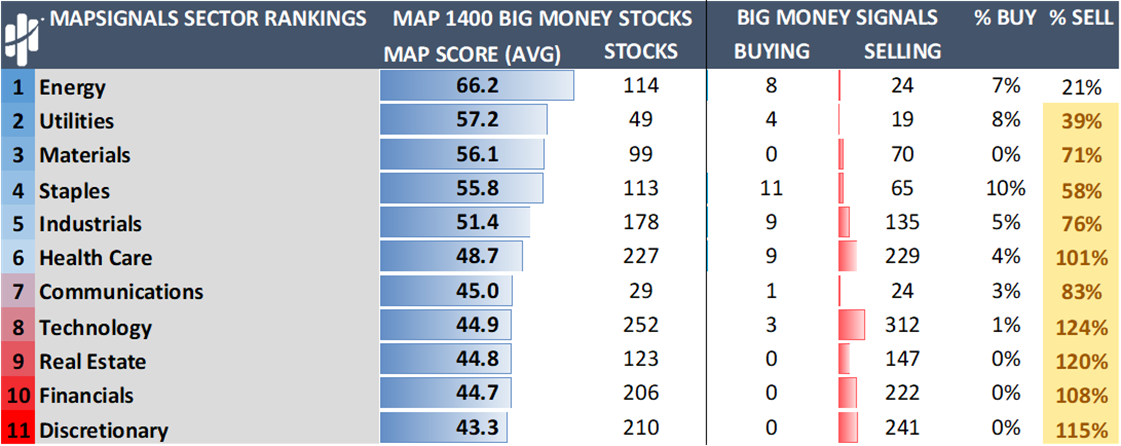
Source: FactSet, MAPsignals

We’d have to go back to the pandemic lows to see similar action. And that’s also the last time we saw true oversold conditions.

Here’s a reminder of the last few prior oversold instances. I’ve circled them in yellow:

Big Money Index hitting Oversold

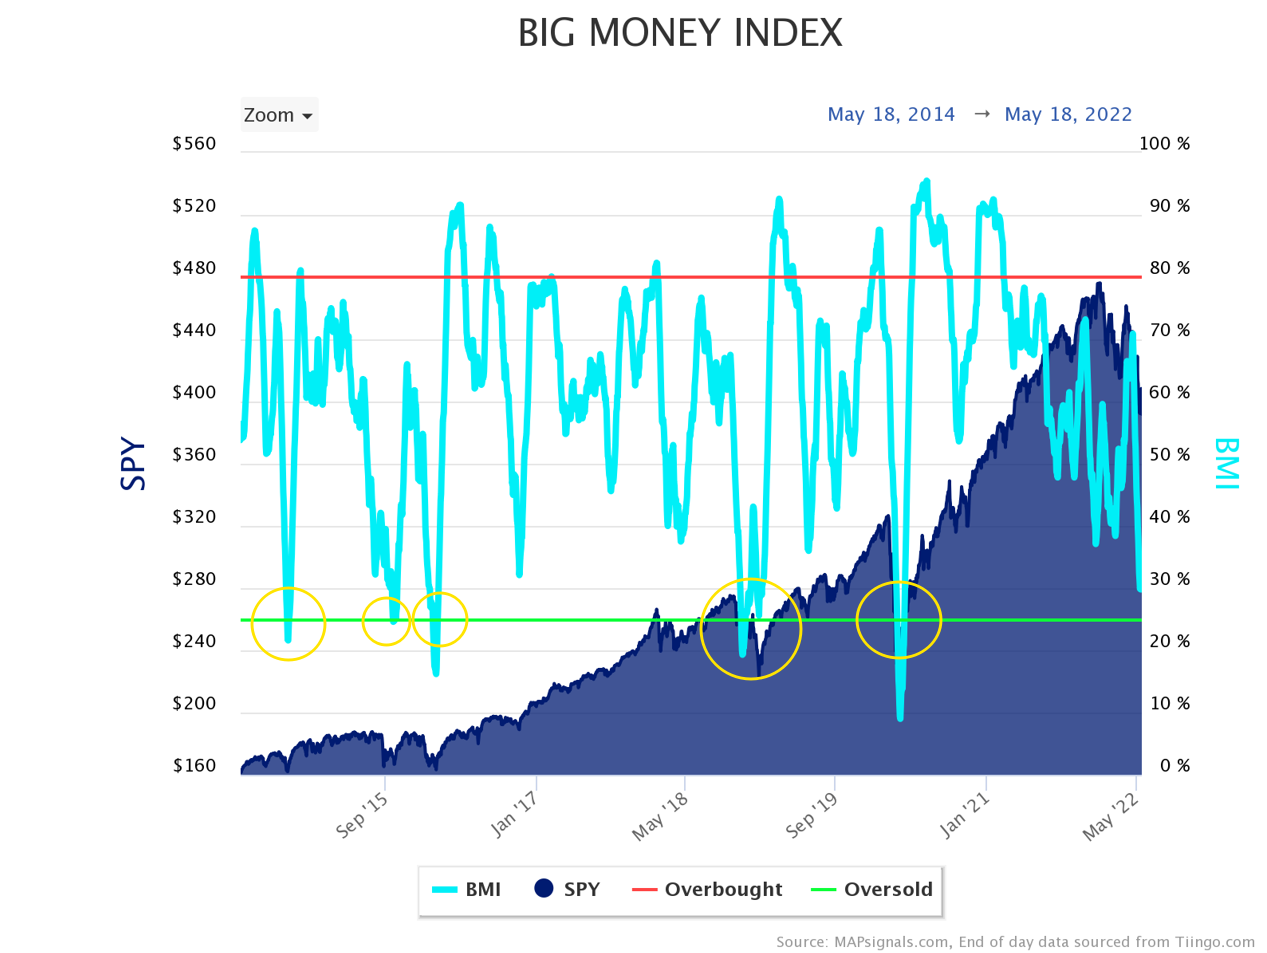
Each of those yellow areas were depressed periods for stocks, very similar to today. I remember them vividly. Headlines were gloomy just like now with awful sentiment. Most felt the investing world was ending.

But the world didn’t end. Businesses ultimately thrived. Markets eventually recovered. Out of despair, new heights were formed. So, as we get ever closer to oversold conditions, here’s a reminder of what we have to potentially look forward to.

Below are the 20 oversold instances going back to 1990. On the left side of the diagram shows a few things. First, oversold conditions typically last 3 weeks (20 trading days) and markets generally trough 2 weeks later.

On the right side is the bigger message: These are some of the best times to buy stocks for the long-term:

(Click image to enlarge)

Average days to through and % drop taken from periods of greater than 1 day

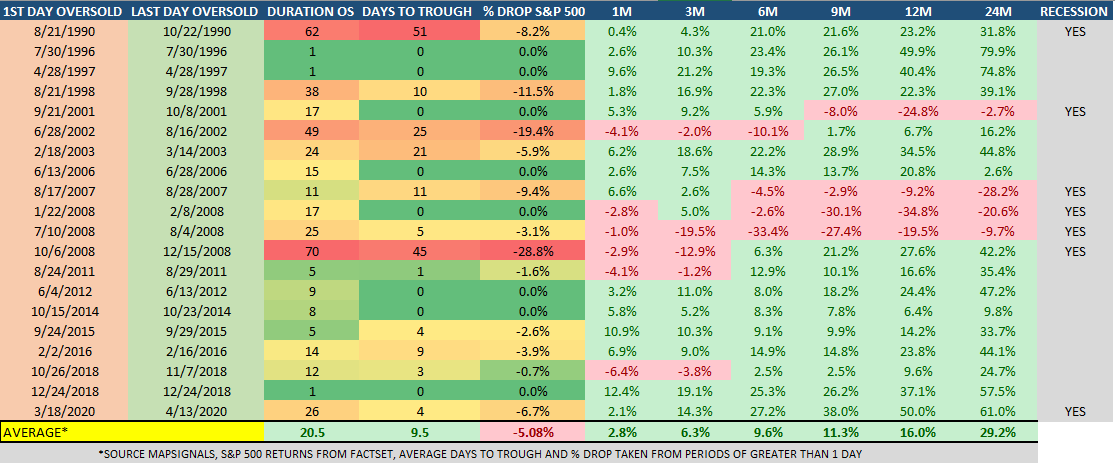
That’s right. On average, the S&P 500 is up 9.6% six months after reaching oversold. Twelve months later stocks gained 16%. Two years later markets saw a whopping 29.2% surge.

Only time will tell if “this time” will lead to big gains. My bet is there’s opportunity in a sea of red.

Let’s wrap up.

Here’s the bottom line: Our data is signaling a massive buy opportunity is near. We’re in the midst of a market washout. All stocks are getting hit hard. Correlation is 1. The Big Money Index should hit oversold within days.

Going through painful pullbacks is never fun. But history has proven that over the long-run, markets eventually work themselves out. I believe companies will grow again.

I can’t tell you what stocks are going to do tomorrow or the next day. No one can. But I’m confident that oversold environments won’t last forever. As a long-term investor, now is the time to be greedy rather than fearful.

That’s the winning attitude.

Don’t give up.

***And if you want to follow our BMI daily and other cool data-driven insights, get started with any level of MAPsignals subscription here. Let data improve your investing process.


Lucas Downey
Lucas Downey

Lucas is co-founder of MAPsignals. His full bio can be found here.
Prior to MAP, he was Head of ETF Sales at Cantor Fitzgerald & SVP of Derivatives at Jefferies, LLC.

Spread the word!

Category: All, Big Money Insights Weekly

Previous Post: «Best ETFs to Buy Now for June 2022 Best ETFs to Buy Now for June 2022
Next Post: Oversold Stock Opportunities »

Reader Interactions

Leave a Reply Cancel reply

Your email address will not be published. Required fields are marked *

Primary Sidebar

Get Big Money Insights for FREE

Want to know where the Big Money is headed?

Just enter your email address below. You'll get our FREE NEWSLETTER sent directly to your inbox.

We call it Big Money Insights... It’s your weekly sneak peek at the powerful market-moving forces that are hidden from 99% of investors.

"*" indicates required fields

This field is for validation purposes and should be left unchanged.

Categories

  • All
  • Big Money Insights Weekly
  • Big Money Series
  • Macro Insights
  • MAP In The Media
  • Members Only
  • Performance
  • Podcast
  • Special Reports
  • Stocks
  • Videos & Interviews
  • White Papers

Archives

  • June 2022
  • May 2022
  • April 2022
  • March 2022
  • February 2022
  • January 2022
  • December 2021
  • November 2021
  • October 2021
  • September 2021
  • August 2021
  • July 2021
  • June 2021
  • May 2021
  • April 2021
  • March 2021
  • February 2021
  • January 2021
  • December 2020
  • November 2020
  • October 2020
  • September 2020
  • August 2020
  • July 2020
  • June 2020
  • May 2020
  • April 2020
  • March 2020
  • February 2020
  • January 2020
  • December 2019
  • November 2019
  • October 2019
  • September 2019
  • August 2019
  • July 2019
  • June 2019
  • May 2019
  • April 2019
  • March 2019
  • February 2019
  • January 2019
  • December 2018
  • November 2018
  • October 2018
  • September 2018
  • August 2018

Follow us on Twitter

MAPsignals Follow 619 842

MAPsignals is a data platform that tracks institutional money flows in and out of the market.

mapsignals
mapsignals avatar; MAPsignals @mapsignals ·
30 Jun 1542518642461384709

The first half of 2022 is in the books.

The #bearmarket has sent #stocks tumbling.

Today, @LukeDowney reviews how sectors performed YTD and highlights two #sectors primed for upside. $XLY $XLK

Read here: https://mapsignals.com/map-blog/two-sectors-are-primed-for-upside/

Image for the Tweet beginning: The first half of 2022 Twitter feed image.
Reply on Twitter 1542518642461384709 Retweet on Twitter 1542518642461384709 0 Like on Twitter 1542518642461384709 1 Twitter 1542518642461384709
Load More...

Subscribe To Our YouTube Channel

MAPsignals

MAPsignals
#Capitulation #BearMarket2022 #StockMarketSelloff
Stock market capitulation is here. In this video, Luke dives into what capitulation is and what it means for stocks. Check out our latest blog post: https://mapsignals.com/map-blog/

What does capitulation mean for markets? It is when there's no leadership and investors throw in the towel. You've heard the saying, "sell first, ask question later?" That's how Wall Street thinks.

But these rare moments often lead to bargains for stocks. Capitulation can often lead to bottoms being formed in stocks.

As Lucas Downey shows, these moments are usually when investors should focus on quality companies in this bear market environment. Long-term is the best mindset in a bear market.

The best stock market analysis we've found is following the Big Money. MAPsignals doesn't argue with data.

Learn more at www.MAPsignals.com
Remember this is not personal investment advice of any kind. This video is for entertainment purposes only. Our focus is to help investors make sense of markets with data.

Our disclaimer can be found here: https://mapsignals.com/contact/

Music by Karl Casey @ White Bat Audio
Stock Market Capitulation is Here | Bear Market 2022
YouTube Video UC4nueJix0bSLmZyilUuCVrQ_xzXHj_aJvss
Load More... Subscribe

Footer

© 2021 Mapsignals.com

  • Home
  • Contact & Disclaimer
  • Privacy Policy
  • Terms & Conditions
  • Cookie Policy (US)
  • FAQ

Copyright © 2022 · Mai Law Pro on Genesis Framework · WordPress · Log in

✕
What Happened to Risk Assets White Paper is Here

Get your copy here and take a journey through our thoughts on margin and leverage.

Enter your email address below and you'll get our FREE NEWSLETTER sent directly to your inbox. 

 We call it Big Money Insights... It’s your weekly sneak peek at the powerful market-moving forces that are hidden from 99% of investors.

Manage Cookie Consent
We use cookies to optimize our website and our service.
Functional Always active
The technical storage or access is strictly necessary for the legitimate purpose of enabling the use of a specific service explicitly requested by the subscriber or user, or for the sole purpose of carrying out the transmission of a communication over an electronic communications network.
Preferences
The technical storage or access is necessary for the legitimate purpose of storing preferences that are not requested by the subscriber or user.
Statistics
The technical storage or access that is used exclusively for statistical purposes. The technical storage or access that is used exclusively for anonymous statistical purposes. Without a subpoena, voluntary compliance on the part of your Internet Service Provider, or additional records from a third party, information stored or retrieved for this purpose alone cannot usually be used to identify you.
Marketing
The technical storage or access is required to create user profiles to send advertising, or to track the user on a website or across several websites for similar marketing purposes.
Manage options Manage services Manage vendors Read more about these purposes
View preferences
{title} {title} {title}